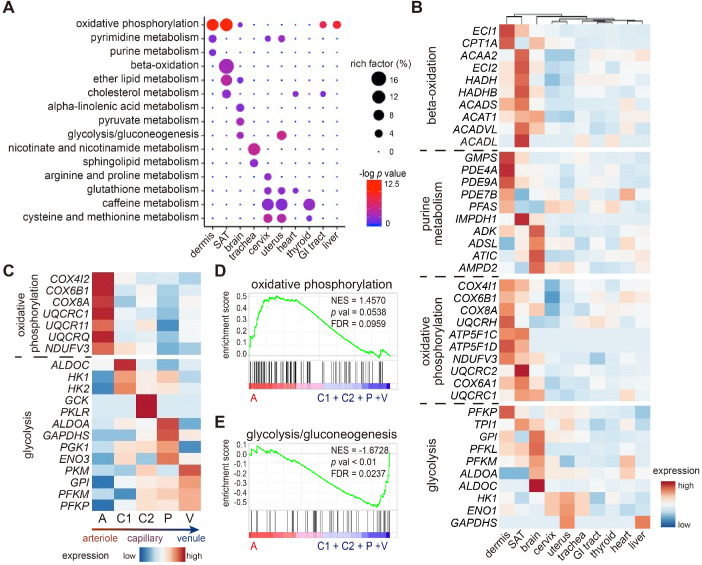
Figure 4.
Metabolic heterogeneity in ECs across tissues and within dermis. (A) KEGG analysis of metabolic pathways across ECs from different tissues/organs. The circle size represents the rich factor, and the color represents the -log p value. (B) Heatmap of expressions of representative metabolic genes among ECs from different tissues. (C) Heatmap of expressions of oxidative phosphorylation and glycolytic genes across 5 dermal EC clusters. (D) GSEA analysis of the dataset of dermal ECs against the oxidative phosphorylation geneset. (E) GSEA analysis of the dataset of dermal ECs against the glycolysis/gluconeogenesis geneset. A positive enrichment score on the y axis indicates positive correlation with cluster A and a negative enrichment score indicates a negative correlation. Cluster A: arteriole ECs; Cluster C1, C2: capillary ECs; Cluster P: post-capillary ECs; Cluster V: venule ECs. ECs: vascular endothelial cells; FDR: false discovery rate; GI: gastrointestinal; GSEA: gene set enrichment analysis; KEGG: kyoto encyclopedia of genes and genomes; NES: normalized enrichment score; SAT: subcutaneous adipose tissue.

