Abstract
Osteosarcoma often occurs in children and adolescents and causes poor prognosis. The role of RNA-binding proteins (RBPs) in malignant tumors has been elucidated in recent years. Our study aims to identify key RBPs in osteosarcoma that could be prognostic factors and treatment targets. GSE33382 dataset was downloaded from Gene Expression Omnibus (GEO) database. RBPs extraction and differential expression analysis was performed. Gene Ontology (GO) and Kyoto Encyclopedia of Genes and Genomes (KEGG) enrichment analysis were performed to explore the biological function of differential expression RBPs. Moreover, we constructed Protein-protein interaction (PPI) network and obtained key modules. Key RBPs were identified by univariate Cox regression analysis and multiple stepwise Cox regression analysis combined with the clinical information from Therapeutically Applicable Research to Generate Effective Treatments (TARGET) database. Risk score model was generated and validated by GSE16091 dataset. A total of 38 differential expression RBPs was identified. Go and KEGG results indicated these RBPs were significantly involved in ribosome biogenesis and mRNA surveillance pathway. COX regression analysis showed DDX24, DDX21, WARS and IGF2BP2 could be prognostic factors in osteosarcoma. Spearman’s correlation analysis suggested that WARS might be important in osteosarcoma immune infiltration. In conclusion, DDX24, DDX21, WARS and IGF2BP2 might play key role in osteosarcoma, which could be therapuetic targets for osteosarcoma treatment.
Keywords: osteosarcoma, RBPs, bioinformation, prognosis, risk score model, immune infiltration
Introduction
Osteosarcoma is the most common primary malignant bone tumor in children and adolescents and localizes in long bones which grow rapidly.1 The incidence of osteosarcoma is bimodal, one peak is in patients reached the age of puberty and another occurs in those older than the age of 75.2 At present, the 5-year overall survival rate of osteosarcoma patients has been greatly increased to about 70% due to the combination of chemotherapy and surgery.3 While clinical outcomes of patients with metastasis are still poor, only 20% of diagnosed patients can survive past 5 years.4 Hence it is essential to identify novel targets for diagnosis and prognosis evaluation in osteosarcoma.
RNA-binding proteins (RBPs) mainly regulate the process of mRNA by binding mRNAs and forming ribonucleoprotein (RNP) complexes and play a key role in transcription, splicing, mRNA stability, mRNA transport and translation.5 Recently, several RBPs have been evidenced that can affect tumorigenesis, progression and invasion in various cancers.6 High expression level of NONO, an RBP which is involved in pre-mRNA splicing step, may promote proliferation of breast cancer cells.7 Downregulated expression of FXR1 inhibit progression of prostate cancer cells.8 By binding pre-miR-34a selectively, SART3 leads to a G1 phase cell cycle arrest in lung cancer cells.9 Moreover, previous studies also explored the function of RBPs in osteosarcoma. Hu et al proved that expression level of PUM2 was lower in osteosarcoma patients and progression and migration of osteosarcoma cells could be inhibited by upregulating expression of PUM2.10 Wang et al suggested that IGF2BP1 was upregulated in osteosarcoma tissues, which had a close relation to dismal prognosis in osteosarcoma patients.11 However, systematic analysis of RBPs in osteosarcoma patients prognosis is inadequate yet.
In the present study, we downloaded osteosarcoma RNA-sequencing dataset from Gene Expression Omnibus (GEO) database for screening. Then biological functions of differentially expressed RBPs were further discussed. Besides, we identified several RBPs that could be prognostic factors in osteosarcoma patients by combining with clinical data from Therapeutically Applicable Research to Generate Effective Treatments (TARGET) database and result was validated in another GEO dataset. Furthermore, we explored the correlation between these hub RBPs and tumor immune infiltration via CIBERSOFT and ESTIMATE algorithm. Then, qRT-PCR assays showed that the expression levels of the hub RBPs were consistent with the differential expression analysis. Our findings may provide new targets for osteosarcoma treatment.
Material and Methods
Data Source
The mRNA sequencing dataset GSE33382 which contained 3 normal samples and 84 tumor samples was downloaded from GEO database (https://www.ncbi.nlm.nih.gov/geo/query/acc.cgi?acc=GSE33382). Clinical dataset was downloaded from TARGET database (https://ocg.cancer.gov/programs/target) and 85 patients with survival time and status were included in the analysis. Besides, a total of 34 patients with clinical information in dataset GSE16091 (https://www.ncbi.nlm.nih.gov/geo/query/acc.cgi?acc=GSE16091) was downloaded from GEO database for validation.
Identification of Differentially Expressed RBPs
RPBs were extracted from total genes in GSE 33382 series matrix. Then we used the limma package (https://www.bioconductor.org/packages/release/bioc/html/limma.html) in R 4.0.2 to identify differentially expressed RBPs between normal samples and tumor samples according to |log2 fold change (FC)| > 1 and adj. P < 0.05.
Functional Enrichment Analysis
Gene Ontology (GO) analysis comprised of biological process (BP), cellular component (CC) and molecular function (MF) and Kyoto Encyclopedia of Genes and Genomes (KEGG) analysis were performed to explore the biological function and pathway of differentially expressed RBPs by using R package clusterprofiler (http://www.bioconductor.org/packages/release/bioc/html/clusterProfiler.html) . The adj. P < 0.05 was considered as significant results.
Construction of PPI Network and Key Modules
PPI information of all differentially expressed RBPs was downloaded after processed by STRING database (http://www.string-db.org/). Then we used Cytoscape 3.8.0 software to construct PPI network. Subsequently, Molecular Complex Detection (MCODE) app (http://apps.cytoscape.org/apps/mcode) in Cytoscape was employed to screening key modules.
Identification of Prognostic RBPs and Prognostic Model Construction
The univariate cox regression analysis was performed to identify prognostic RBPs by using survival package (https://cran.r-project.org/web/packages/survival/index.html) in R software. All RBPs from PPI network was filtered with the value of log-rank P < 0.05. Then a multivariate Cox proportional hazards regression model was established based on RPBs from univariate cox regression analysis. According to the risk score formula: risk score = Σ(Coef*expGENE) we calculated risk score. Afterward, the TARGET cohort was divided into low-risk and high-risk groups according to the median of the risk score. Kaplan–Meier plots were used to evaluate the overall survival (OS) between 2 groups. Besides, we created a receiver operating characteristic (ROC) curve by using survivalROC package (https://cran.r-project.org/web/packages/survivalROC/index.html) to assess sensitivity and specificity of our model. Furthermore, a validation cohort based on GSE16091 was used to verify the reliability of the constructed model. The nomogram was generated by using rms package (https://cran.r-project.org/web/packages/rms/index.html) of R to predict survival rates of patients at 1, 3 and 5 years.
Correlation Analysis Between Prognostic RBPs and Tumor Immune Infiltration
Relative immune cells proportion in TARGET samples was calculated by using R package CIBERSOFT (https://cibersort.stanford.edu/download.php), the P-value < 0.05 was considered as significant results. Then significant results were involved in tumor purity analysis via R package ESTIMATE (https://r-forge.r-project.org/projects/estimate). Scatter plots were generated based on Spearman correlation analysis between prognostic RBPs and immune cells, tumor purity by R package ggplot2 (https://CRAN.R-project.org/package=ggplot2).
Cell Culture
Osteoblast cell line hFOB 1.19 and osteosarcoma cell lines MG-63 and MNNG/HOS were purchased from American Type Culture Collection (ATCC). hFOB 1.19 cells were cultured in complete growth medium consisting of a 1:1 mixture of Dulbecco’s modified Eagle’s medium and Ham’s F12 medium (DMEM/F12) supplemented with 10% fetal bovine serum (FBS), 0.3 mg/ml G418 (Procell, Wuhan, China) and 1% penicillin and 1% streptomycin (100/mL). MG-63 and MNNG/HOS cell lines were cultured in Minimum Essential Medium (MEM) supplemented with 10% FBS and 1% penicillin and 1% streptomycin (100/mL). All cell lines were cultured at 37°C, 5% CO2.
qRT-PCR Assays
Total RNA of the target genes was extracted from the cultured cells using TRIzol reagent (Cwbio, Jiangsu, China) and quantified by using an Ultra-micro UV analyzer (Thermo Fisher, MA, USA). Reverse transcription was using Evo M-MLV RT Kit (Agbio, Hunan, China) according to the manufacturer’s instructions. Then qRT-PCR was performed using the SYBR® Green Premix Pro Taq HS qPCR Kit (Agbio, Hunan, China) on CFX Connect Real-Time PCR System (Bio-Rad, CA, USA). Each sample was measured in triplicate. GAPDH was used as an endogenous control and results were analyzed with the 2-ΔΔCq method. The primer sequences for each gene are as following:
Experiment Data Statistical Analysis
GraphPad Prism 8 was used for analyzing experiment data. The results are expressed as the mean ± standard deviation (SD). Independent sample t-tests were employed to identify significant differences, and P < 0.05 was considered statistically significant.
Results
Differentially Expressed RBPs
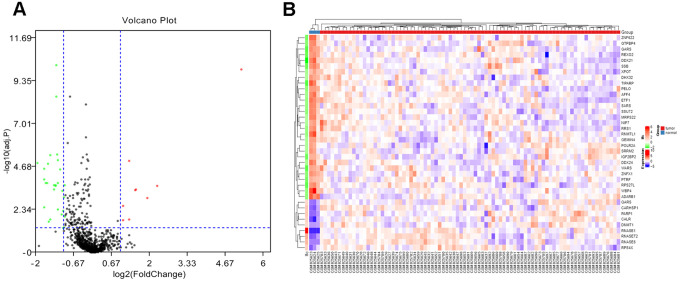
GSE33382 dataset was downloaded from GEO database and extraction of overlapped RBPs was performed according to the previous study.12 We processed a total of 1136 RBPs by R package “limma” and 38 differentially expressed RBPs were obtained(adj. P < 0.05, |log2FC)| > 1.0), including 9 upregulated RBPs and 29 downregulated RBPs (Figure 1).
Figure 1.
Identification of differentially expressed RBPs from dataset. (A) Volcano plot of differentially expressed RBPs analysis for GSE33382. The red dots represent for up-regulated RBPs, the green dots represent for down-regulated RBPs. The thresholds for identification are shown as blue dotted lines [|log2 fold-change (FC)| > 1 and adj. P < 0.05] . (B) Heatmap of differentially expressed RBPs.
GO and KEGG Pathway Enrichment Analysis
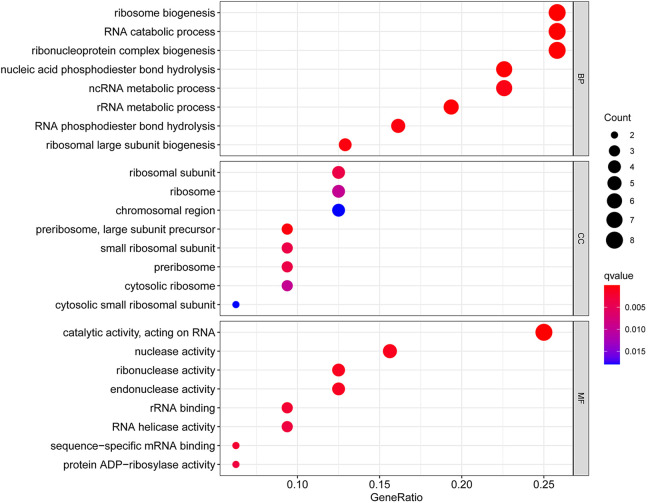
Differentially expressed RBPs were analyzed by GO and KEGG for their biological functions. As presented in Figure 2, these RBPs were mainly involved in ribosome biogenesis and RNA catabolic process in GO BP category. In GO CC category, ribosomal subunit was the most significant term. The GO MF category analysis were notably enriched in endonuclease activity, and catalytic activity, acting on RNA.
Figure 2.
GO enrichment analysis for differentially expressed RBPs.
| Gene | Forward | Reverse |
|---|---|---|
| GAPDH | 5′-AGAAGGCTGG GGCTCATTTG-3′ | 5′-AGGGGCCATCC ACAGTCTTC-3′ |
| DDX21 | 5′-CTTCCTCTCCA CGCGGTTG-3′ | 5′-GCGGTGTCTGA TTCCAAACC-3′ |
| DDX24 | 5′-GCGGTTTCTGA GGTTCTTCAC-3′ | 5′-TGCCACAGCTT GACTGCTTT-3′ |
| IGF2BP2 | 5′-AGCTAAGCGGG CATCAGTTTG-3′ | 5′-CCGCAGCGGGA AATCAATCT-3′ |
| WARS | 5′-CCAGATGCCAC AGAAGCTGA-3′ | 5′-GCCGGTGGCTC TCTCTATTC-3′ |
Through KEGG pathway enrichment analysis, we discovered differential expressed RBPs were involved in mRNA surveillance pathway (Table 1).
Table 1.
KEGG Pathway Enrichment Analysis of Differential Expression RBPs.
| KEGG ID | Description | P-value | adj. P | Count |
|---|---|---|---|---|
| hsa03015 | mRNA surveillance pathway | 0.000544283 | 0.011974229 | 3 |
| hsa03008 | Ribosome biogenesis in eukaryotes | 0.01539676 | 0.169364362 | 2 |
| hsa03010 | Ribosome | 0.029857959 | 0.205129373 | 2 |
| hsa03013 | RNA transport | 0.039893333 | 0.205129373 | 2 |
Construction of PPI Network
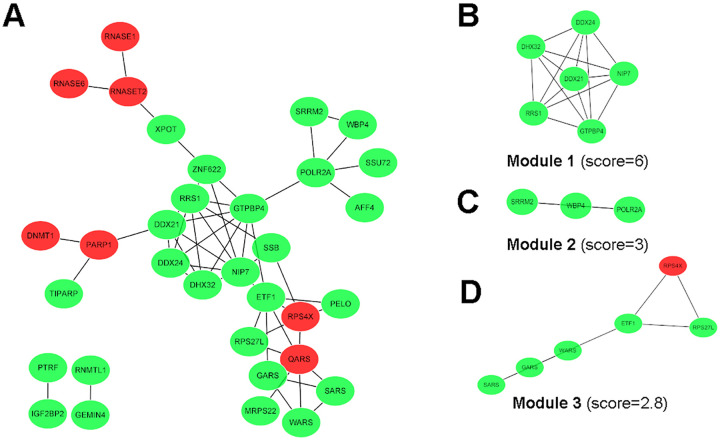
In order to figure out the connection between differentially expressed RBPs, the PPI network which including 38 nodes and 54 edges based on STRING database was structured by Cytoscape software (Figure 3A). We further used MCODE app of Cytoscape to identify key modules and obtained 3 modules figure (Figure 3 B-D). Of all RBPs collected in modules, only RPS4X was upregulated. KEGG enrichment analysis indicated RBPs were greatly associated with ribosome biogenesis in eukaryotes in module 1, RNA polymerase and Huntington disease in module 2, ribosome and mRNA surveillance pathway in module 3 (Table 2).
Figure 3.
PPI network and key modules. (A) The whole PPI network. (B) Subnetwork of module 1. (C) Subnetwork of module 2. (D) Subnetwork of module 3.
Table 2.
KEGG Pathway Enrichment Analysis of Key Modules.
| Module | KEGG ID | Description | P-value | adj. P | Count |
|---|---|---|---|---|---|
| Module 1 | hsa03008 | Ribosome biogenesis in eukaryotes | 0.01391823 | 0.01391823 | 1 |
| Module 2 | hsa03020 | RNA polymerase | 0.003852367 | 0.007704735 | 1 |
| hsa05016 | Huntington disease | 0.038026594 | 0.038026594 | 1 | |
| Module 3 | hsa03010 | Ribosome | 0.001134522 | 0.002269045 | 2 |
| hsa03015 | mRNA surveillance pathway | 0.033547604 | 0.033547604 | 1 |
The red nodes represent upregulated RBPs and the green nodes represent downregulated RBPs.
Screening of Prognostic RBPs and Risk Model Construction
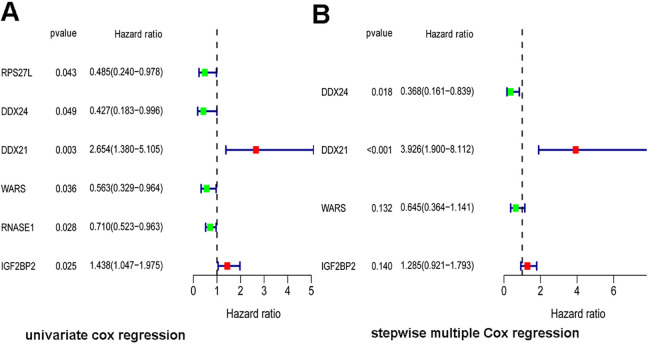
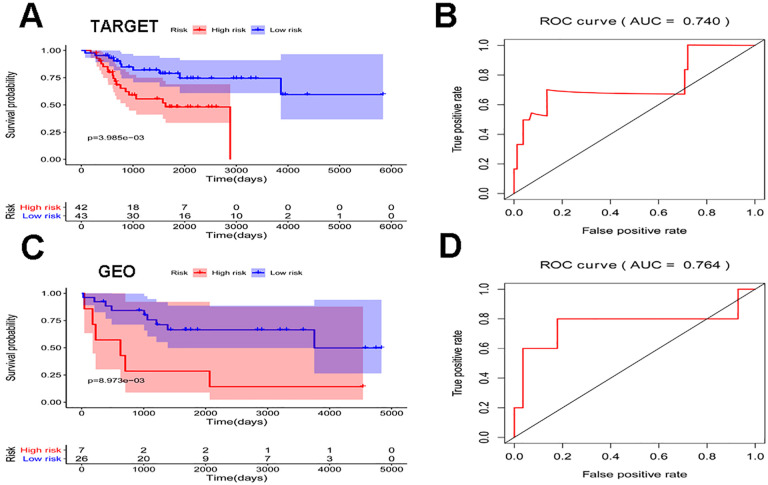
To identify prognostic RBPs from PPI network, a univariate cox regression analysis was performed and 6 hub RBPs were obtained from TARGET cohort (Figure 4A). Furthermore, the 6 hub RBPs were assessed by stepwise multiple Cox regression analysis and the result revealed 4 hub RBPs(DDX24, DDX21, WARS, IGF2BP2) were prognostic factors of osteosarcoma (Figure 4B). Then, the risk score for each patient was calculated based on the formula: Risk score = (-0.99985*expDDX24) + (1.367646*expDDX21) + (-0.43916*expWARS) + (0.250946*expIGF2BP2). High-risk group and low-risk group were distinguished according to the median risk score and the Kaplan-Meier curve indicated that compared with the patients in low-risk group, those in high-risk group hold a worse OS (Figure 5A). In order to evaluate the sensitivity and specificity of the risk score we performed a time-dependent ROC curve and the area under the ROC curve (AUC) of risk score was 0.740, which proved the 4 hub genes could predict prognosis of osteosarcoma (Figure 5B).
Figure 4.
Cox regression analysis of key RBPs from PPI network. (A) Univariate Cox regression analysis. (B) Stepwise multiple Cox regression analysis.
Figure 5.
Survival curve and ROC curve analyses of TARGET and GEO cohort. (A) Survival curve of risk score in TARGET cohort. (B) ROC curve of risk score in TARGET cohort. (C) Survival curve of risk score in GEO cohort. (D) ROC curve of risk score in GEO cohort.
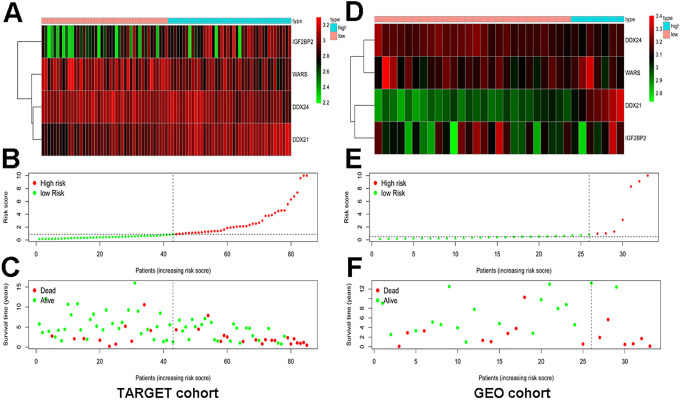
To evaluate the predictive ability of the 4 hub genes in other datasets, we chose GSE16091 dataset as validation cohort. The results of GSE16091 showed the OS of patients in high-risk group was significantly worse than that in low-risk group and the AUC of risk score was 0.764, which implied that the 4 hub genes had a better predictive ability figure (Figure 5C-D) . We also drew expression heatmap of the 4 hub genes and distribution of risk score and clinical status in TARGET and GEO cohort which displayed in Figure 6A-F.
Figure 6.
Expression heatmap, risk score distribution and survival status in TARGET cohort and GEO cohort. (A) Expression heatmap of hub RBPs in TARGET cohort. (B) Risk score distribution in TARGET cohort. (C) Survival status in TARGET cohort. (D) Expression heatmap of hub RBPs in GEO cohort. (E) Risk score distribution in GEO cohort. (F) Survival status in GEO cohort.
Construction of Predictive Genes Nomogram
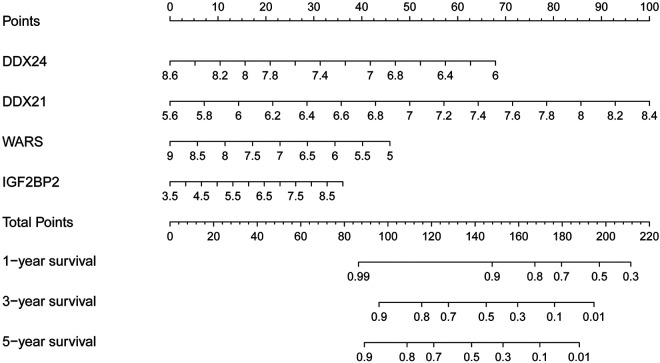
To develop a quantitative method to estimate prognosis of osteosarcoma patients, we constructed a nomogram in TARGET cohort. Points were assigned to each hub gene according to its contribution to survival. By summing the points of hub genes, we could predict the survival rates of 1, 3, and 5 years (Figure 7).
Figure 7.
Nomogram for predicting 1-, 3-, and 5-year OS of osteosarcoma patients in TARGET cohort.
Correlation of Prognostic RBPs and Immune Infiltration
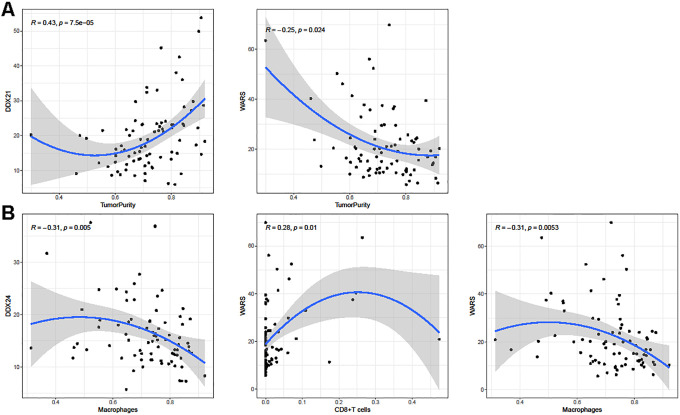
We further explored the roles of the 4 prognostic RBPs in osteosarcoma immune infiltration by “CIBERSOFT” and “ESTIMATE” packages in R project. A total of 22 immune cells relative proportion were analyzed in TARGET samples, finally data of 82 samples were obtained for further analysis (P < 0.05) . We studied the correlation between DDX21, DDX24, IGF2BP2, WARS expression and B cells (B cells proportion = B cells naive + B cells memory + Plasma cells), CD8+T cells, CD4+T cells (CD4+T cells proportion = T cells CD4 naive + T cells CD4 memory resting + T cells CD4 memory activated), macrophages (macrophages proportion = macrophages M0 + macrophages M1 + macrophages M2), dendritic cells (dendritic cells proportion = dendritic cells resting + dendritic cells activated), neutrophils and tumor purity. Scatter plots of significant results were generated with Spearman’s correlation and a total of results were displayed in Table 3. As shown in Figure 8, DDX21 and WARS expression were significantly associated tumor purity. Besides, DDX24 expression was correlated with macrophages and WARS expression was correlated with CD8+T cells and macrophages, while DDX21 and IGF2BP2 showed no significant correlation with immune cells. These findings suggested that DDX21, DDX24 and WARS were involved in osteosarcoma immune infiltration especially WARS, might play a more important role in tumor immune infiltration.
Table 3.
Total Results of Correlation Between Hub RBPs and Immune Infiltration.
| Description | DDX21 | DDX24 | IGF2BP2 | WARS | ||||
|---|---|---|---|---|---|---|---|---|
| R | P | R | P | R | P | R | P | |
| Tumor Purity | 0.43 | **** | 0.1 | 0.37 | 0.17 | 0.13 | -0.25 | * |
| B cells | -0.13 | 0.23 | 0.024 | 0.83 | -0.037 | 0.74 | 0.079 | 0.48 |
| CD8+T cells | -0.20 | 0.077 | -0.03 | 0.79 | -0.045 | 0.69 | 0.28 | * |
| CD4+T cells | 0.13 | 0.25 | 0.18 | 0.097 | -0.052 | 0.64 | 0.078 | 0.49 |
| Macrophages | 0.017 | 0.88 | -0.31 | ** | 0.16 | 0.15 | -0.31 | ** |
| Dendritic cells | 0.066 | 0.56 | -0.15 | 0.19 | -0.045 | 0.69 | -0.11 | 0.34 |
| Neutrophils | 0.13 | 0.23 | -0.093 | 0.4 | 0.048 | 0.67 | -0.093 | 0.4 |
R, R value of Spearman’s correlation. *P < 0.05. **P < 0.01. ***P < 0.001. ****P < 0.0001.
Figure 8.
Spearman’s correlation analysis between hub RBPs and tumor immune infiltration. (A) Correlation between DDX21, WARS and tumor purity. (B) Correlation between DDX24, WARS and immune cells.
Expression of the Hub RBPs in Osteosarcoma Cell Lines
Finally, qRT-PCR assays were performed to detect the expression of the hub RBPs in hFOB 1.19, MG-63 and MNNG/HOS cell lines. The results showed that, compared with osteoblast cell line (hFOB 1.19) the expression of DDX21, DDX24, IGF2BP2 and WARS were all significantly lower (P < 0.05) in osteosarcoma cell lines (MG-63 and MNNG/HOS) (Figure 9).
Figure 9.
Expression of the 4 hub RBPs in osteosarcoma cell lines (MG-63 and MNNG/HOS) and osteoblast cell line (hFOB 1.19). *P < 0.05.
Discussion
In this study, we obtained 38 differentially expressed RBPs between tumor and normal samples from GSE33382, a GEO dataset of osteosarcoma. To find the possible biological function and connection of these RBPs, we performed GO and KEGG enrichment analysis and constructed the PPI network. In addition, we identified 4 hub RBPs via univariate Cox regression analysis, multiple stepwise Cox regression analysis combined with the clinical information from TARGET database. Then we constructed a risk score model to evaluate the predictive ability of the 4 hub RBPs in osteosarcoma patients. Additionally, we studied the correlation between the 4 hub RBPs with tumor immune infiltration. The expression of hub RBPs was validated in osteosarcoma cell lines.
Our results of GO enrichment analysis showed the enrolled RBPs were mostly associated with ribosome biogenesis, RNA catabolic process, ribosomal subunit, endonuclease activity and catalytic activity, acting on RNA. Previous study demonstrated that inhibition of ribosome biogenesis could reduce cell proliferation of osteosarcoma cell lines via p53-p21Cip1-pRB pathway.13 Besides, the dramatic effects of ribosome biogenesis in cancer has been realized which can lead to new therapy target.14,15 The KEGG pathway enrichment analysis displayed these RBPs were mainly enriched in mRNA surveillance pathway. Nonsense-mediated mRNA decay (NMD) is a conserved mRNA surveillance pathway, which can inactive tumor-suppressor gene function and contribute to adaptation to the tumor microenvironment.16 There was study suggesting that high levels of NMD could cause the absence of neoantigen expression in OS.17
To further understand the interaction between the differentially expressed RBPs, we constructed a PPI network and obtained 3 key modules. Little of these RBPs have been studied in osteosarcoma, but some of them have been reported in other tumors. Interestingly, the majority of RBPs in key modules were downregulated in osteosarcoma tissues, while they were upregulated in many cancers,18-21 which might need deeper studies to decipher their mechanisms in osteosarcoma. Only RPS4X was upregulated in key modules and plays different roles in cancers. The expression of RPS4X in intrahepatic cholangiocarcinoma patients is greatly upregulated and such a high expression of RPS4X is associated with poor prognosis.22 In contrast, low expression of RPS4X displays a worse clinical outcome in patients with bladder cancer or ovarian cancer.23,24
Moreover, we applied univariate Cox regression analysis and multiple Cox regression analysis to select prognostic RBPs from PPI network. The results showed that DDX24, DDX21, WARS and IGF2BP2 were bound up with prognosis of patients with osteosarcoma. DDX21 is a DEAD-box RNA helicase involved in control of ribosome biogenesis through RNA polymerase I and II.25 It has been proved that the upregulation of DDX21 can promote the proliferation of gastric cancer and breast cancer,26,27 while the downregulation of DDX21 increases metastasis of breast cancer and causes poor clinical outcomes, which suggests that metastasis is a higher risk factor.28 As a DEAD-box RNA helicase like DDX21, DDX24 depletion significantly inhibits cancer cell growth and high-expression of DDX24 results in a lower survival rate in gastric cancer and breast cancer.29 IGF2BP2 is an insulin like growth factor 2 mRNA binding protein and involved in regulation of progression of osteosarcoma by binding with the long noncoding RNA of DDX11.30 WARS, also known as TrpRS, is a member of the aminoacyl-tRNA synthetase family, which mainly affects RNA transcription and translation. Ghanipour et al reported that the lower expression of WARS caused a poorer prognosis of patients, which indicated that WARS could be a protective gene in colorectal cancer.31 Then, we created a risk model to predict prognosis of osteosarcoma patients by using the 4 hub RBPs and clinical data from TARGET database. In addition, we acquired another dataset of GEO database for validation. The ROC curve of the both demonstrated the 4 RBPs could serve as predictive factors of prognosis. Moreover, we generated a nomogram to help calculate 1, 3, and 5 years survival rate.
Then we investigated the correlation between hub RBPs and tumor immune infiltration. Immunotherapy has gained wide attention in recent years. Several immune checkpoint inhibitors, such as nivolumab and pembrolizumab have been approved for the treatment of some advanced cancer while the effect of immunotherapy in osteosarcoma still awaits more research.32 Previous studies have identified immune-related genes via CIBERSOFT and ESTIMATE algorithm and explored their roles in osteosarcoma.33,34 In our study, we tried to figure out whether our hub RBPs were also involved in immune infiltration and the results indicated that WARS has the both significant correlation of tumor purity and immune cells which might elucidate a new role of RBPs in osteosarcoma.
However, our study still exists limitations. For one thing, the incidence of osteosarcoma is much lower than common malignancies, which accounts for inadequate information from database involved in analysis. And for another, all hub RBPs are identified by statistical methods, and their expression levels were only validated in osteosarcoma cell lines via qRT-PCR assays due to lack of clinical samples, the results were consistent with our differential expression analysis, while a further research about their expression in osteosarcoma tissues and function need to be examined via biological experiment in the following study.
Conclusion
In conclusion, DDX24, DDX21, WARS and IGF2BP2 have the potential to predict prognosis of osteosarcoma, WARS could have close correlation with tumor immune infiltration. Our study may contribute to find new targets for osteosarcoma treatment.
Abbreviations
- AUC
area under the ROC curve
- BP
biological process
- CC
cellular component
- GEO
Gene Expression Omnibus
- GO
Gene Ontology
- KEGG
Kyoto Encyclopedia of Genes and Genomes
- MCODE
Molecular Complex Detection;
- MF
molecular function
- NMD
nonsense-mediated mRNA decay
- OS
overall survival
- RBPs
- PPI
protein-protein interaction
- RNA
binding proteins
- RNP
ribonucleoprotein
- ROC
receiver operating characteristic
- TARGET
Therapeutically Applicable Research to Generate Effective Treatments.
Authors’ Note: Bei Li, MD, and Long Fang, MD, contributed equally to this article. Ethics statement is not applicable because all data are from public database.
Declaration of Conflicting Interests: The author(s) declared no potential conflicts of interest with respect to the research, authorship, and/or publication of this article.
Funding: The author(s) received no financial support for the research, authorship, and/or publication of this article.
ORCID iD: Bei Li, MD  https://orcid.org/0000-0001-9944-0097
References
- 1. Czarnecka A, Synoradzki K, Firlej W, et al. Molecular biology of osteosarcoma. Cancers. 2020;12(8):E2130. [DOI] [PMC free article] [PubMed] [Google Scholar]
- 2. Whelan J, Davis L. Osteosarcoma, chondrosarcoma, and chordoma. J Clin Oncol. 2018;36(2):188–193. [DOI] [PubMed] [Google Scholar]
- 3. Brownstein J, DeLaney T. Bone sarcomas and desmoids. Hematol Oncol Clin North Am. 2020;34(1):177–188. [DOI] [PubMed] [Google Scholar]
- 4. Fan T, Roberts R, Lizardo M. Understanding and modeling metastasis biology to improve therapeutic strategies for combating osteosarcoma progression. Front Oncol. 2020;10:13. [DOI] [PMC free article] [PubMed] [Google Scholar]
- 5. Mohibi S, Chen X, Zhang J. Cancer the’RBP’eutics-RNA-binding proteins as therapeutic targets for cancer. Pharmacol Ther. 2019;203:107390. [DOI] [PMC free article] [PubMed] [Google Scholar]
- 6. Pereira B, Billaud M, Almeida R. RNA-binding proteins in cancer: old players and new actors. Trends Cancer. 2017;3(7):506–528. [DOI] [PubMed] [Google Scholar]
- 7. Iino K, Mitobe Y, Ikeda K, et al. RNA-binding protein NONO promotes breast cancer proliferation by post-transcriptional regulation of SKP2 and E2F8. Cancer Sci. 2020;111(1):148–159. [DOI] [PMC free article] [PubMed] [Google Scholar]
- 8. Cao H, Gao R, Yu C, Chen L, Feng Y. The RNA-binding protein FXR1 modulates prostate cancer progression by regulating FBXO4. Funct Integr Genomics. 2019;19(3):487–496. [DOI] [PubMed] [Google Scholar]
- 9. Sherman E, Mitchell D, Garner A. The RNA-binding protein SART3 promotes miR-34a biogenesis and G cell cycle arrest in lung cancer cells. J Biol Chem. 2019;294(46):17188–17196. [DOI] [PMC free article] [PubMed] [Google Scholar]
- 10. Hu R, Zhu X, Chen C, Xu R, Li Y, Xu W. RNA-binding protein PUM2 suppresses osteosarcoma progression via partly and competitively binding to STARD13 3’UTR with miRNAs. Cell Prolif. 2018;51(6):e12508. [DOI] [PMC free article] [PubMed] [Google Scholar]
- 11. Wang L, Aireti A, Aihaiti A, Li K. Expression of microRNA-150 and its target gene IGF2BP1 in human osteosarcoma and their clinical implications. Pathol Oncol Res. 2019;25(2):527–533. [DOI] [PMC free article] [PubMed] [Google Scholar]
- 12. Gerstberger S, Hafner M, Tuschl T. A census of human RNA-binding proteins. Nat Rev Genet. 2014;15(12):829–845. [DOI] [PMC free article] [PubMed] [Google Scholar]
- 13. Montanaro L, Mazzini G, Barbieri S, et al. Different effects of ribosome biogenesis inhibition on cell proliferation in retinoblastoma protein- and p53-deficient and proficient human osteosarcoma cell lines. Cell Prolif. 2007;40(4):532–549. [DOI] [PMC free article] [PubMed] [Google Scholar]
- 14. Penzo M, Montanaro L, Treré D, Derenzini M. The ribosome biogenesis-cancer connection. Cells. 2019;8(1):55. [DOI] [PMC free article] [PubMed] [Google Scholar]
- 15. Catez F, Dalla Venezia N, Marcel V, Zorbas C, Lafontaine DL, Diaz JJ. Ribosome biogenesis: an emerging druggable pathway for cancer therapeutics. Biochem Pharmacol. 2019;159:74–81. [DOI] [PubMed] [Google Scholar]
- 16. Lindeboom R, Supek F, Lehner B. The rules and impact of nonsense-mediated mRNA decay in human cancers. Nat Genet. 2016;48(10):1112–1118. [DOI] [PMC free article] [PubMed] [Google Scholar]
- 17. Wu C, Beird H, Andrew Livingston J, et al. Immuno-genomic landscape of osteosarcoma. Nat Commun. 2020;11(1):1008. [DOI] [PMC free article] [PubMed] [Google Scholar]
- 18. Wang M, Zhang G, Wang Y, et al. DHX32 expression is an indicator of poor breast cancer prognosis. Oncol Lett. 2017;13(2):942–948. [DOI] [PMC free article] [PubMed] [Google Scholar]
- 19. Lin H, Liu W, Fang Z, et al. Overexpression of DHX32 contributes to the growth and metastasis of colorectal cancer. Sci Rep. 2015;5(1):9247. [DOI] [PMC free article] [PubMed] [Google Scholar]
- 20. Song J, Ma Z, Hua Y, et al. Functional role of RRS1 in breast cancer cell proliferation. J Cell Mol Med. 2018;22(12):6304–6313. [DOI] [PMC free article] [PubMed] [Google Scholar]
- 21. Wu X, Yang Z, He L, et al. RRS1 silencing suppresses colorectal cancer cell proliferation and tumorigenesis by inhibiting G2/M progression and angiogenesis. Oncotarget. 2017;8(47):82968–82980. [DOI] [PMC free article] [PubMed] [Google Scholar]
- 22. Kuang J, Li Q, Fan F, et al. Overexpression of the X-linked ribosomal protein S4 predicts poor prognosis in patients with intrahepatic cholangiocarcinoma. Oncol Lett. 2017;14(1):41–46. [DOI] [PMC free article] [PubMed] [Google Scholar]
- 23. Paquet É, Hovington H, Brisson H, et al. Low level of the X-linked ribosomal protein S4 in human urothelial carcinomas is associated with a poor prognosis. Biomark Med. 2015;9(3):187–197. [DOI] [PubMed] [Google Scholar]
- 24. Tsofack S, Meunier L, Sanchez L, et al. Low expression of the X-linked ribosomal protein S4 in human serous epithelial ovarian cancer is associated with a poor prognosis. BMC Cancer. 2013;13(1):303. [DOI] [PMC free article] [PubMed] [Google Scholar]
- 25. Calo E, Flynn R, Martin L, Spitale RC, Chang HY, Wysocka J. RNA helicase DDX21 coordinates transcription and ribosomal RNA processing. Nature. 2015;518(7538):249–253. [DOI] [PMC free article] [PubMed] [Google Scholar]
- 26. Zhang Y, Baysac K, Yee L, Saporita AJ, Weber JD. Elevated DDX21 regulates c-Jun activity and rRNA processing in human breast cancers. Breast Cancer Res. 2014;16(5):449. [DOI] [PMC free article] [PubMed] [Google Scholar]
- 27. Cao J, Wu N, Han Y, et al. DDX21 promotes gastric cancer proliferation by regulating cell cycle. Biochem Biophys Res Commun. 2018;505(4):1189–1194. [DOI] [PubMed] [Google Scholar]
- 28. Zhang H, Zhang Y, Chen C, et al. A double-negative feedback loop between DEAD-box protein DDX21 and snail regulates epithelial-mesenchymal transition and metastasis in breast cancer. Cancer Lett. 2018;437:67–78. [DOI] [PubMed] [Google Scholar]
- 29. Oliver D, Ji H, Liu P, et al. Identification of novel cancer therapeutic targets using a designed and pooled shRNA library screen. Sci Rep. 2017;7(1):43023. [DOI] [PMC free article] [PubMed] [Google Scholar]
- 30. Zhang H, Lin J, Chen J, et al. DDX11-AS1 contributes to osteosarcoma progression via stabilizing DDX11. Life Sci. 2020;254:117392. [DOI] [PubMed] [Google Scholar]
- 31. Ghanipour A, Jirström K, Pontén F, Glimelius B, Påhlman L, Birgisson H. The prognostic significance of tryptophanyl-tRNA synthetase in colorectal cancer. Cancer Epidemiol Biomarkers Prev. 2009;18(11):2949–2956. [DOI] [PubMed] [Google Scholar]
- 32. Thanindratarn P, Dean DC, Nelson SD, Hornicek FJ, Duan Z. Advances in immune checkpoint inhibitors for bone sarcoma therapy. J Bone Oncol. 2019;15:100221. [DOI] [PMC free article] [PubMed] [Google Scholar]
- 33. Xiao B, Liu L, Li A, et al. Identification and verification of immune-related gene prognostic signature based on ssGSEA for osteosarcoma. Front Oncol. 2020;10:607622. [DOI] [PMC free article] [PubMed] [Google Scholar]
- 34. Hong W, Yuan H, Gu Y, et al. Immune-related prognosis biomarkers associated with osteosarcoma microenvironment. Cancer Cell Int. 2020;20(1):83. [DOI] [PMC free article] [PubMed] [Google Scholar]


