Abstract
To improve the solubility and oral bioavailability of a novel antimalarial agent ELQ-331 (a prodrug of ELQ-300), spray-dried dispersions (SDD) and a self-emulsifying drug delivery system (SEDDS) were developed. Spray-dried dispersions were prepared with polyvinyl caprolactam-polyvinyl acetate-polyethylene glycol graft copolymer (Soluplus®) polymer carrier and Aeroperl® 300 Pharma and characterized by differential scanning calorimetry, powder x-ray diffraction. For SEDDS, solubility in oils, surfactants, and co-surfactants was determined and ternary phase diagram was constructed to show self-emulsifying area. SEDDS were characterized for spontaneous emulsification and droplet size distribution. The amorphous ELQ-331 SDD improved the solubility to 10X in fasted-state simulated intestinal fluid and addition of sodium lauryl sulphate externally to SDDs further improved the solubility to ~28.5X vs non-formulated drug. SEDDS had good self-emulsifying characteristics with small emulsion droplet sizes and narrow particle distribution. Oral pharmacokinetic studies for SDD and SEDDS formulations were performed in rats. The ELQ-331 rapidly converted to ELQ-300 soon after oral administration in rats. Exposure levels of ELQ-300 were about 1.4-fold higher (based on AUC) in SEDDS than SDD formulations. Poorly soluble drugs like ELQ-331 can be formulated using SDD or SEDDS to improve solubility and oral bioavailability.
Keywords: Antimalarial drugs, spray-dried dispersions (SDD), self-emulsifying drug delivery systems (SEDDS), oral bioavailability, amorphous form
1. Introduction:
Despite remarkable progress in preventive measures and improved treatments, malaria continues to be a major global health problem in tropical and subtropical regions. In 2017, malaria caused an estimated 435,000 deaths (World Health Organization, The World Malaria Report 2018). Artemisinin combination treatments are now the first-line drugs for uncomplicated falciparum malaria; however, due to the emergence of artemisinin resistance, novel antimalarial drugs are needed (White 2008; Dondorp et al. 2011; Fairhurst and Dondorp 2016).
There are preclinical stage Endochin-like quinolones (ELQs) molecules under development for the treatment of diseases caused by apicomplexan parasites, including toxoplasmosis, malaria, and babesiosis (Alday et al. 2017). Of the quinolone derivatives synthesized in the Riscoe Laboratory (Oregon Health & Sciences University, Portland, OR), ELQ-300 was found to be highly active against Plasmodium falciparum, the protozoan malaria parasite (Nilsen et al. 2013, 2014). The mechanism of action of ELQ-300 involves targeting the parasite’s mitochondrion, a subcellular organelle important in the manufacture of the DNA building blocks needed for parasite survival and replication. The effect of ELQ-300 is to starve the parasite of these essential DNA building blocks, thereby killing replicating parasites in the liver or bloodstream of the host, or inside the mosquito vector. The drug is so potent and effective that only very small doses are required for efficacy in humans. Due to its high crystallinity and potential for pi-pi stacking (Winter et al. 2011; Nilsen et al. 2013), a bioreversible alkoxycarbonate ester prodrug of ELQ-300 (hereby labeled as ELQ-331) was synthesized (Figure 1). The x-ray crystallography of ELQ derivatives exhibited an extensive network of intermolecular hydrogen bonds in the X-Y plane and pi-pi stacking in the Z plane. To reduce the crystal lattice energy and disrupting pi-pi interactions, a decision was made to place an aryl group at position 3 because the adjacent 2-position CH3 would force an out-of-plane movement of the bulky aromatic ring (Nilsen et al. 2014). Once administered orally, this bioreversible prodrug will be converted to ELQ-300 by host and parasite esterase action in the liver and bloodstream of the host (Frueh et al. 2017). Since the non-formulated prodrug ELQ-331 showed poor aqueous solubility in biorelevant buffers fasted-state simulated gastric fluid (FaSSGF), fasted-state simulated intestinal fluid (FaSSIF), and fed-state simulated intestinal fluid (FeSSIF), formulation strategies are necessary to improve its solubility and oral bioavailability.
Figure 1.

Structures and interconversions of ELQ-300 Base and ELQ-331 Prodrug.
Formulation strategies that improve solubility and oral bioavailability of poorly soluble drugs include (a) particle size reduction (Elamin et al. 1994; Jinno et al. 2006), (b) amorphous solid dispersions (Vasconcelos et al. 2007), (c) co-crystal formation (Aakeroy et al. 2009; Smith et al. 2011), (d) complexation (Kimura et al. 2000), (e) co-solvent (Yalkowsky and Rubino 1985), and (f) lipid-based systems (Porter et al. 2007).
We explored amorphous spray-dried dispersions (SDD) and self-emulsifying drug delivery systems (SEDDS) in an attempt to improve solubility and oral bioavailability of ELQ-331. Unlike other solubilization techniques, amorphous SDD has the ability to increase apparent solubility without impeding permeability, and therefore achieving and maintaining supersaturation without modifying the equilibrium solubility of the drug (Miller et al. 2012). In recent years, SEDDS became one of the common approaches to enhance oral bioavailability due to its advantages like, reduction in the dose, consistent time-based absorption profiles, and protection from GI hostile environment (Friesen et al. 2008).
According to Chiou and Riegelman (1971), a solid dispersion can be defined as a “dispersion of one or more active ingredients in an inert excipient or matrix, where the active ingredients could exist in finely crystalline, solubilized, or amorphous states”. The amorphous solid dispersions consist of drug molecules dispersed in amorphous polymeric carriers (Singh and Van den Mooter 2016; Van Duong and Van den Mooter 2016). The amorphous solid dispersions can be achieved by spray drying process. Spray drying is one of the solvent evaporation processes. In this process, mixture of drug and polymer solution is atomized into fine droplets and rapidly drying into particles by trapping the drug in the amorphous form (Leuner and Dressman 2000; Yamashita et al. 2003; Singh and Van den Mooter 2016; Van Duong and Van den Mooter 2016; Bhujbal et al. 2018). The polymer carriers play an important role in drug stabilization through various mechanisms including anti-plasticization, introduction of specific intermolecular interactions, alteration of chemical potential, and reduction in molecular mobility by inhibiting the nucleation process of the amorphous drug (Yamashita et al. 2003; Friesen et al. 2008; Surikutchi et al. 2013; Baghel et al. 2016). Generally, amorphous solids are more soluble than their crystalline counterparts, and this enhances oral absorption due to maintenance of a super-saturated drug concentration in gastro-intestinal fluids (Vasconcelos et al. 2007; Ozaki et al. 2012; Kawakami 2012). Solid dispersions reduce particle size, which results in larger surface area, and improves drug solubility (Leuner and Dressman 2000). Also, drug is released as the polymer carrier dissolves.
SDD technology can be applied to structurally diverse molecules with a wide range of physicochemical properties. For the SDDs reported in this study, a polymeric excipient, polyvinyl caprolactam-polyvinyl acetate-polyethylene glycol graft copolymer (also known as Soluplus®) was used as a carrier matrix. This copolymer is also known for its solubilizing action. Homayouni et al, and Ha et al, have shown that SDDs prepared using Soluplus® improved dissolution rate as well as increased plasma levels for the poorly soluble drugs Celecoxib (Homayouni et al. 2015) and Atorvastatin calcium (Ha E-S et al. 2014). Silicon dioxide (Aeroperl® 300 Pharma) is highly porous adsorbent with large surface area; and has silanol groups that may be able to form hydrogen bonds with drug molecules during spray drying process. This may help in faster drug dissolution and improved wettability of the drug particles (Chauhan et al. 2005).
SEDDS formulations are defined as isotropic mixtures of oils, surfactants, co-surfactants (or solvents/co-solvents), and a drug. The distinctive feature of the SEDDS is that, upon oral administration, these systems rapidly disperse in gastrointestinal fluids because the digestive motility of the stomach and the intestine aid in formation of micro or nano oil-in-water emulsions containing the solubilized drug. The drug remains in solution in the gut, avoiding the dissolution step that frequently limits the rate of absorption of hydrophobic drugs from the crystalline state. The smaller oil droplets of the micro emulsion formed in the gut provide a large interfacial area for pancreatic lipase to hydrolyze triglycerides and thereby cause rapid release of the drug, which may lead to enhanced absorption and bioavailability (Pouton 1997, 2000; Gursoy and Benita 2004; Kang et al. 2004; Patel and Vavia 2007). The surfactant used in the SEDDS formulation stimulates different mechanisms to improve bioavailability of poorly soluble drugs, such as increased intestinal epithelial permeability (Tarr and Yalkowsky 1989; Lundin et al. 1997; Pouton 2000), improved drug dissolution (Constantinides 1985; Swenson and Curatolo 1992), increased tight junction permeability (Lindmark et al. 1995; Prabhu et al. 2005), and diminished p-glycoprotein drug efflux (Nerurkar et al. 1996; Lo et al. 1998; Yu et al. 1999; Sha et al. 2005). According to Chen et al. (2009) self-micro emulsifying drug delivery system (SMEDDS) are more efficient than traditional spray dried technology in increasing solubility, dissolution, intestinal permeability, lymphatic absorption and bioavailability of the insoluble drugs.
Spray drying was achieved by dissolving the drug and polymer in organic solvent. The insoluble Aeroperl 300 pharma was dispersed and then spray dried. The resultant powder was characterized, and the dissolution properties were compared to the crystalline non-formulated drug substance. For SEDDS formulations, ELQ-331 solubility was evaluated in oils, surfactants and co-surfactants followed by selection of the suitable combination of premix to spontaneously form self-emulsifying micro emulsion system. The ELQ-331 SDD powder and SEDDS formulations were evaluated for oral bioavailability in rats.
2. Materials and Methods:
2.1. Materials:
ELQ-331 was synthesized at the Veterans Administration Medical Center/Oregon Health & Science University (VAMC/OHSU) in Portland, OR by published methods (6–8). Polyvinyl caprolactam-polyvinyl acetate-polyethylene glycol graft co-polymer, “Soluplus®”, was obtained from BASF (Florham Park, NJ) and acetone and dichloromethane solvents were purchased from Avantor Performance Materials (Center Valley, PA). Colloidal silicon dioxide, “Aeroperl® 300 Pharma,” was obtained from Evonik Industries (Parsippany, NJ), and hydrochloric acid from Ameresco (Solon, OH). Potassium phosphate, monobasic potassium phosphate, sodium hydroxide, sodium dihydrogen phosphate monohydrate, sodium chloride, glacial acetic acid, Tween-20, Span® 85, PEG 400 and sodium lauryl sulfate were obtained from Spectrum Chemicals (Gardena, CA). Milli-Q water was obtained in-house. The FaSSGF/FaSSIF/FeSSIF powder was obtained from Biorelevant.com Ltd (Surrey, UK). Labrafac lipophile WL1349, Labrasol, Labrafil M1944, Capryol 90 were obtained from Gattefosse USA (Paramus, NJ). Miglyol 812N was obtained from Sasol Germany GmbH (Hamburg, Germany), Capmul MCM NF was obtained from Abitec Corporation (Janesville, WI). Sprague Dawley rats (275–325 g) each with a single Jugular Vein Catheter (JVC) were obtained from Charles River (Wilmington, MA).
2.2. Preparation of ELQ-331 Spray-dried Amorphous Solid Dispersions:
The drug ELQ-331, polymer (Soluplus as carrier) and colloidal silicon dioxide (as an adsorbent) were mixed in acetone: dichloromethane (50:50 w/w) solvent mixture at a 1:4:2 and 1:2:1. The final dispersion was spray-dried using a Büchi Mini Spray Dryer B-290 (Büchi Labortechnik AG, Postfach, Switzerland), under the following conditions: pump speed, 10%; nitrogen flow rate, 473 l/h; aspirator level, 100%; inlet temperature, 80°C; and outlet air temperature, 52–54°C. The spray-dried dry powder was stored at ambient temperature in scintillation vials and kept in a desiccator until further use. To further improve the solubility of drug, ELQ-331, SDD powders at 14.3% w/w drug loading were blended externally with sodium lauryl sulphate (SLS). Two levels of SLS at concentrations below the FDA acceptable limits for oral administration were selected. The selected two levels 125 mg (11.11%) and 250 mg (20%) of SLS were blended with 1.0 g of ELQ-331-SDD powders separately. Final formulation compositions are presented in Table 1.
Table 1.
Composition of ELQ-331 SDD formulations blended with SLS.
| Components | Low concentration of SLS (%w/w) | High concentration of SLS (%w/w) | |
|---|---|---|---|
| SDD powder | ELQ-331 | 12.70 | 11.43 |
| Soluplus | 50.79 | 45.71 | |
| Aeroperl 300 Pharma | 25.40 | 22.86 | |
| Surfactant | Sodium lauryl sulfate | 11.11 | 20.00 |
| Total | 100.00 | 100.00 | |
SDD: Spray Dried Dispersion
2.3. Preparation of ELQ-331 Physical Mixture (PM):
The drug (ELQ-331), polymer, and colloidal silicon dioxide (1: 1: 1 w/w/w) were mixed gently using a mortar and pestle. The resultant mixture was transferred to scintillation vials and rotated for 15 minutes using a laboratory mixer (Glas-Col LLC, Terre Haute, IN) and then stored at ambient temperature in the same vials in a desiccator until further use.
2.4. High Performance Liquid Chromatography (HPLC) method for analysis of ELQ-331 and ELQ-300:
The chromatography equipment consisted of a High-Performance liquid chromatography (HPLC) system (HP Model 1100, Agilent, Santa Clara, CA) with a quaternary pump, an auto sampler, HP ChemStation Software, (Version A. 06.03) and a diode array detector. ELQ-331 and ELQ-300 were detected at 254 nm wavelength. Separation was carried out using a reverse-phase C8 column (Luna C8 (2), 150 × 4.6 mm, 5 μ, Phenomenex, Torrance, CA). The mobile phase was methanol with 0.05% formic acid and Milli-Q water with 0.05% formic acid at a flow rate of 1.0 ml/min in a gradient method and at a column oven temperature of 35°C. The method was used to determine the solubility of ELQ-331, ELQ-300 in various aqueous, non-aqueous (oils, surfactants and co-surfactants) and biorelevant solutions.
2.5. Determination of ELQ-331 Content:
The ELQ-331 content within SDD was quantified by the above HPLC method. Drug content is the amount of ELQ-331 entraped/present in the SDD powders and loading efficiency within SDD is the percent of the ratio of drug content quantified by HPLC to the theoretical amount added.
Loading efficiency (LE %) of ELQ-331 within the SDD was defined as: LE % = [(wt % ELQ-331 drug content entraped/present in the SDD powders) ÷ (theoretical wt % ELQ-331)] × 100%.
Analytical samples were prepared by dissolving approximately 2 mg of ELQ-331 SDD powder in acetonitrile and sonicating the solution for a minute, if required. Samples were analyzed by HPLC.
2.6. Characterization of Spray-dried Dispersions (SDD):
2.6.1. Aqueous Solubility:
A known excess quantity of ELQ-331 SDD powder was added to the freshly prepared buffers (FaSSGF buffer at pH 1.6, phosphate buffer at pH-5.8, FaSSIF at pH-6.5, FeSSIF at pH-5.0, or water), and the mixtures were sonicated for a minute and then stirred continuously using an AROS 160, an orbital shaker (Thermolyne, Dubuque, IA) at 200 rpm at 37°C for 4 hours. Each sample was centrifuged twice at 10,000 rpm for 15 minutes, and supernatant was filtered using a 0.45-μm polytetrafluoroethylene (PTFE) filter (Pall Life Sciences, Ann Arbor, MI) and assayed by HPLC. A similar procedure was followed for solubility determination of the ELQ-331 SDD powder blend containing the SLS and ELQ-331 physical mixture (PM) in buffers.
2.6.2. Differential Scanning Calorimetry (DSC):
Thermograms for the ELQ-331and its SDD powders were obtained using a DSC instrument (Model Q200 DSC, TA Instruments, New Castle, DE). The instrument was equilibrated at 4.0°C and maintained isothermal for 3.0 minutes. The samples were heated at the rate of 10°C/min to 300.0°C. An inert atmosphere was maintained by purging argon gas at flow rate of 50 mL/ min. Three to five milligrams of each sample were weighed and hermetically sealed in pin-holed aluminium crucibles. The instrument was calibrated for temperature and heat flow using indium and zinc standards, respectively.
2.6.3. Thermogravimetric Analysis (TGA):
For TGA analysis, 25 to 30 mg of ELQ-331 and its SDD powder samples were heated in a platinum sample pan from about 5°C to 350°C at 10°C/min under argon gas with flow rate of 100 mL/min. After loading the TGA sample into the instrument (Model Q500 TGA, TA Instruments, New Castle, DE) and allowing for initial instrument stabilization, an additional 30 seconds was allowed for weight stabilization before starting the heating ramp.
2.6.4. Powder X-Ray Powder Diffraction (PXRD):
The PXRD patterns for ELQ-331 and its SDD powders were recorded on a Miniflex, a benchtop XRD instrument (Rigaku Americas Corporation, The Woodlands, TX) using Cu anode with Cu Kα radiation at wavelength of 1.5406 Å, 30 kV of voltage and 10 mA of current. The data were collected in the continuous scan mode at a scan speed of 10.0 degree/min using a step size of 0.02° (2θ). The scanned range was 5–80°(2θ).
2.6.5. Scanning Electron Microscopy (SEM):
The ELQ-331 and the SDD powder samples were mounted on a double-faced adhesive tape and sputtered with a thin gold layer for 35 seconds at 0.15 mA current using a 108 Auto Sputter Coater (Cressington Scientific Instruments, Watford, UK) unit, and the surface topography was analyzed with a field-emission scanning electron microscope JSM-6700F (Jeol USA, Peabody, MA) operated at an acceleration voltage of 3 kV.
2.6.6. Fourier Transform Infrared Spectroscopy (FTIR):
We used a Fourier transform infrared spectrophotometer (Nicolet™, iS™ 5 FTIR spectrometer, Thermo Scientific), and spectra were obtained by scanning over the wave number range of 4000 – 400 cm-1 using OMNIC™ software (Thermo Scientific, Waltham, MA).
2.6.7. Dissolution Studies:
We performed dissolution studies for ELQ-331 drug alone and the SDD samples using a Vankel VK7000 dissolution apparatus (Santa Clara, CA) equipped with a USP apparatus 2 (paddle) at 100 rpm in 500 ml of FaSSGF buffer medium at 37 ± 0.5°C. Each powder was accurately weighed and filled into a hard gelatin capsule. Each filled capsule was placed into a spiral PTFE-coated sinker and dropped into the dissolution vessel. At 15, 30, 45, and 60 minutes, 2.0-ml samples were withdrawn from each vessel and replaced with fresh buffer. Each sample was filtered through a 0.45-μm PTFE filter, and filtrate was injected onto HPLC system for quantification of the ELQ-331.
2.7. Stability of Spray-dried Dispersions (SDD):
The stability of the ELQ-331 amorphous SDD was monitored for up to 12 weeks at temperature and relative humidity (25°C/60% RH and 40°C/75% RH) under open (without lids) and closed (capped with screw-cap lids) conditions. Samples were analyzed at t=0, 1, and 3 months for assay (HPLC), any chemical changes (FTIR), and the presence/absence of crystallinity (DSC and PXRD studies).
2.8. Solubility of ELQ-331 in Oils, Surfactants, Co-surfactants
Solubility studies were performed to identify suitable oils, surfactants, and co-surfactants that possessed good solubilizing capacity for ELQ-331. The solubility of ELQ-331 in the SEDDS formulations components was evaluated by weighing approximately 10 mg in 2 ml of each vehicle, vortex-mixing, and then stirring the mixture using the orbital shaker at 200 rpm speed at room temperature for 24 hours. Each sample was observed for complete solubility of ELQ-331 after 24 hours at room temperature (23°C). For completely soluble samples, additional increments of 10–50 mg of ELQ-331 were added until saturation; stirring then continued for another 24 hours. All saturated samples were centrifuged at 10,000 rpm for 7 minutes, and supernatant was diluted with the mobile phase and injected onto the HPLC for an ELQ-331 assay.
2.9. Construction of Pseudo-ternary Phase Diagrams
The amount of oil and surfactant, and the mixing ratio of oil to surfactant /co-surfactant (Smix), play an important role in the formation of the micro emulsion. Pseudo-ternary phase diagrams were constructed to identify the self-emulsifying regions and to optimize the concentration of oil, surfactant, and co-surfactant. The selection of oil, surfactant, and co-surfactant was based on the solubility of ELQ-331.
The pseudo-ternary phase diagrams of oil, surfactant /co-surfactant (Smix), and water were developed using the water titration method. The mixtures of oil and Smix at certain weight ratios were diluted with distilled water in a drop-wise manner so that the Smix mixture was prepared using 1:1 ratio of the different surfactant and co-surfactant. For each phase diagram, a transparent and homogenous mixture of oil and Smix was formed by vortex mixing for 5 minutes. Then each mixture was titrated with water and visually observed for phase clarity. The amount of water at which transparency-to-turbidity transitions occurred was derived from the weight measurements. These values were then used to determine the boundaries of the micro-emulsion area corresponding to the values of oil and Smix. Phase diagrams were constructed using ProSim ternary diagram online software (Pro Sim Inc, Philadelphia, PA).
2.10. Preparation and Characterization of ELQ-331 SEDDS Formulations
The ELQ-331 SEDDS formulations were selected from the micro-emulsion region of the pseudo-ternary phase diagrams with the maximum possible proportion of the component (oil or Smix) and the highest solubility of drug to accommodate high drug loading. To prepare the ELQ-331 SEDDS formulation, the drug was dissolved in oil, surfactant, and co-surfactant in glass vials, and the mixture was gently mixed and stirred.
2.10.1. Assay of ELQ-331 in SEDDS Formulations
To identify the maximum solubility of the ELQ-331 in selected SEDDS formulations, an excess amount of drug was added, and the formulation was shaken on an orbital shaker at room temperature (23°C) for up to 24 hours. Samples were centrifuged, and supernatant was collected and quantified by the HPLC method. Analytical samples were prepared by transferring 25 microliters of the SEDDS formulation into a 25-mL volumetric flask; the solution was made up to the mark with acetone and sonicated for 5 minutes followed by 2 minutes of mixing. The resultant clear samples were injected into the HPLC system after dilution with acetone.
2.10.2. Dilution Study
We assessed the self-emulsification and precipitation of the SEDDS formulation by diluting it 1:100 with water, and the contents were mixed gently by hand shaking in a scintillation vial. The diluted formulation was observed for a tendency to emulsify spontaneously, for clarity, apparent stability (phase separation) of the resultant emulsion, and for precipitation at room temperature.
2.10.3. Droplet Size Measurement and Distribution
To measure the droplet size, the ELQ-331 SEDDS formulation was diluted with water at 1:100 ratio in a scintillation vial, and the resultant micro-emulsion droplet size was measured within 1 hour using a dynamic light scattering nanoparticle size analyzer (Horiba LB-550, Sunnyvale, CA). Droplet size measurement was performed in glass cuvette using standard distribution method at 20 °C (actual range 20.4–20.6 °C), water was used as dispersant and viscosity of the solution was entered as 0.9968 mPa.s.
2.11. Oral Pharmacokinetic (PK) Study in Rats:
Three male Sprague Dawley rats each with a single Jugular Vein Catheter (JVC) were fasted overnight prior to dose administration of the SDD suspension, SEDDS solution, or a simple carboxy methylcellulose (CMC) based suspension of the drug (control). Animals were also fasted for 4 hours post-dose. Dosing volume of 10 mL/kg for SDD suspension and 1.0 mL/kg for SEDDS solution were administered orally to rats. Dose administration (12.14 mg of ELQ-331 equivalent to 10 mg of ELQ-300) was followed immediately by oral gavage with 1 mL of water. Blood samples of ~300 microliters were collected from the JVC port at 2, 4, 8, 12, 24, 48, 60, 72, and 96 hours post dose into a tube containing K3EDTA; these were processed for plasma and stored frozen at ≤‒80°C. Sodium fluoride (NaF) was promptly added to the blood samples by transferring 300 microliters of whole blood from the K3EDTA tube into an Eppendorf tube containing 34 microliters of 500 mM NaF. The mixtures were kept on wet ice until they were processed to plasma. The NaF was used to prevent further breakdown of the prodrug ELQ-331 during blood sample processing and storage. Drug levels of the base drug ELQ-300 and the prodrug ELQ-331 were determined in collected plasma samples using an LC-MS/MS method. The plasma drug level data was analyzed using Phoenix® WinNonlin® (version 6.3) software to compute pharmacokinetic parameters by noncompartmental modeling. General procedures for animal care and housing were in accordance with the current Association for Assessment and Accreditation of Laboratory Animal Care (AAALAC) recommendations, current requirements stated in the Guide for the Care and Use of Laboratory Animals (National Research Council), and the current requirements as stated by the U.S. Department of Agriculture in the Animal Welfare Act and Animal Welfare Regulations (November 2013).
2.12. Bioanalytical Method for PK Study in Rats:
The method for analysis and quantification of ELQ-331 or ELQ-300 in rat plasma (sample volume 20 microliters) entailed the addition of 100 microliters of an internal standard solution (100 ng/ml BNS-22 in acetonitrile) to the standards, quality controls, and study samples. For blanks, 100 microliters of acetonitrile solution was added to the blank rat plasma. These mixtures were then vortexed for 10 minutes on a multi-tube vortex mixer at maximal speed, and suspensions were then clarified by centrifugation (18000 g, 10 min). Thirty microliters of the resulting supernatants was added to 0.200 mL of acetonitrile, and these mixtures were transferred to HPLC vials for LC-MS/MS analysis. Reverse-phase chromatographic analysis of ELQ-331 and ELQ-300 was performed on Shimadzu LC-20AD pumps integrated with Shimadzu CBM-20A System Controller (Shimadzu Corporation, Japan). Separation of ELQ-331, ELQ-300, and the internal standard (IS) was performed on the Phenomenex Luna (C18(2) 50 × 2.0 mm, 3 μm) analytical column (Phenomenex, Torrance, CA) maintained at 40°C. Ten microliters of each sample were loaded onto the column, separated, and eluted using a gradient mobile phase consisting of 0.1% formic acid in water (A) and 0.1% formic acid in acetonitrile (B). For gradient elution, the flow rate of the mobile phase was kept at 0.4 mL/min. Flow was directed to the ion spray interface. Mobile phase gradient used for separation of ELQ-331 and ELQ-300 is presented in Table 2.
Table 2.
Mobile phase gradient for LCMS method
| Time (min) | 0.1% formic acid in water (%A) | 0.1% formic acid in acetonitrile (%B) |
|---|---|---|
| 0.01 | 30 | 70 |
| 2.50 | 30 | 70 |
| 2.50 | 2 | 98 |
| 3.50 | 2 | 98 |
| 3.51 | 30 | 70 |
| 5.00 | 30 | 70 |
The autosampler (CTC-PAL, Leap Technologies, Morrisville, NC) temperature was maintained at 20°C. Mass spectrometric detection of ELQ-331, ELQ-300, and the Internal Standard was carried out on a API Sciex 4000 mass spectrometer (AB Sciex), equipped with turbospray and operated in a positive ionization mode. The multiple reaction monitoring (MRM) mode was used for data acquisition. Peak integration and calibration were carried out using Analyst Software version 1.6.2 (AB Sciex).
3. Results
3.1. Spray-dried Dispersions
3.1.1. Process Yield and Assay of SDDs:
The yield percentages of SDD powders and their ELQ-331 content from HPLC analysis for both formulations are presented in Table 3. The spray-drying process of ELQ-331 with polymer at two drug loadings gave consistent yields ranging from 63.00% to 76.62% w/w. The drug content by HPLC correlated well with the theoretical amounts, resulting in a loading efficiency of near 100%.
Table 3.
Yield and drug content in ELQ-331 SDD formulations.
| Formulation # | ELQ-331 loading (%) | Yield (% w/w) | ELQ-331 HPLC assay (wt %) | Loading Efficiency (LE) (%)* |
|---|---|---|---|---|
| 1 | 14.30 | 76.62 | 14.30 | 100.3 ± 0.65 |
| 2 | 25.0 | 63.00 | 25.75 | 103.0 ± 3.17 |
(Mean ± SD; n=3)
3.1.2. In-vitro Solubility in biorelevant Buffers:
The aqueous solubilities of prodrug in the various biorelevant buffers are presented in Table 4. Biorelevant buffers used are FaSSGF at pH 1.6, FeSSIF at pH 5.0, FaSSIF at pH 6.5, phosphate buffer (KH2PO4) at pH 5.8, and water at pH 5.7. The solubility studies were performed for (i) drug only, (ii) physical mixture (drug: polymer: silica; 1:1:1 w/w/w), (iii) the SDD with 14.3% w/w drug loading, and (iv) the SDD with 25% w/w drug loading. The solubilities of the SDDs containing 14.3% w/w and 25% w/w of ELQ-331 showed maximas at 455.0 ± 0.02 μg/mL and 167.97 ± 0.06 μg/mL, respectively, in FaSSGF (pH~1.6) buffer. The solubilities of the SDDs containing 14.3% w/w and 25% w/w of ELQ-331 were much lower in the other tested buffers, i.e., in FaSSIF, FeSSIF, and phosphate buffer and water. The 25% w/w drug-loaded SDD consistently showed lower solubility in all buffers than the 14% w/w drug-loaded SDD. Table 4 also shows the amounts of ELQ 300 (converted base) in all samples. The conversion of ELQ-300 from ELQ-331 SDD samples during solubility studies was insignificant in all the buffers studied.
Table 4.
Aqueous solubility of ELQ-331 SDD formulations.
| Buffers | ELQ-331 alone | Physical mixture (1:1:1 w/w/w)a | 14.3%w/w of ELQ-331 loaded SDD (1:4:2)b | 25%w/w of ELQ-331 loaded SDD (1:2:1)c |
|---|---|---|---|---|
| ELQ-331 (μg/ml)1 (Mean ± SD, n=3) | ||||
| FaSSGF (pH-1.6) | 00.00 ± 0.00 | 1.59 ± 0.46 | 455.00 ± 0.02 | 167.97 ± 0.06 |
| FeSSIF (pH-5.0) | 28.83 ± 0.02 | 24.00 ± 0.02 | 55.86 ± 0.004 | 71.07 ± 0.03 |
| FaSSIF (pH-6.5) | 7.39 ± 0.11 | 2.20 ± 0.04 | 74.09 ± 0.00 | 11.52 ± 0.11 |
| KH2PO4 (pH-5.8) | 00.00 ± 0.00 | 1.47 ± 0.05 | 108.55 ± 0.002 | 40.44 ± 0.03 |
| Water (pH-5.7) | 00.00 ± 0.00 | 1.78 ± 0.15 | 111.79 ± 0.003 | 59.23 ± 0.04 |
| ELQ-300 (μg/ml)2 | ||||
| FaSSGF (pH-1.6) | 00.00 ± 0.00 | 0.02 ± 0.02 | 5.16 ± 0.46 | 1.29 ± 0.06 |
| FeSSIF (pH-5.0) | 0.48 ± 0.02 | 0.17 ± 0.004 | 2.56 ± 0.02 | 3.14 ± 0.03 |
| FaSSIF (pH-6.5) | 0.29 ± 0.11 | 0.04 ± 0.00 | 1.79 ± 0.04 | 1.21 ± 0.11 |
| KH2PO4 (pH-5.8) | 00.00 ± 0.00 | 0.02 ± 0.002 | 1.18 ± 0.05 | 0.73 ± 0.03 |
| Water (pH-5.7) | 00.00 ± 0.00 | 0.03 ± 0.003 | 1.66 ± 0.15 | 1.45 ± 0.04 |
Prodrug concentration measured in the solubility samples
Converted base concentration in the solubility samples
(1 part drug:1 part polymer:1 part carrier);
(1 part drug:4 parts Polymer :2 part carrier);
(1 part drug: 2 parts polymer: 1 part carrier)
Sodium lauryl sulfate (SLS) is a known solubilizer and is used to improve the release of drug from solid dispersions under optimum pH conditions (Dave et al. 2013). The spray-dried dispersions of ELQ-331 at 14.3% w/w drug loading were blended in the presence of SLS at low and high concentrations. Solubility results in biorelevant buffers for the ELQ-331 SDD powder blend containing SLS at 11.11% and 20.0% at 14.3% drug loading are presented in Table 5. These results show addition of the surfactant SLS increased the solubility of ELQ-331 SDDs at pH~5.0 buffers, as evidenced by the amounts solubilized in FeSSGF, FaSSIF, and phosphate buffer. The addition of SLS caused a considerable decrease of SDD solubility in the FaSSGF buffer (pH 1.6) at 37°C vs. the solubility of ELQ-331 SDDs without surfactant. The low levels of ELQ-331 detected in the FaSSGF buffer could be due to ionization of ELQ-331 in SLS that led to formation of an insoluble estolate salt and effectively caused desolubilization or precipitation (Jain et al. 2004). The formed estolate salt can, however, be solubilized with a higher concentration of SLS in the formulation. When we increased the concentration of SLS to 20% w/w, the solubility of the ELQ-331 SDDs increased as well.
Table 5.
Aqueous solubility of ELQ-331 SDD formulations + SLS.
| Buffers | 12.70%w/w ELQ-331 SDD with 11.11% w/w SLS (1:4:2:0.875)a | 11.43%w/w ELQ-331 SDD with 20%w/w SLS (1:4:2:1.75)b |
|---|---|---|
| ELQ-331 (μg/ml)1 (Mean ± SD, n=3) | ||
| FaSSGF (pH-1.6) | 16.94 ± 4.77 | 225.37 ± 79.46 |
| FeSSIF (pH-5.0) | 64.43 ± 0.83 | 109.49 ± 3.16 |
| FaSSIF (pH-6.5) | 108.72 ± 5.74 | 210.55 ± 1.18 |
| KH2PO4 (pH-5.8) | 128.8 ± 3.95 | 120.0 ± 4.43 |
| Water (pH-5.7) | ND | 112.6 ± 13.6 |
| ELQ-300 (μg/ml)2 | ||
| FaSSGF (pH-1.6) | 0.60 ± 0.05 | 2.30 ± 0.49 |
| FeSSIF (pH-5.0) | 3.70 ± 0.09 | 6.30 ± 0.31 |
| FaSSIF (pH-6.5) | 7.40 ± 0.21 | 8.10 ± 0.14 |
| KH2PO4 (pH-5.8) | 2.63 ± 0.25 | 2.35 ± 0.25 |
| Water (pH-5.7) | ND | 3.57 ± 0.59 |
Prodrug concentration measured in the solubility samples
Converted base concentration in the solubility samples
(1 part drug:4 parts polymer:2 part carrier: 0.875 parts SLS:);
(1 part drug:4 parts polymer:2 parts carrier Aeroperl: 1.75 parts SLS); ND: Not Done
3.1.3. FTIR:
The FTIR spectra for ELQ-331 and SDDs are presented in Figure 2 (A–D). The spectral bands of the SDD of ELQ-331 and non-formulated ELQ-331 drug are similar in the fingerprint region (1500–500 cm−1). The C=O stretching of ester moiety of drug at 1754 cm−1 down shifted to 1732 cm−1 in both 14% and 25% drug loaded SDDs. The C=C stretching of aromatic moiety in ELQ-331 at 1608 cm−1 shifted to 1634 cm−1 for both SDD formulations. The FTIR spectra of the SDD confirmed the presence of molecular interaction between carbonyl or nitrogen groups of drug and hydroxyl groups of Soluplus® polymer formed during spray drying process.
Figure 2.
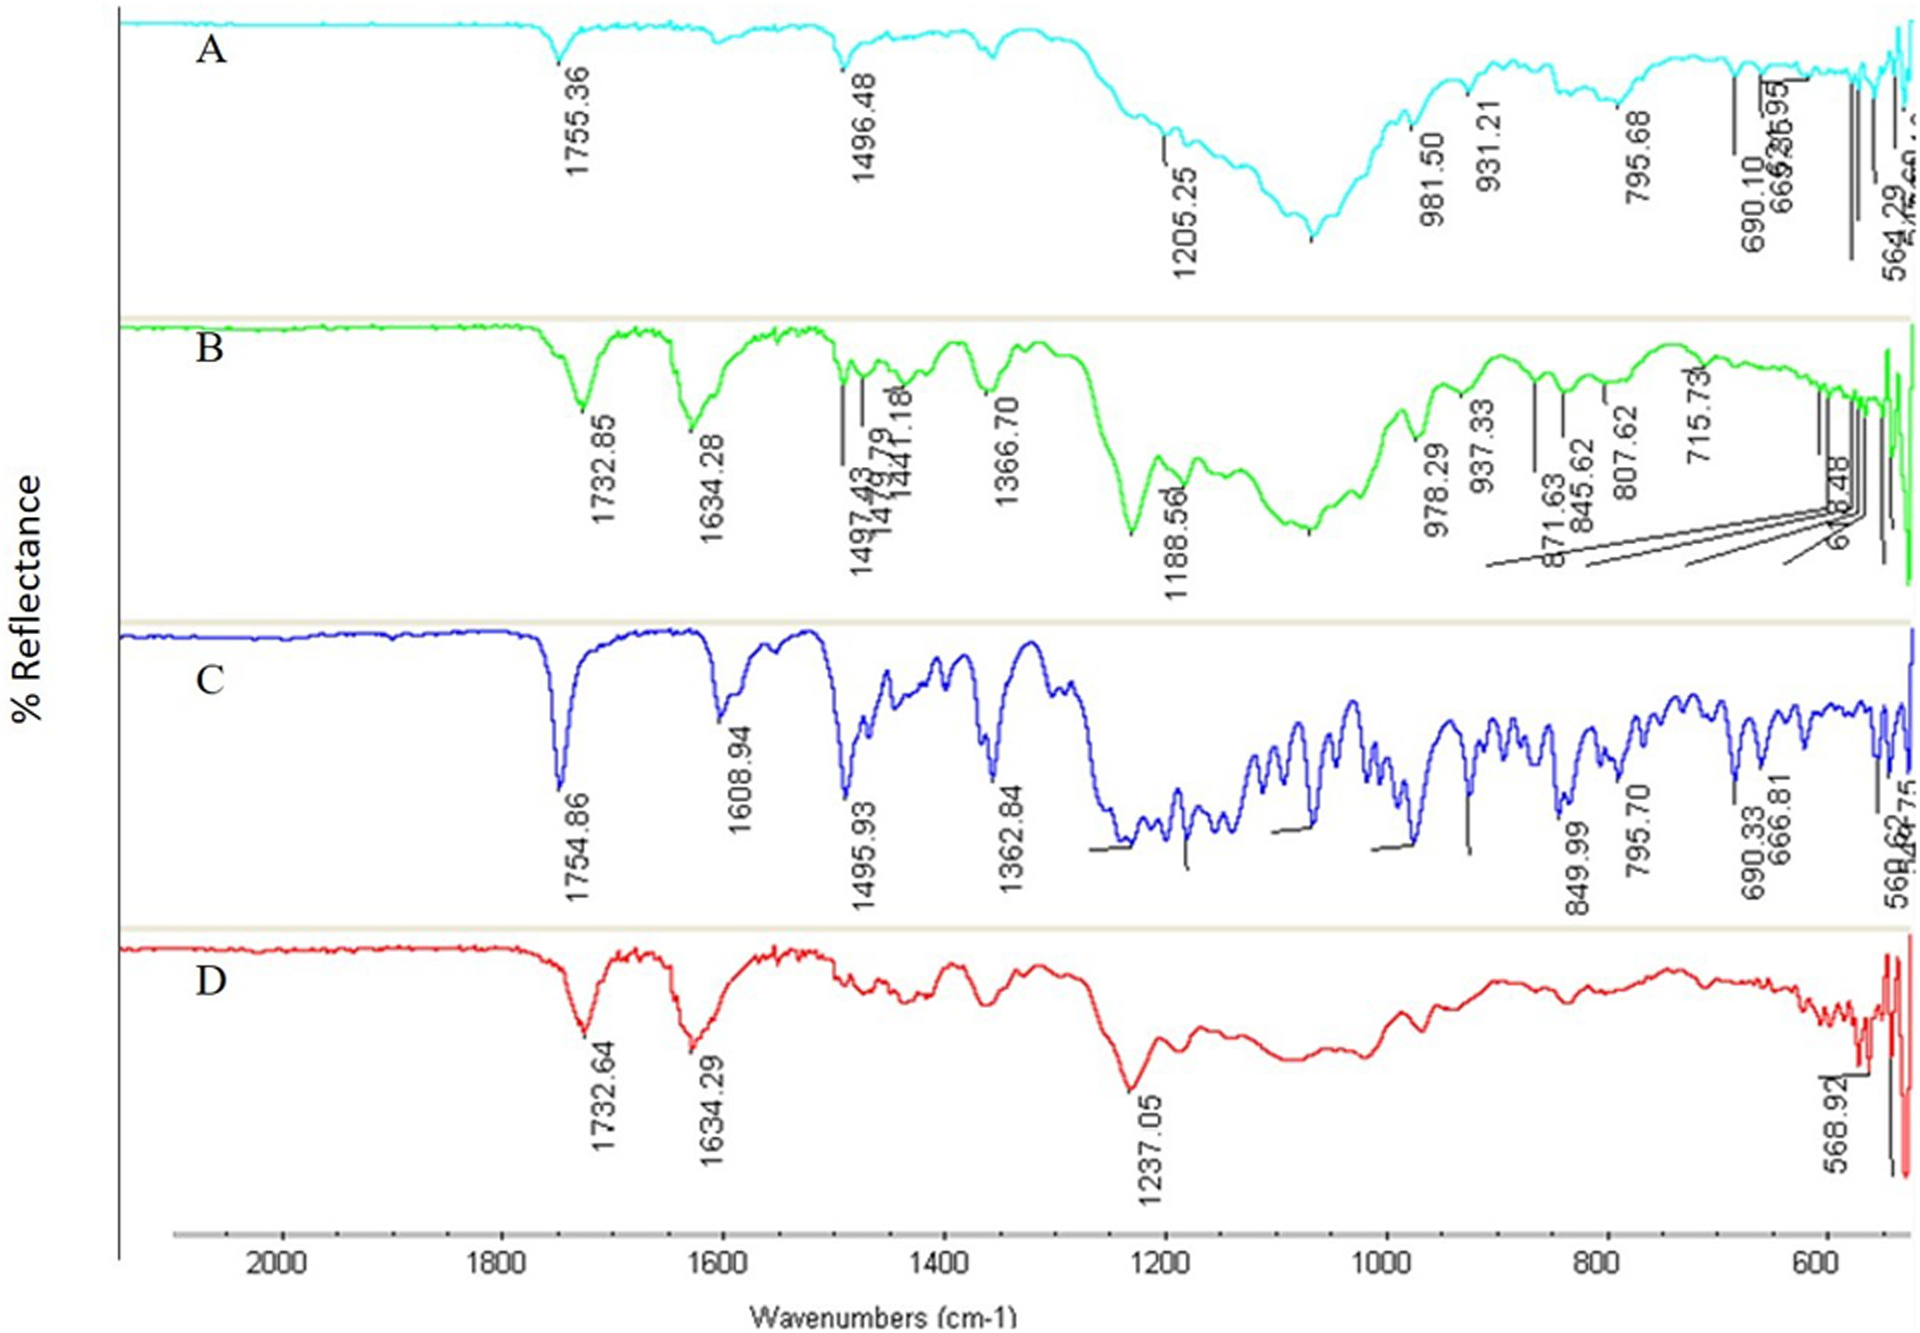
FTIR for ELQ-331 SDD. A) physical mixture, B) 25% of ELQ-331 loaded SDD, C) pure ELQ-331, and D) 14% of ELQ-331-loaded SDD.
3.1.4. Thermal Studies:
The DSC endotherm results for the SDDs of ELQ-331 are presented in Figure 3 (A–D). The sharp melting endotherm in Figure 3(A) at 108°C represents the pure crystalline nature of ELQ-331. The endotherms in Figure 3(B) & (C) for SDDs at 14.3% w/w and 25% w/w drug loading show complete disappearance of the melting endotherm at 108°C. This disappearance of the melting endotherm confirms the presence of the amorphous drug in both SDD formulation lots. The absence of interaction of components used in the SDD preparation was confirmed by the endotherm in Figure 3D for the physical mixture (PM) samples.
Figure 3.
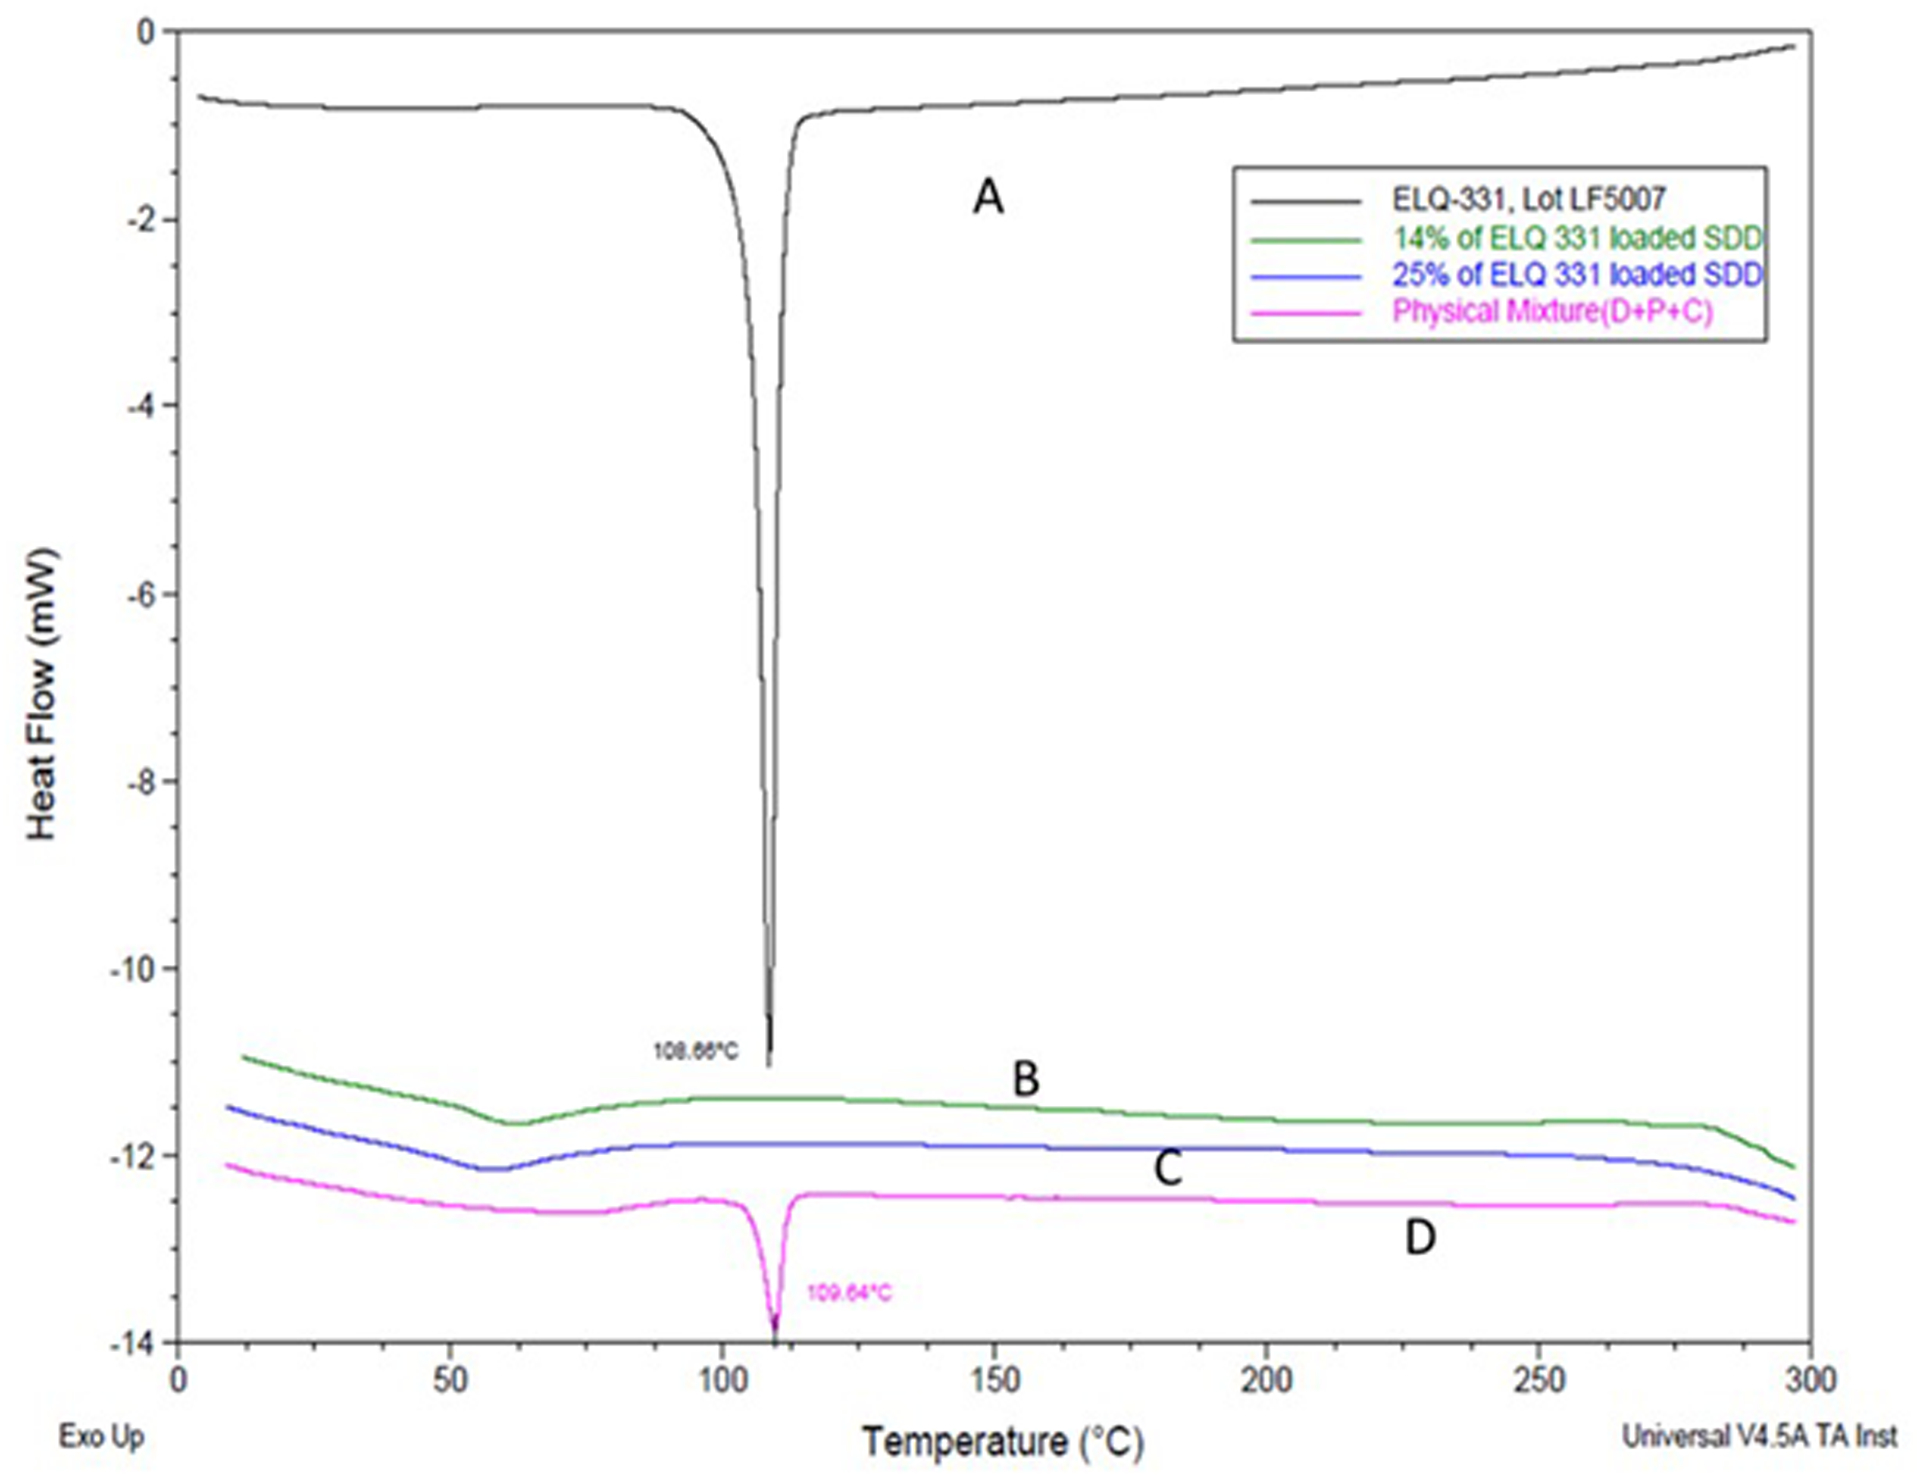
DSC of ELQ-331 SDD. A) ELQ-331, B) 14.3% of ELQ-331 loaded SDD, C) 25% of ELQ-331-loaded SDD, and D) physical mixture.
The results of the TGA thermograms for ELQ-331 and its SDDs along with the PM samples are presented in Figure 4 (A–D). The percent weight loss for the SDDs prepared at 14.3% w/w and 25% w/w drug loading of ELQ-331 in Figure 4(B) and (D) are 0.48% and 0.31% respectively. However, for the PM samples, there was a two-step weight loss of 0.91% before 100°C and at 110°C. This might be due to the presence of moisture in the polymer. This subtle change in percent weight loss for the SDDs was not significant as compared to the non-formulated drug ELQ-331; the latter resulted in 0.62% weight loss.
Figure 4.
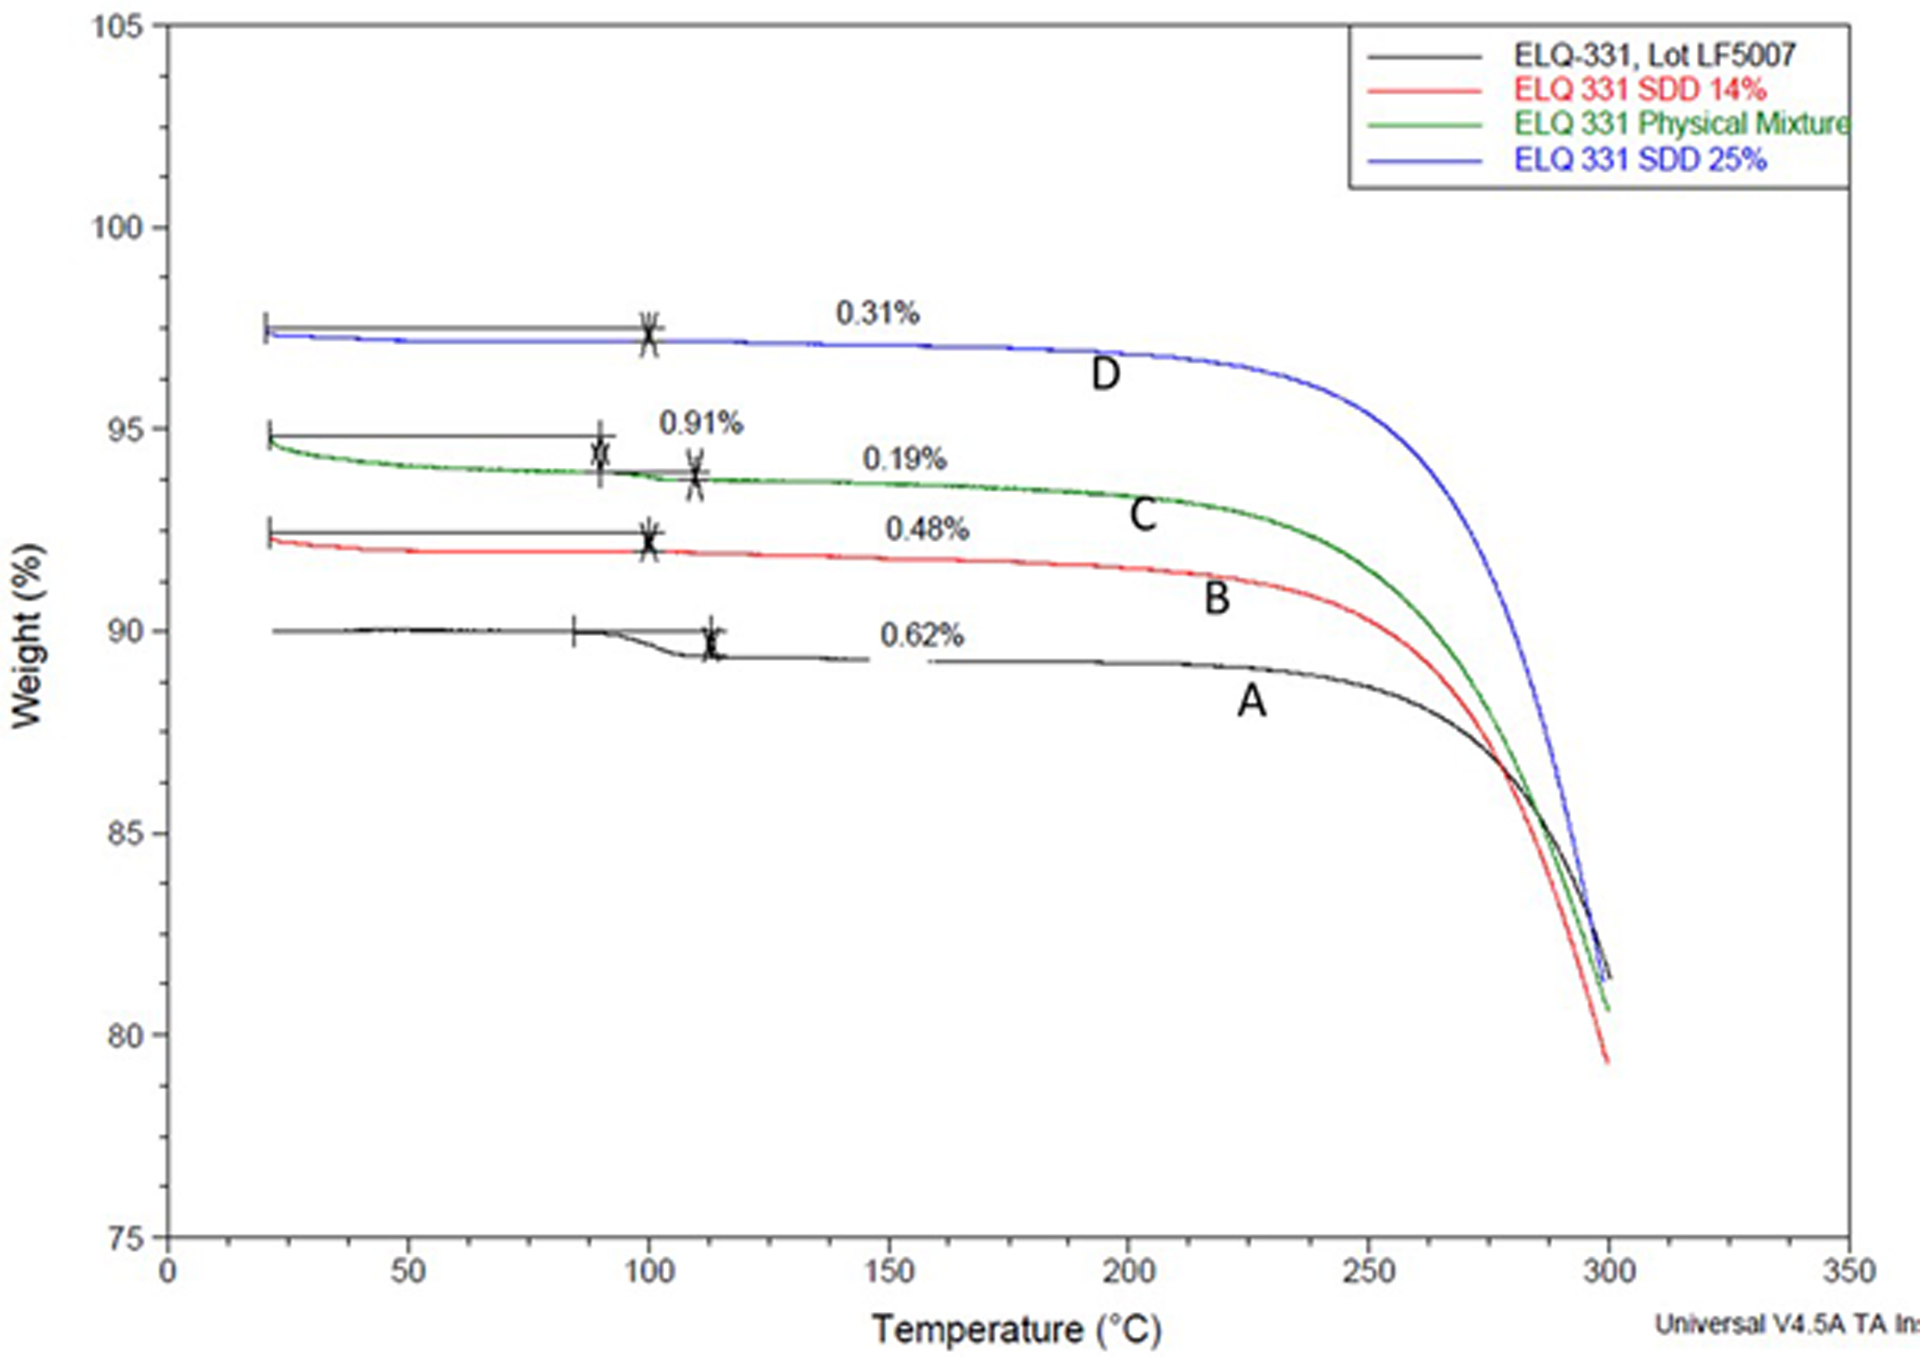
TGA curves for ELQ-331 SDD. A) ELQ-331, B) 14% of ELQ-331 SDD, C) physical mixture, and D) 25% of ELQ-331-SDD.
3.1.5. Scanning Electron Microscopy (SEM):
The SEM photographs for ELQ-331 and SDD are presented in Figure 5 (A–D). Photographs of ELQ-331 in Figure 5(A) show large elongated crystal-like structures at 100X zoom. The SEM images of the SDDs of ELQ-331 in Figure 5(C) & (D) show very fine agglomerated spherical microparticles at 5000X magnification for both 14.3% w/w and 25% w/w drug loadings. These two SEM images of SDDs show a complete absence of the crystal-like structures that were visible in Figure 5(A) of ELQ-331 drug alone.
Figure 5.
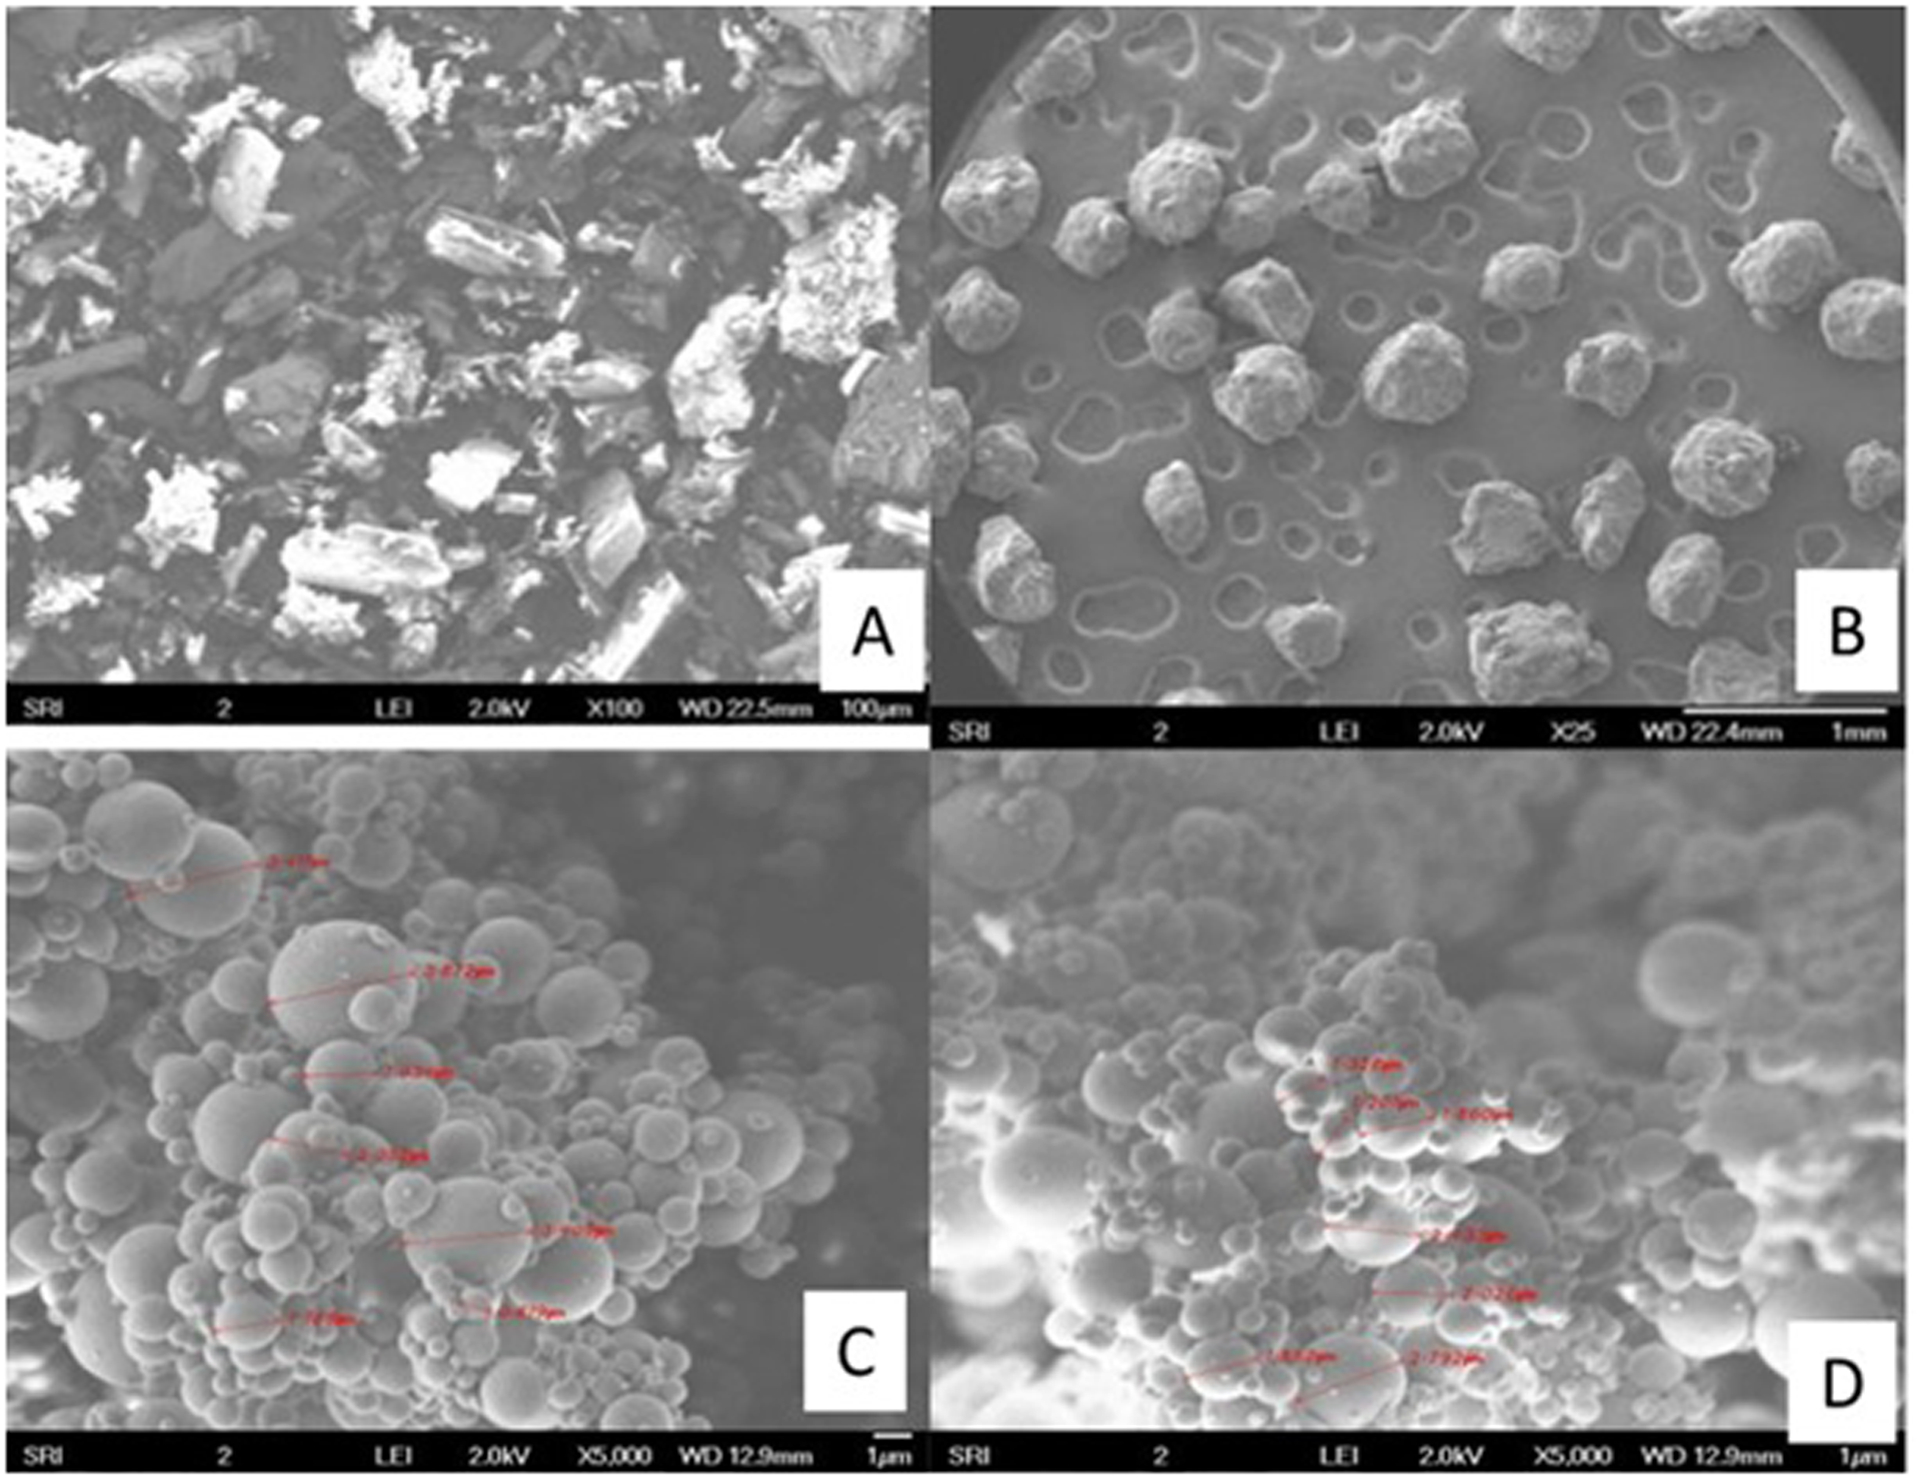
SEM pictures of ELQ-331 SDD formulations. A) ELQ-331, B) Soluplus, C) 14% of ELQ-331 loaded SDD, and D) 25% of ELQ-331-loaded SDD.
3.1.6. Powder X-ray Diffraction (PXRD):
Powder X-ray diffraction patterns for the ELQ-331 drug alone, its SDDs prepared at 14.3% and 25% drug loadings by the spray-drying process, and the PM are presented in Figure 6 (A–D). The similar sharp, narrow, intense peaks in Figure 6(A) and (B) represent the crystalline nature of the ELQ-331 drug alone and the PM, respectively. However, in Figure 6(C) and (D), the PXRD of the ELQ-331 SDD powder did not show any peaks but was rather broad with a noise-like, halo XRD pattern. This indicates the transformation of crystalline ELQ-331 to the amorphous form.
Figure 6.
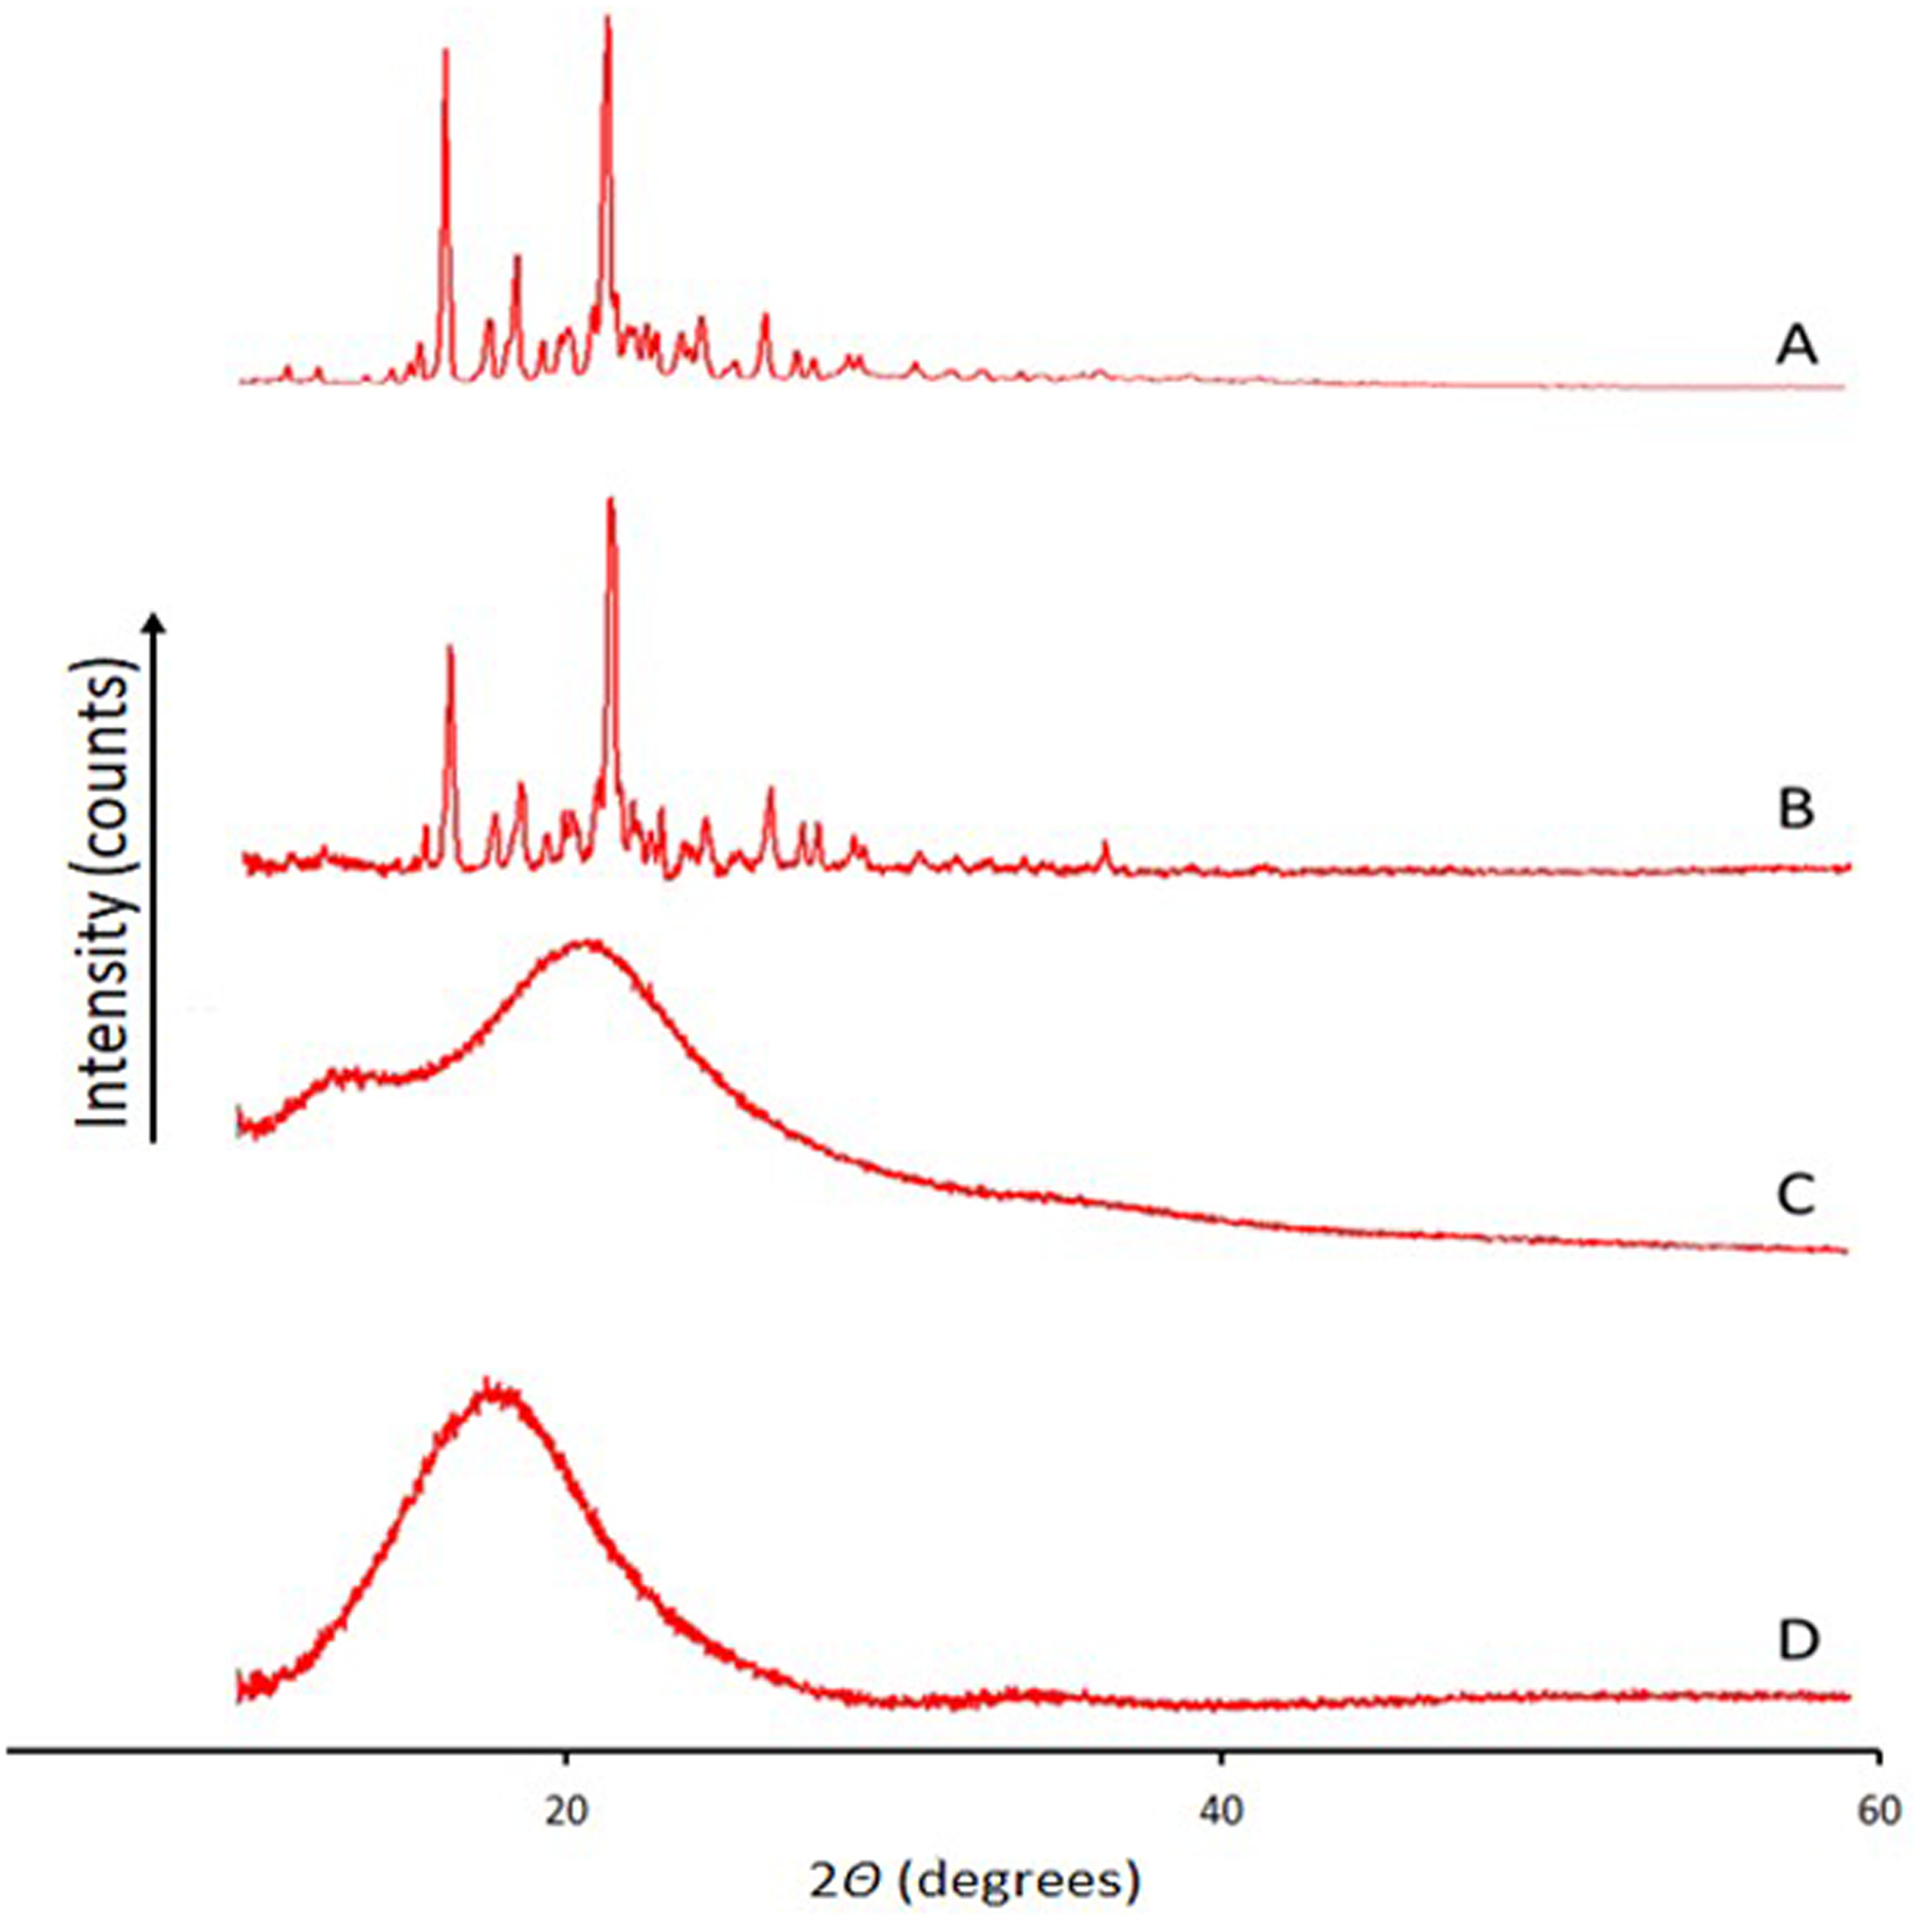
XRD for ELQ-331 SDD. A) ELQ-331, B) physical mixture, C) 14% of ELQ-331-loaded SDD, and D) 25% of ELQ-331-loaded SDD.
3.1.7. Dissolution of ELQ-331 SDD Capsules
The in-vitro dissolution profiles of ELQ-331 and its SDDs in FaSSGF buffer are shown in Figure 7. The ELQ-331 SDD formulations containing 14.3% w/w of drug loading with and without 20% of SLS showed maximum drug releases of 18.82% and 17.87%, respectively, after 60 minutes. Dissolution of ELQ-331 alone showed a maximum drug release of 0.34% after 60 minutes.
Figure 7.
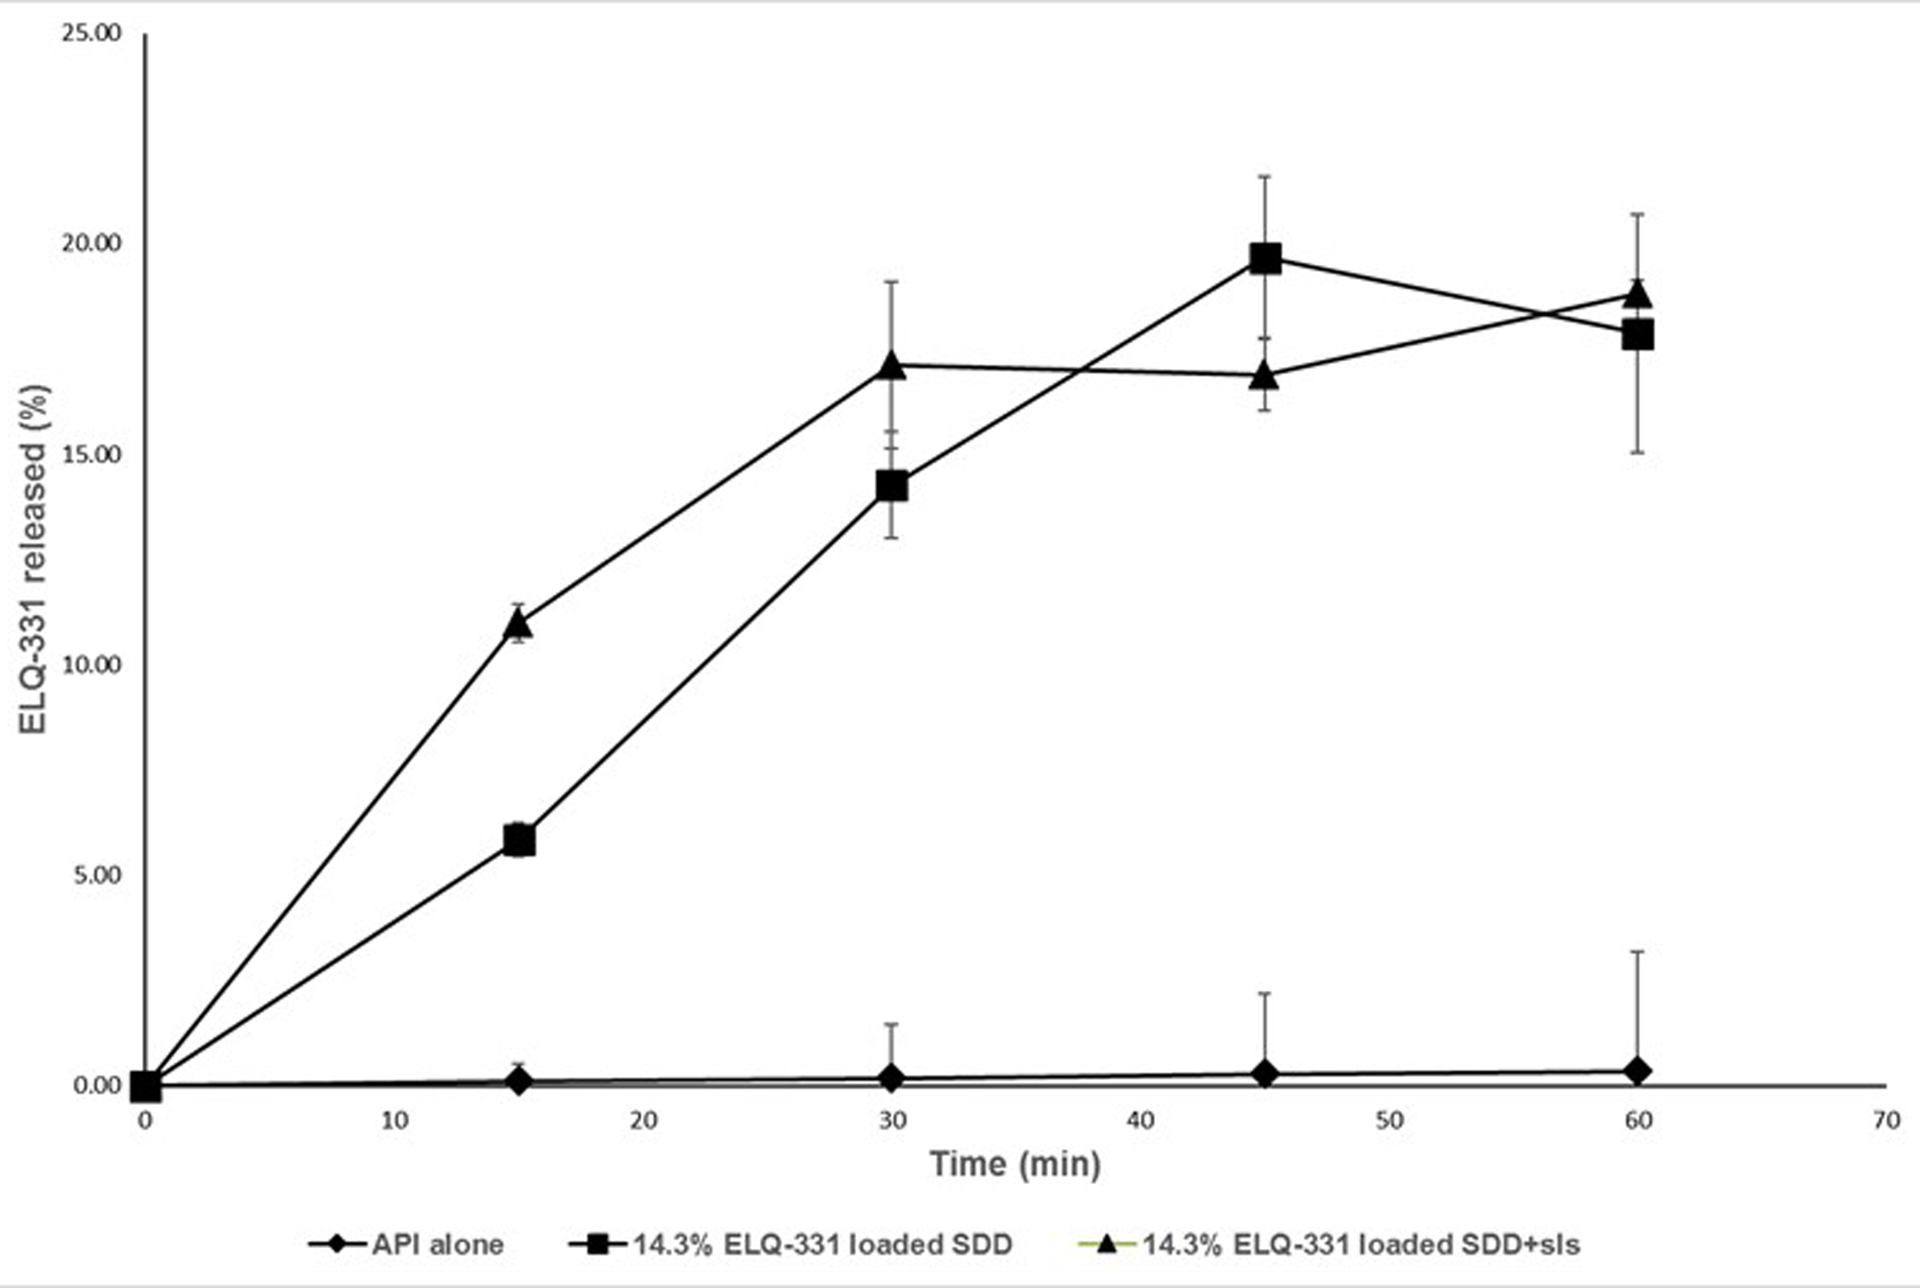
Dissolution of ELQ-331 SDD formulations with SLS, (Mean ± SD; n=3).
The formulation containing 14%w/w drug-loaded SDD powder blended with 20% SLS was selected for the in-vivo oral pharmacokinetic study in rats.
3.1.8. Stability of ELQ-331 SDD powder
The results of stability studies of ELQ-331 SDD powder showed no significant decrease or increase in assay of ELQ-331 and no observable degradation products after storing up to 12 weeks at 25°C/60% RH and 40°C/75% RH under open and closed cap conditions. The PXRD observations showed lack of intense peaks for ELQ-331 SDD compared to ELQ-331 drug alone after storing at 25°C/60%RH and 40°C/75%RH for 12 weeks. All the samples showed absence of intense peaks in the diffractograms compared with pure drug. However, very small new peaks at different 2theta angle were observed for recrystallized drug in SDDs. In addition, all DSC thermograms in Figure 8 of stability samples did not show melting endotherm of ELQ-331. Figure 9 follow the XRD pattern changes obtained in the stability samples. Hence, the SDD of ELQ-331 prepared with Soluplus® polymer and silicon dioxide is chemically and physically stable up to 12 weeks under the test storage conditions.
Figure 8.
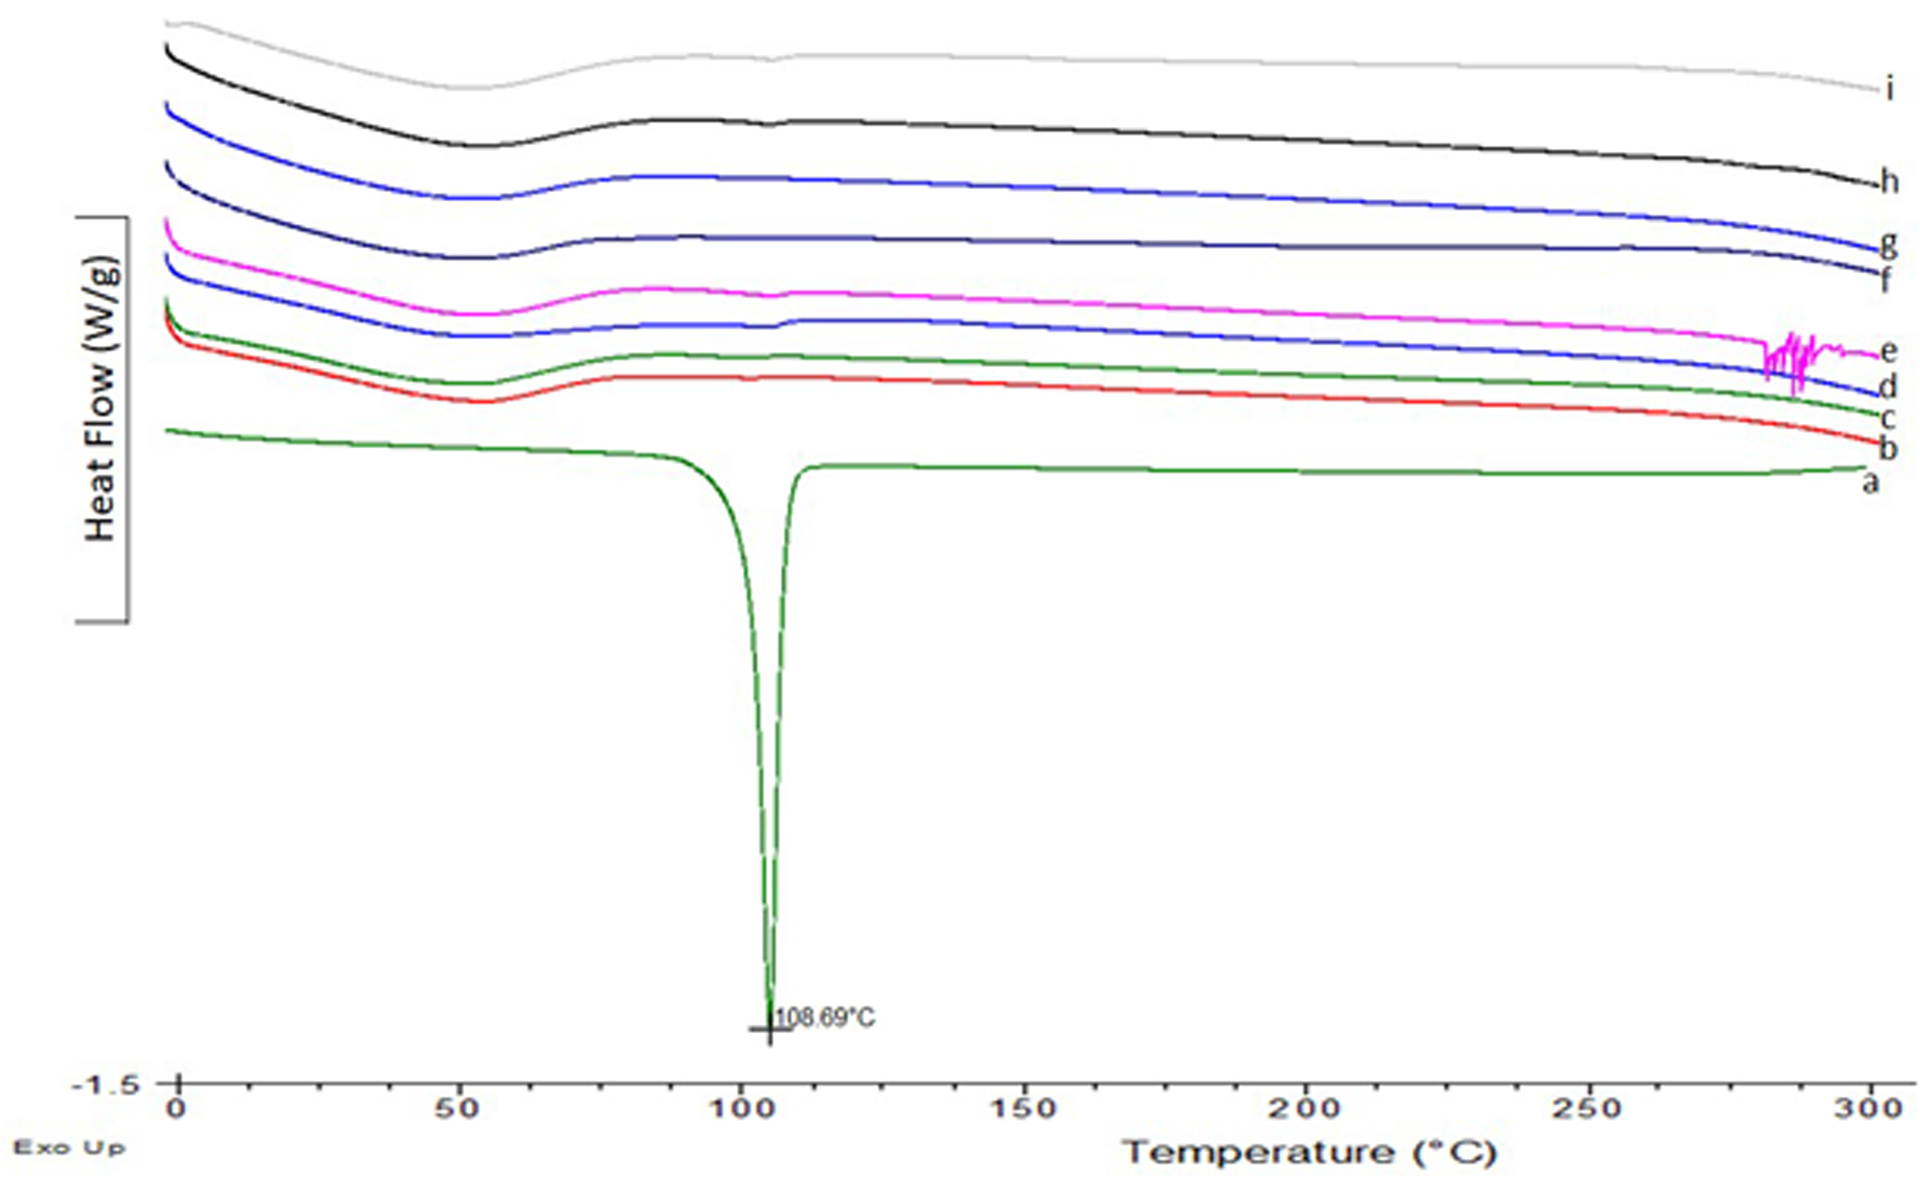
DSC thermograms for ELQ-331 SDD stability samples. a-ELQ-331; b-25°C/60%RH 3 month-Open; c-25°C/60%RH 3 month-Closed; d-40°C/75%RH 3 month-Closed; e-40°C/75%RH 3 month-Open; f-25°C/60%RH-1month-Open; g-25°C/60%RH-1month-Closed; h-40°C/75%RH-1month-Closed; i-40°C/75%RH-1month-Open.
Figure 9.
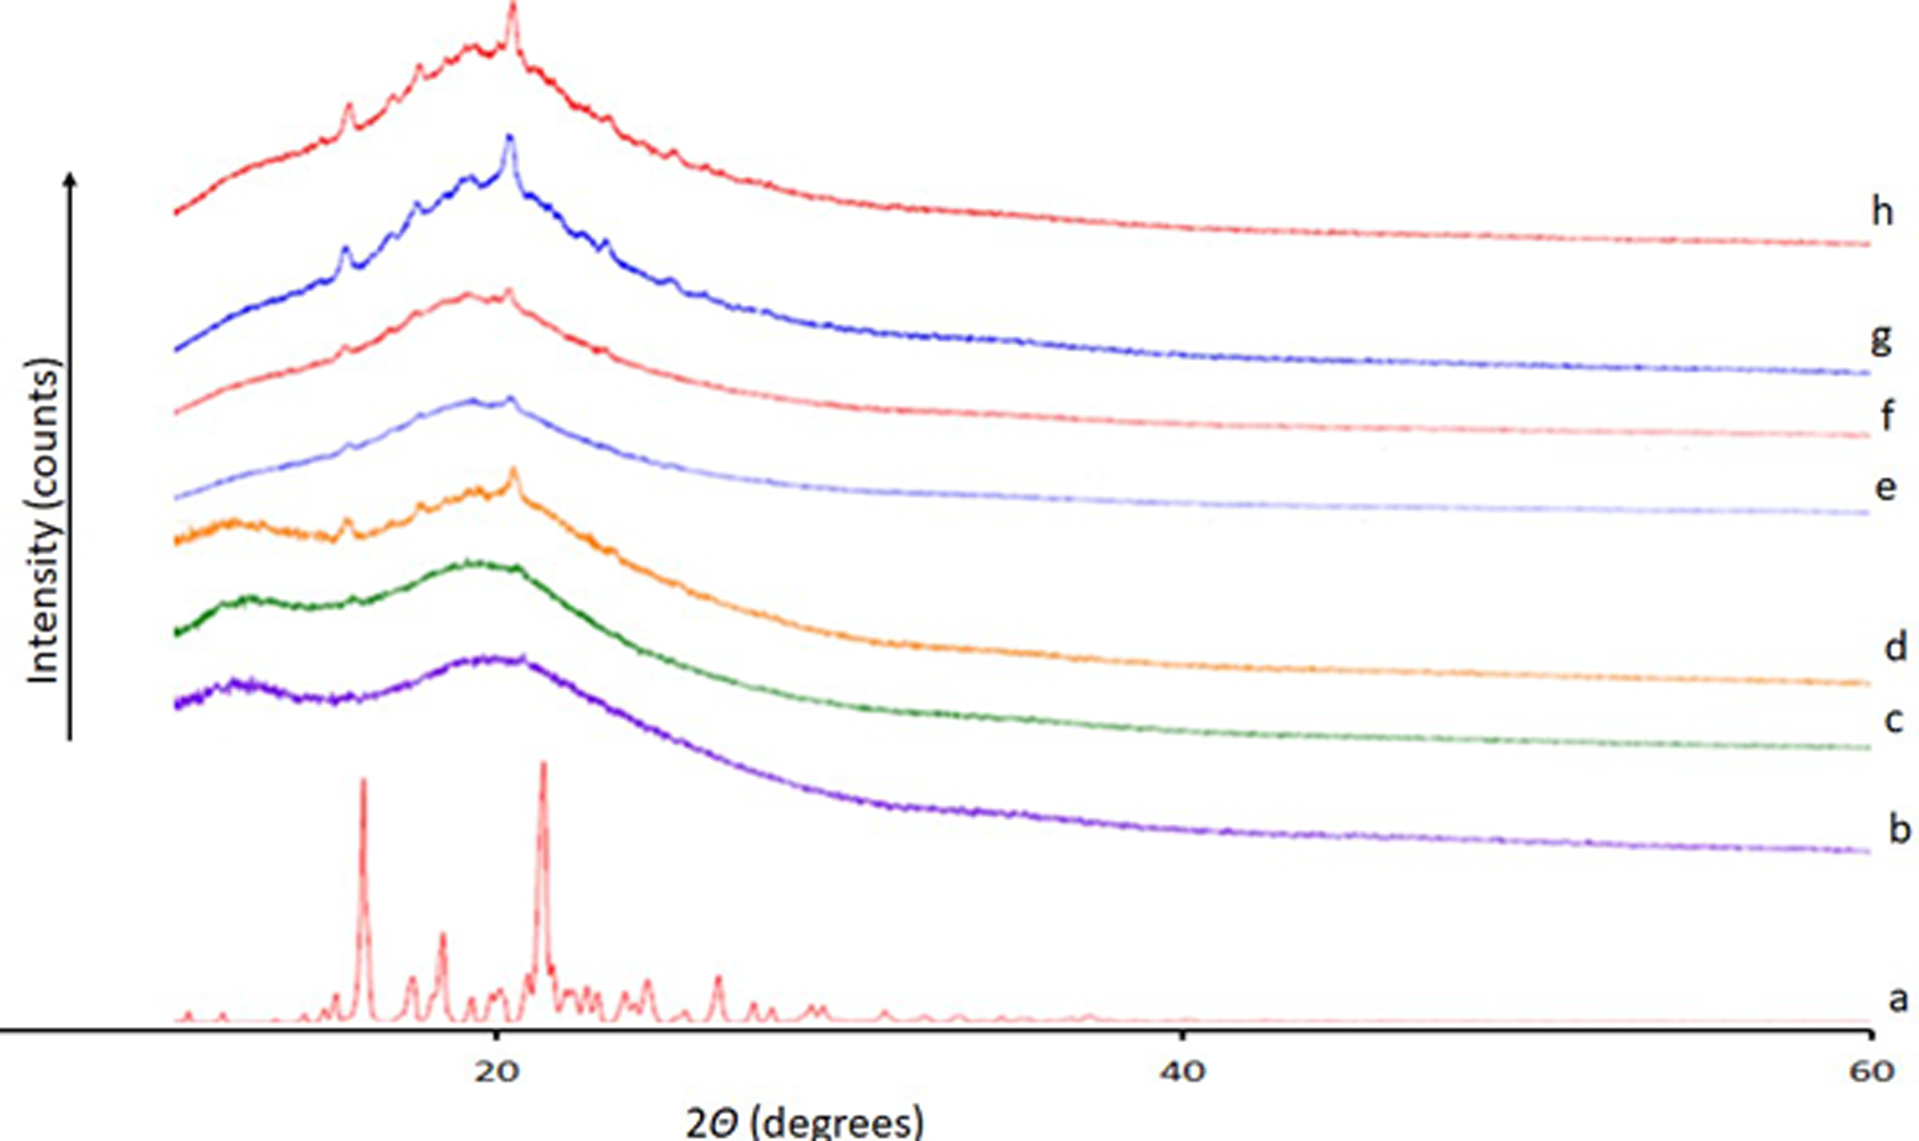
XRD for ELQ-331 SDD stability samples. a-ELQ-331; b-25°C/60%RH 1 month-Closed; c-25°C/60%RH 1 month-Open; d-40°C/75%RH 1 month-Open; e-25°C/60%RH 3 months-Closed; f-25°C/60%RH- 3 months-Open; g-40°C/75%RH 3 month-Closed; h-40°C/75%RH 3 month-Open.
3.2. Solubility of ELQ-331 in Oils, Surfactants, and Co-surfactants
The solubility data of ELQ-331 in various components used in SEDDS formulations such as oils, surfactants, and co-surfactants results are presented in Table 6. These components are miscible in each other and form homogenous liquids. Among all the components, Capryol 90 showed highest solubility for ELQ-331 (97.7 mg/ml), when formulated at room temperature (23°C). Improved solubility of ELQ-331 was observed in lipid vehicles, surfactants, and co-surfactants compared to aqueous buffers.
Table 6.
Solubility of ELQ-331 in oils, surfactants, co-surfactants.
| No | Solvent | Chemical Name | Solvent Property | Solubility (mg/mL) |
|---|---|---|---|---|
| 1 | Caproyl 90 | Propylene glycol monocaprylate (type II) | Surfactant/oil | 97.70 |
| 2 | Labrafac lipophile WL1349 | Caprylic/Capric triglyceride | Oil | 51.90 |
| 3 | Labrafil M1944 | PEG-5 Oleate | Surfactant/oil | 40.40 |
| 4 | Labrasol | PEG-8 Caprylic/Capric Glycerides | Surfactant | 88.50 |
| 5 | Tween-20 | Polysorbate 20 | surfactant | 52.30 |
| 6 | Myglyol 812N | Triglycerides, Medium-Chain | Oil | 45.40 |
| 7 | Span 85 | Sorbitan trioleate 85 | Surfactant | 33.60 |
| 8 | PEG 400 | Polyethylene Glycol-400 | Co-surfactant | 41.90 |
| 9 | Capmul MCM NF | Glyceryl Caprylate | Oil | 48.60 |
3.3. Construction of Pseudo-Ternary Phase Diagrams
A total of three pseudo-ternary phase diagrams were constructed, Figure 10 presents the oil, surfactant, co-surfactant, and Smix ratio of each ternary diagram; the constructed ternary diagrams with micro-emulsion regions are highlighted. The pseudo-ternary phase diagram construction helped us to identify the optimum ratio of oil/surfactant/co-surfactant to formulate the SEDDS. In terms of micro-emulsion regions, the pseudo-ternary phase diagram C had a slightly larger micro-emulsion area, indicating a greater self-micro-emulsification efficiency (Khan et al. 2012).
Figure 10.
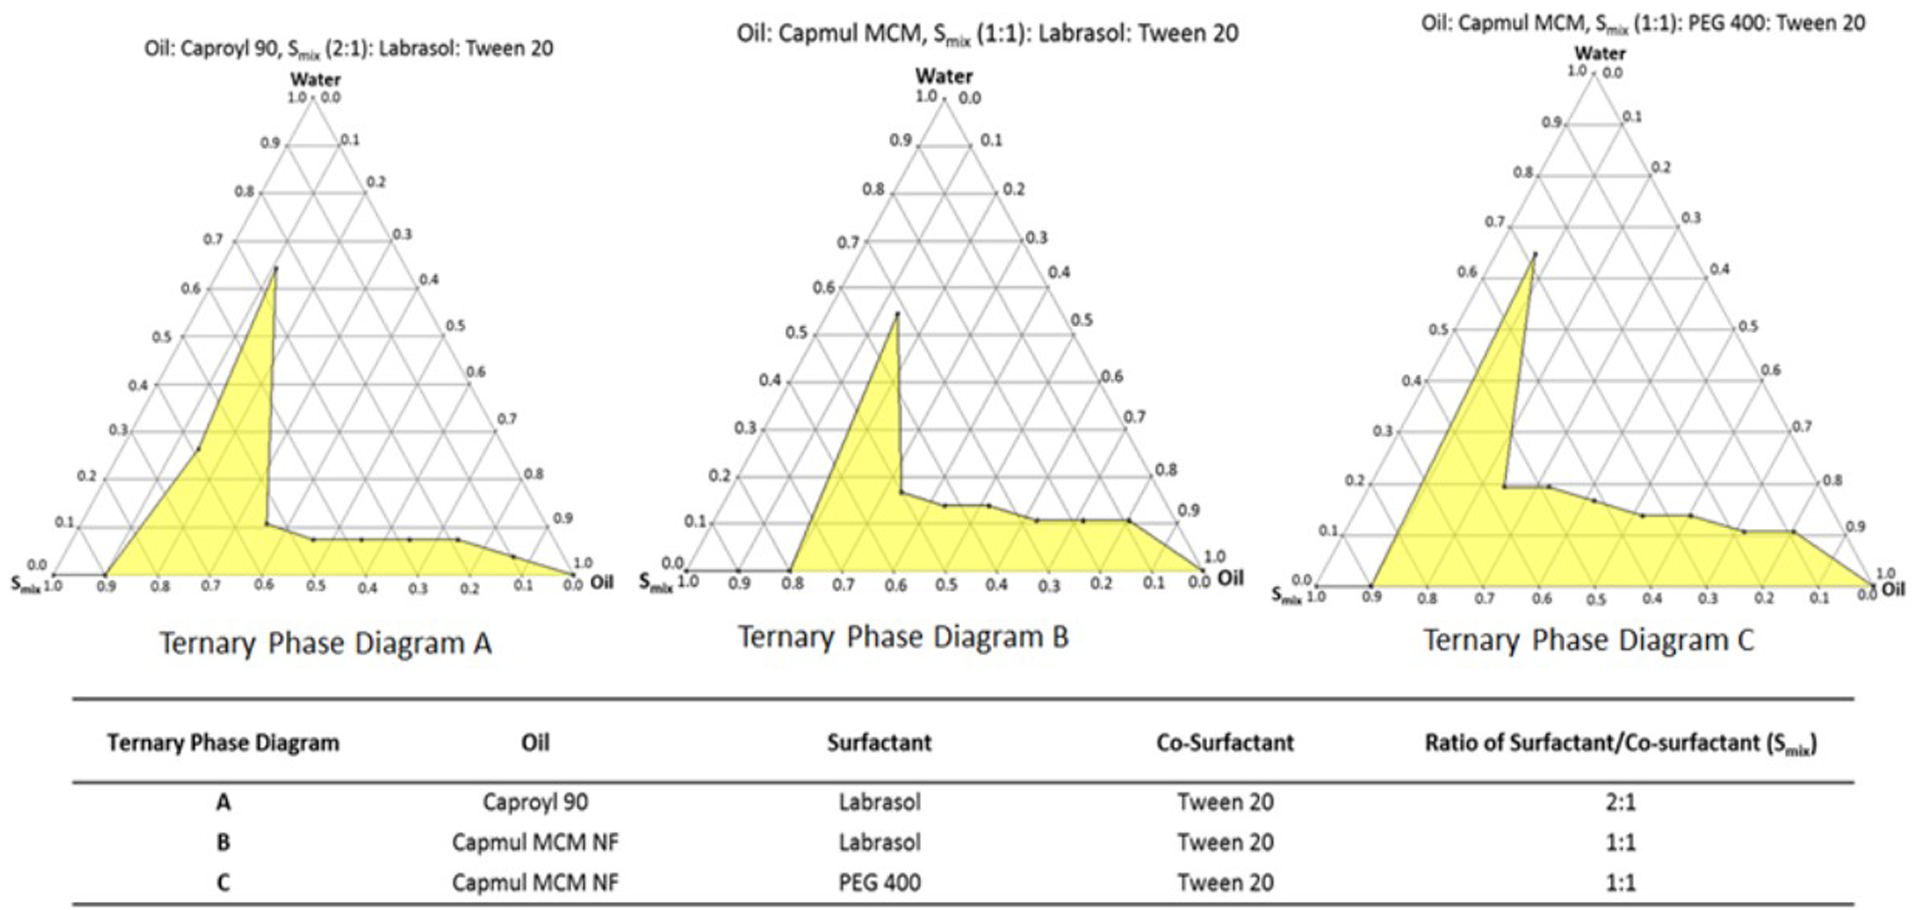
Pseudo-ternary phase diagrams with highlighted micro-emulsion regions.
3.4. Preparation and Characterization of ELQ-331 SEDDS Formulations
3.4.1. Assay of ELQ-331 in SEEDS Formulations
Saturation solubility results of ELQ-331 are presented in Table 6. Solubility of ELQ-331 in the selected SEDDS formulations ranged from 48.90 mg/mL to 76.60 mg/mL, these results were consistent with the solubility of ELQ-331 in individual components of SEDDS.
3.4.2. Dilution Study
Dilution studies were performed to evaluate self-emulsifying properties of selected SEDDS. Formulations were prepared at approximately 80% of saturation solubility as characterized by HPLC analysis. Prepared ELQ-331 SEDDS formulations were clear and stable—images of the formulations and their corresponding formulation dilution at 1 to 100 with water are shown in Figure 11, and the observation of dilutions noted are included in Table 7. Upon dilution with water, all formulations formed emulsions with no precipitation or phase separation; however, there were differences in the time it took to form an emulsion, the clarity of appearance, and the stability of the formed emulsions. Formulations 1 and 2 from phase diagrams A and B formed cloudy to slightly cloudy emulsions, whereas formulation 3 from the phase diagram C quickly formed a clear emulsion with slight bluish color (Table 7).
Figure 11.

ELQ-331 SEDDS formulations and corresponding dilutions.
Table 7.
Composition and assay results of ELQ-331 SEDDS formulations prepared from each pseudo-ternary phase diagram.
| Ternary Diagram | Formulation | SEDDS Formulation Composition (%v/v) | Maximum ELQ-331 Conc. Observed by HPLC Analysis (mg/mL) | Prepared ELQ-331 Conc. (mg/mL) | Observation upon 1 to 100 Dilution with Water |
|---|---|---|---|---|---|
| A | 1 | 28.57 % Caproyl 90 + 47.14% Labrasol + 24.29% Tween 20 | 76.60 | 60.00 | Formed a cloudy emulsion |
| B | 2 | 28.57% Capmul MCM + 35.72% Labrasol + 35.71% Tween 20 | 56.20 | 45.00 | Formed slightly cloudy emulsion |
| C | 3 | 25.00% Capmul MCM + 37.50% PEG 400 + 37.50% Tween 20 | 48.90 | 40.00 | Formed a clear emulsion, with blue appearance |
3.4.3. Droplet Size Measurement and Distribution
Droplet size distribution and statistical analysis results of the ELQ-331 SEDDS formulations are presented in Table 8. Formulation 1 from phase diagram A had the highest median droplet size of 319.70 ± 90.80 nm with a large size distribution variability (coefficient of variation 27.88). Formulation 2 from phase diagram B (median droplet size of 8.60 ± 1.90 nm, coefficient of variation 21.26) and Formulation 3 from phase diagram C (median droplet size of 8.40 ± 1.70 nm, coefficient of variation 19.45) had better droplet size and narrow size distribution variability compared to Formulation 1 from the phase diagram A.
Table 8.
Droplet size distribution statistics of the ELQ-331 SEDDS formulation.
| Ternary Diagram | Formulation | Median (nm) | Mean (nm) | Mode (nm) | Variance (nm2) | Standard Deviation (nm) | Coefficient of Variation |
|---|---|---|---|---|---|---|---|
| A | 1 | 319.70 | 325.80 | 320.20 | 8245.90 | 90.80 | 27.88 |
| B | 2 | 8.60 | 8.80 | 8.30 | 3.52 | 1.90 | 21.26 |
| C | 3 | 8.40 | 8.50 | 8.20 | 2.75 | 1.70 | 19.45 |
Because of good self-emulsifying characteristics like spontaneous formation of bluish emulsion, clarity of appearance, stability of the diluted emulsion formed, and nano- emulsion droplet size (median droplet size of 8.40 ± 1.70 nm) with better size distribution variability (coefficient of variation 19.45), Formulation 3 from phase diagram C (Table 8) was selected for in-vivo pharmacokinetic study even though it had lower solubility for ELQ-331.
3.5. Oral Pharmacokinetic (PK) study in Rats:
The pharmacokinetic parameters such as maximum observed plasma concentration (Cmax), time to reach maximum plasma concentration (Tmax), half-life (t1/2), Area under the plasma concentration-time curve up to the last measurable concentration (AUC) of ELQ-300 (rapidly converted base form) from the ELQ-331 prodrug after oral administration of ELQ-331 SDD and SEDDS formulations in Sprague Dawley rats are presented in Table 9. The mean plasma concentration-time profiles of the ELQ-300 (base form) from ELQ-331 SDD and SEDDS formulations are plotted against time in Figure 12. Plasma concentrations of the ELQ-331 were below the lower limit of quantitation (LLOQ, 5 ng/ml) in all collected plasma samples. In contrast, ELQ-300 was quantifiable in all samples, and levels were greater than the LLOQ though 96 hr. Even though both formulations showed similar absorption with a Tmax around 4.0 h, SEDDS formulation showed a significantly higher mean Cmax of 6000 ng/ml (12.6μM) as compared to that of 4130 ng/ml (8.7μM) of the SDD suspension (Table 9). A higher exposure, approximately 28% more for SEDDS formulation was observed compared to SDD formulation based on the area-under-the-curve (AUC) values. However, both formulations showed similar elimination half-life (t1/2) of approximately 14 hours that resulted in large volume distribution (Vz/F) and low clearance (Cl/F) values. In summary, the ELQ-331 (prodrug) was rapidly converted to ELQ-300; this is based on the observation that ELQ-331 levels were < 5 ng/ml in all plasma samples whereas ELQ-300 was readily measured in the systemic circulation of rats administered the parent drug in either a SDD formulation or SEDDS formulation. Both formulations resulted in excellent exposure levels and quantifiable concentrations of ELQ-300 through 96 hours following dose administration. ELQ-300 AUC last and AUC inf values were about 1.4-fold higher in SEDDS-treated vs. SDD-treated rats. The absolute bioavailability of ELQ-300 was found to be approximately 25.08% for SDD and 35.38% for SEDDS formulations. The bioavailability was calculated on the basis of AUC0–24h after oral administration, relative to the dose-normalised AUC0–24h after IV administration. A comparative plot of C max and AUC last values for rats dosed with ELQ-331 SDD, ELQ-331 SEDDS and the CMC suspension of ELQ-300 presented in Figure 13. Among all three formulations, the ELQ-331 SEDDS formulation showed the highest exposure levels of ELQ-300 compared to the ELQ-331 SDD formulation and ELQ-300 CMC suspension.
Table 9.
Pharmacokinetic parameters for ELQ-300 in Male Sprague Dawley rats that were orally administered ELQ-331 SDD and SEDDS formulations
| Formulation | Tmax
(hr) |
Cmax
(ng/ml) |
t1/2
(hr) |
AUClast
(hr.ng/ml) |
AUCinf
(hr.ng/ml) |
Vz/F (ml/kg) |
Cl/F (ml/hr/kg) |
|---|---|---|---|---|---|---|---|
| Mean ± SD; n=3 per group | |||||||
| SDD | 4 ± 0 | 4130 ± 2280 | 14.2 ± 1.67 | 71200 ± 17700 | 72300 ± 18100 | 3020 ± 1130 | 145 ± 42 |
| SEDDS | 4 ± 0 | 6000 ± 591 | 13.7 ± 0.6 | 99600 ± 25500 | 100000 ± 25200 | 2050 ± 420 | 104 ± 24 |
Dose: 12.14 mg/kg ELQ-331 (equivalent to 10 mg/kg of ELQ-300); Tmax: Time at which Cmax was observed, Cmax: Maximum observed plasma concentration; t1/2: half-life; AUC last: Area under the plasma concentration-time curve up to the last measurable concentration; AUCinf: Area under the plasma concentration-time curve from time zero to infinity. Vz/F: Apparent volume of distribution during terminal phase after oral/extravascular administration; Cl/F: Apparent total plasma or serum clearance of drug after oral administration. SDD: Spray-dried Dispersion; SEDDS: Self-Emulsifying Drug Delivery System.
Figure 12.
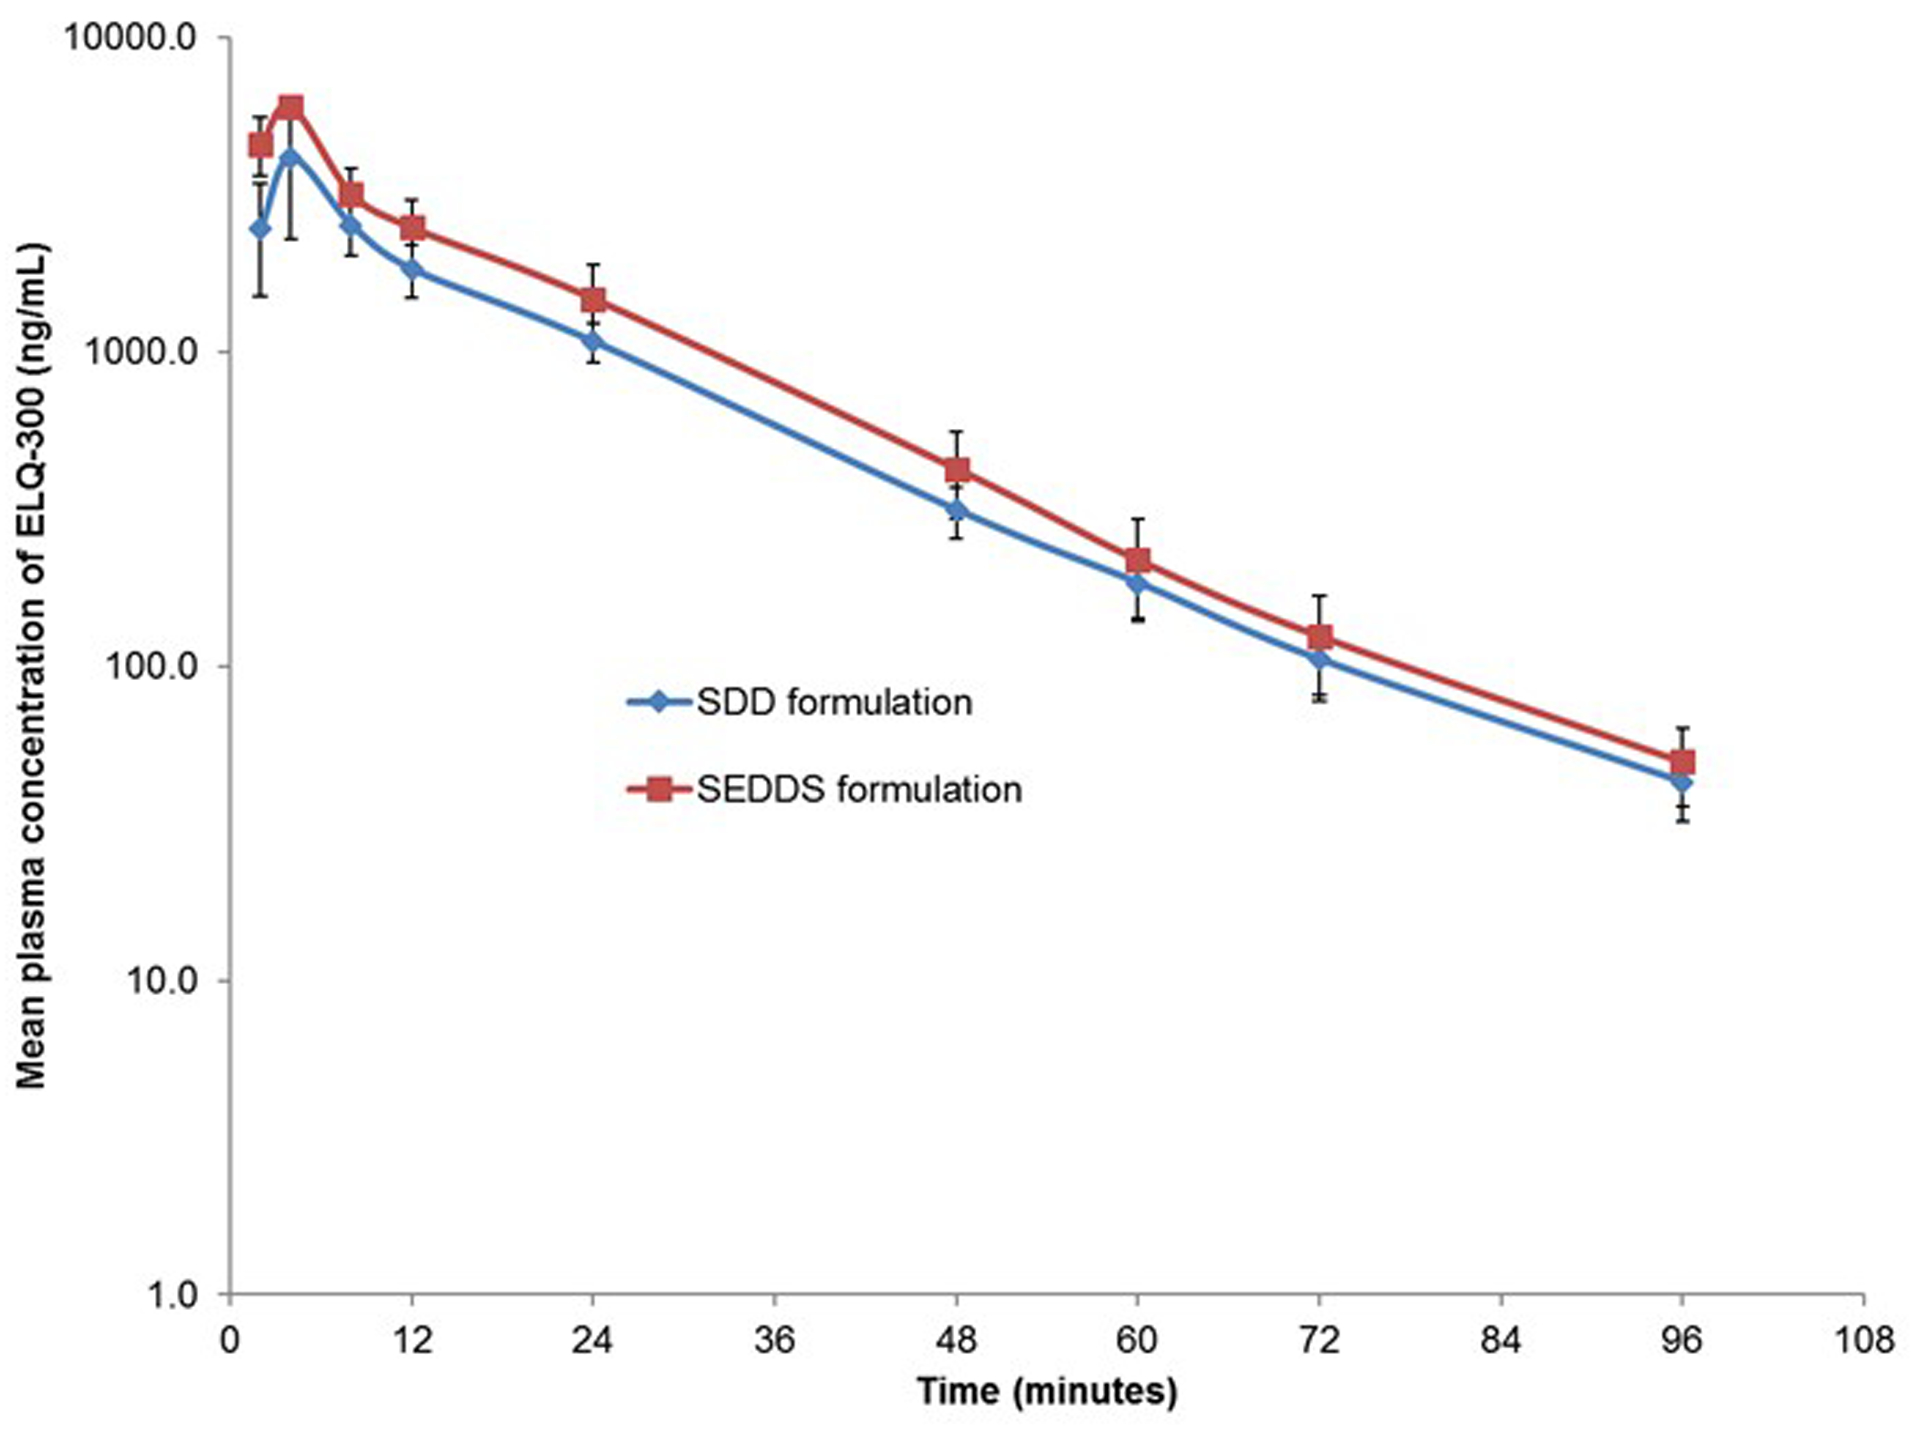
Plasma concentrations of ELQ-300 in male Sprague-Dawley rats administered ELQ-331 in two formulations. (Mean± SD; n=3). ELQ-331 levels were <LLOQ in plasma collected at all time points. SDD: Spray Dried Dispersion formulation of ELQ-331; SEDDS: Self-Emulsifying Drug Delivery System of ELQ-331.
Figure 13.
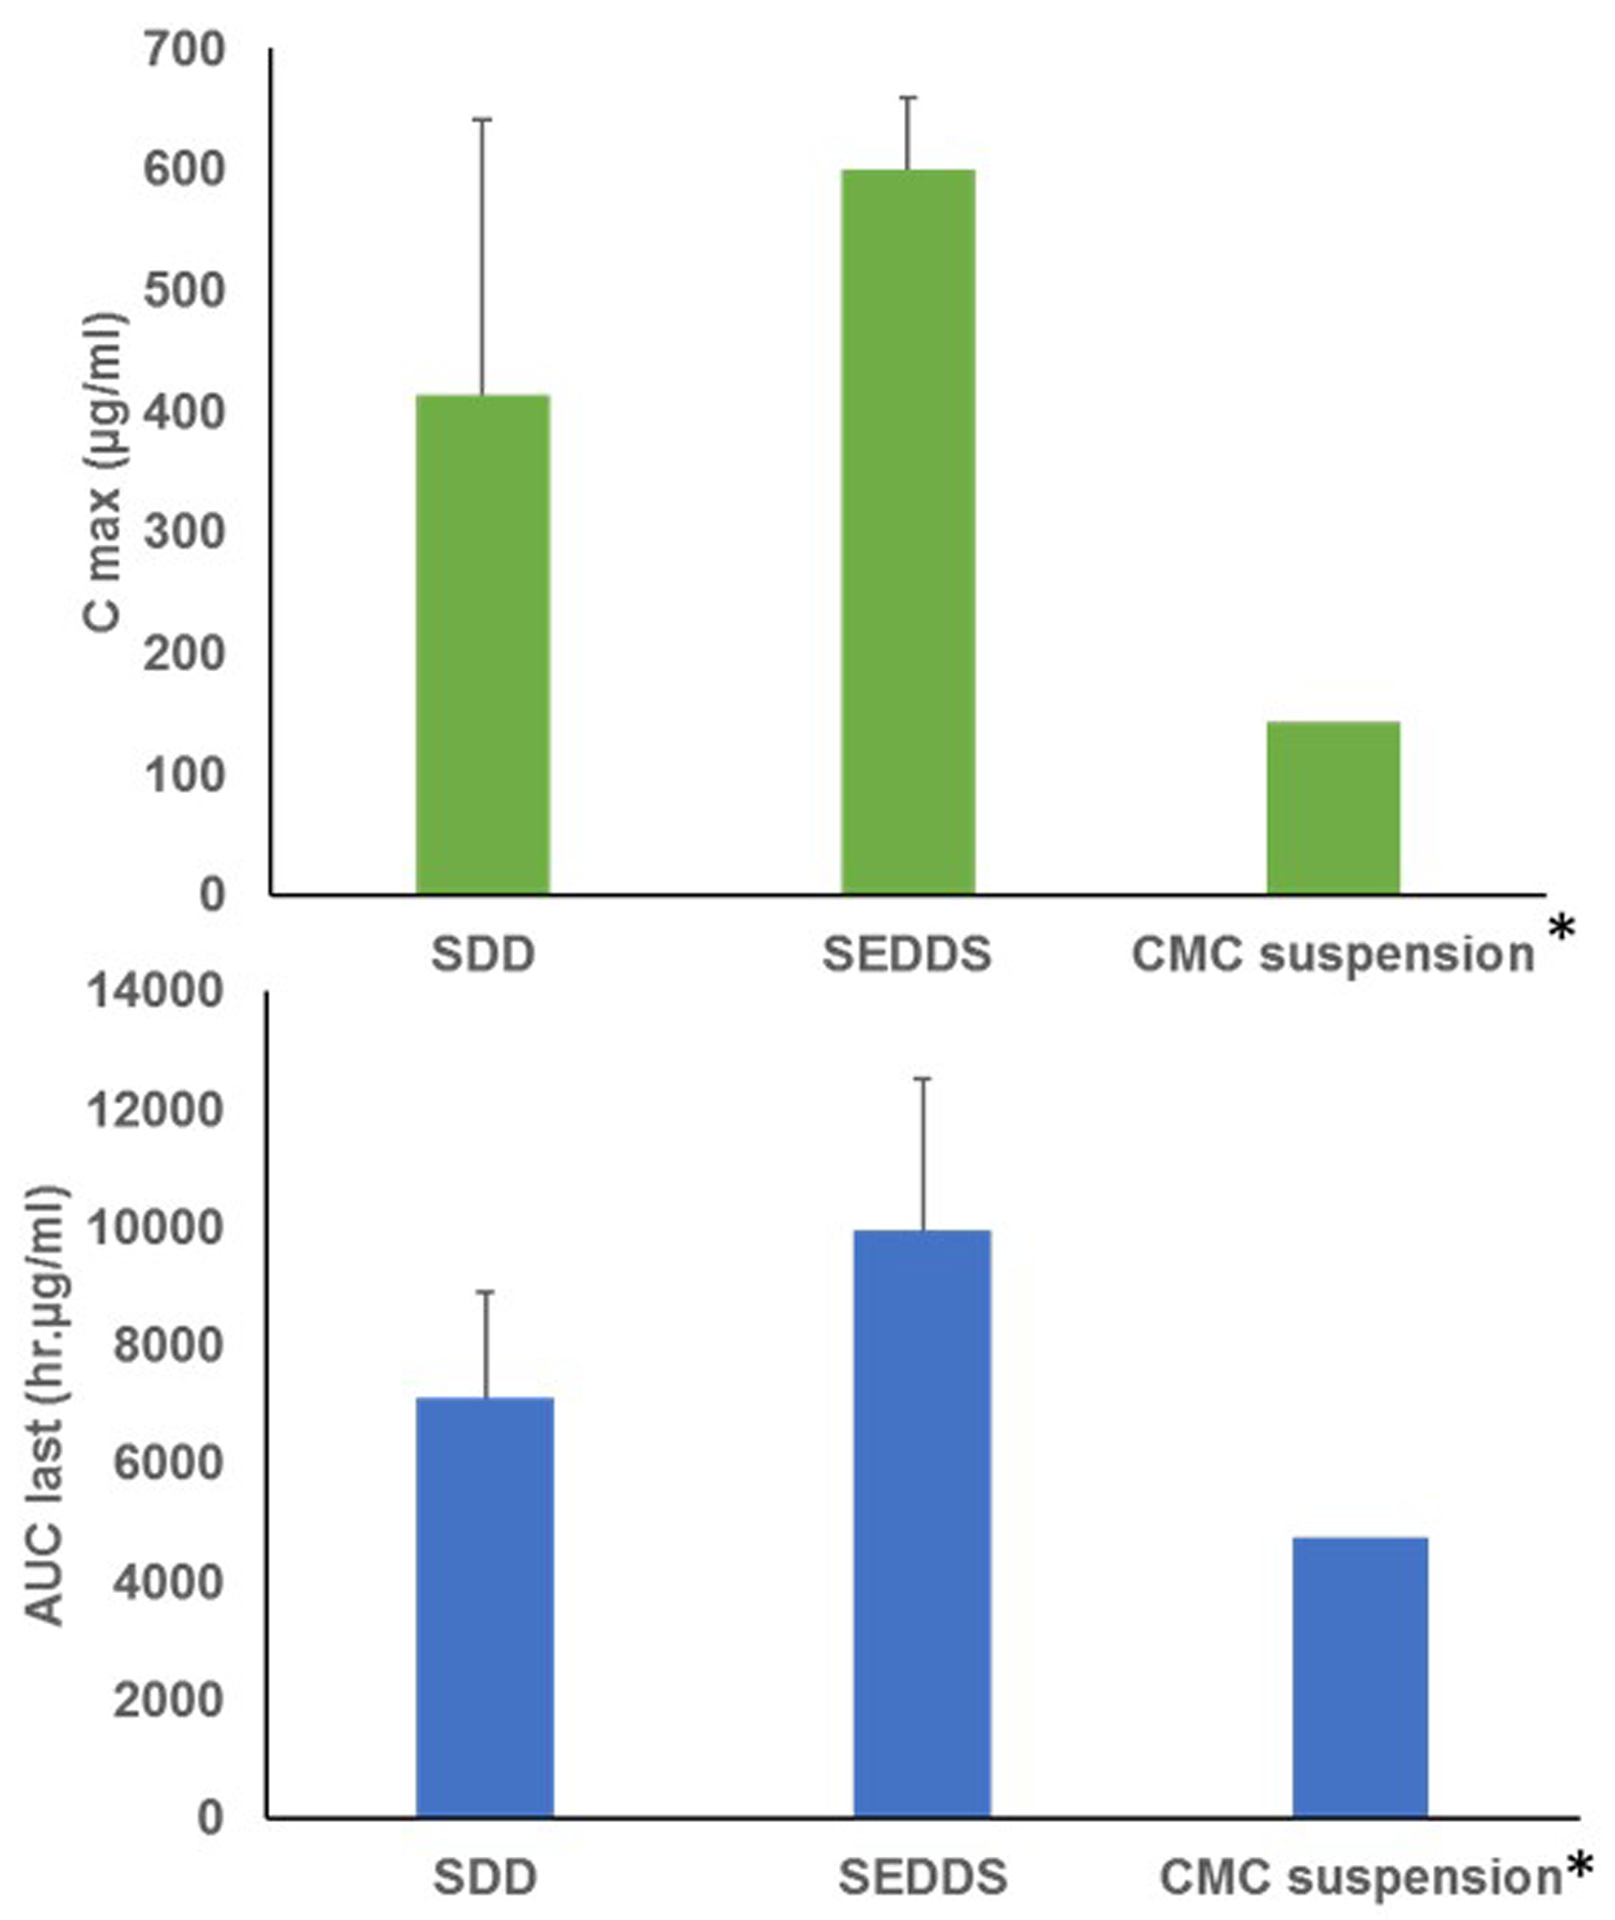
Comparison of oral pharmacokinetic parameters (Cmax and AUClast) of ELQ-300 in male Sprague-Dawley rats. SDD: Spray-dried Dispersion formulation of ELQ-331; SEDDS: Self-Emulsifying Drug Delivery System of ELQ-331; CMC suspension: Carboxy methyl cellulose suspension; Cmax: Maximum observed plasma concentration; AUC last: Area under the plasma concentration-time curve up to the last measurable concentration. (Mean± SD; n=3). *Data was taken from previous study, ELQ-300 was administered orally in CMC suspension.
4. Discussion
Many new chemical entities show good efficacy in in-vitro studies but have poor aqueous solubility and bioavailability. Spray-dried dispersions of ELQ-331 prepared with an amphiphilic copolymer like polyvinyl caprolactam-polyvinyl acetate-polyethylene glycol graft copolymer (Soluplus®) and a highly porous, amorphous silicon dioxide like ‘Aeroperl®300 Pharma’ resulted in greater increases in drug solubility. Most notably, addition of SLS externally to ELQ-331 SDD powders tremendously improved the solubility of ELQ-331 when compared to SDD formulations without it. The ELQ-331 SDD powder showed enhanced dissolution rate compared to ELQ-331 alone in FaSSGF buffer. The conversion of ELQ-300 from ELQ-331 in solubility samples was minimal. All the SDDs of ELQ-331 generated stable amorphous dispersions that were confirmed with PXRD, DSC, TGA, FTIR, and SEM characterization. The finer particles of the SDD samples were visualized by SEM. We hypothesize that the reduction in particle size and amorphization of the crystalline drug enhances the dissolution rate of SDD in the current study (Jung et al. 1999). The dissolution results show that the amorphous form of ELQ-331 SDD powder has a higher dissolution rate than the crystalline form of ELQ-331 unformulated. The physical mixture has the crystalline form of drug, so it is not dissolved easily. The presence of fewer drug moieties, with larger concentration of dissipated Soluplus® does not form a good micelle. On spray drying, more of the now-amorphous drug is available. The higher drug presence in the same concentration of Soluplus, results in more effective micellization. Craig (2002) reported the dissolved polymer forms a layer around the formulation, in which the drug must dissolve before being released. The disappearance of the melting endotherms by DSC confirms the presence of the amorphous drug in the SDD formulation. The PXRD diffractograms showed disappearance of peaks, resulting in a diffused diffraction peaks known as the halo effect. Similar observations have been reported in the literature for several crystalline, poorly soluble drugs in which their SDD formulations contained the amorphous form of drug and had significantly improved solubility and dissolution rates over pure drug (Doherty and York 1987; Okimoto et al. 1997; Veiga et al. 1998). These results and ours confirm that the spray-drying process facilitates the formation of amorphous ELQ-331 SDD and support the observations made regarding the DSC thermograms.
In general, SEDDS formulations are characterized by determining the feasibility of being self-emulsified upon dilution. Surfactants present in the SEDDS mixture reduce the interfacial tension between the oil and aqueous phases and facilitate dispersion and formation of oil-in-water emulsion (Khan et al. 2012). Solubility of ELQ-331 in selected SEDDS formulations ranged from 48.90 mg/mL to 76.60 mg/ml. The optimized SEDDS formulation for ELQ-331 from the pseudo-ternary phase diagram was Capmul MCM (25%), Tween-20 (37.5%) and polyethylene glycol 400 (37.5%). The optimized SEDDS formulation has good self-emulsifying characteristics like spontaneous formation of a bluish emulsion, clarity of appearance, stability of the emulsion upon dilution, the smallest emulsion droplet size (median droplet size of 8.40 ± 1.70 nm), and better size distribution (coefficient of variation 19.45). It is well understood that the droplet size of the emulsion formed by SEDDS is a crucial factor because it determines the rate and extent of drug release as well as absorption (Patel et al. 2011).
The SDD and SEDDS formulations showed good exposure levels and rapid conversion of prodrug ELQ-331 to ELQ-300 (base form) after oral administration to rats. Exposure levels of the ELQ-300 (free-base) based on AUC last and AUC inf were about 1.4-fold higher for the SEDDS-treated vs. SDD-treated rats. However, we do not believe that this necessarily means that SEDDS formulation is superior to SDD formulation. Since the SDD formulation was administered to the rats in a suspension form rather than as a solid (e.g. as powder filled capsules), it is very likely that the SDD demonstrated a faster in-vivo dissolution profile. A tablet formulation based on the SDD could be designed to have sustained release profile for enhanced exposure, which could be advantageous for a potent antimalarial drug like ELQ-331. At the same time, a SEDDS formulation would have the versatility for dose-manipulations and could be readily developed as a stable clinical liquid or solid formulation.
5. Conclusions:
Enabling formulation technologies like spray dried dispersions (SDD) and self-emulsifying drug delivery systems (SEDDS) are suitable for improving solubility and bioavailability for oral drugs. Even though both formulations showed similar absorption with a Tmax around 4.0 h, SEDDS formulation showed a significantly higher mean Cmax of 6000 ng/ml (12.6μM) as compared to that of 4130 ng/ml (8.7μM) of the SDD suspension. This translates to about 1.4-fold higher exposure levels of ELQ-300 (based on AUC values) in SEDDS over the SDD formulations. However, we do not believe that this necessarily means that SEDDS formulation is superior to SDD formulation; additional preclinical studies are needed for accurate comparison of the two dosage forms. These novel formulations of the antimalarial agent ELQ-331 resulted in improved solubility and oral bioavailability profiles that should enable development of ELQ-331 as a clinical candidate for use in the prophylaxis and treatment of malaria.
6. Acknowledgement:
Authors wish to thank Dr. Susan A. Charman of Centre for Drug Candidate Optimization, Monash Institute of Pharmaceutical Sciences, Australia for providing intravenous pharmacokinetic data of ELQ-300 in rats, which was used for calculating bioavailability of SEDDS and SDD formulations. Authors also wish to thank Dr. Chun Yang for the bioanalytical analysis and Kathleen O’Loughlin for the coordinating pharmacokinetic study activities with the oral formulations. Research funds reported for this publication were provided by the US Department of Defense Peer Reviewed Medical Research Program (Log #PR130649; Contract #W81XWH-14-1-0447) (M.K.R. and G.S.). Funds were also provided by the United States National Institutes of Health award number AI100569 (M.K.R.) and by the Veterans Affairs Merit Review Program Award number i01 BX003312 (M.K.R.).
Authors further acknowledge the following:
“The U.S. Army Medical Research Acquisition Activity, 820 Chandler Street, Fort Detrick MD 21702-5014 is the awarding and administering acquisition office.”
“This work was supported by the Office of the Assistant Secretary of Defense for Health Affairs, through the Peer Reviewed Medical Research Program under Award No. W81XWH-14-1-0447. Opinions, interpretations, conclusions and recommendation are of those of the author and are not necessarily endorsed by the Department of Defense.”
“In conducting research using animals, the investigator(s) adheres to the laws of the United States and regulations of the Department of Agriculture.” Include required assurances, approvals, documents and information specified on the Animal Care and Use Review Office (ACURO) website (https://mrmc.detrick.army.mil/index.cfm?pageid=Research_Protections.acuro&rn=1).
7. Disclosure of interest:
This project has been funded in whole or in part by a Department of Defense (DOD) grant of the Congressionally Directed Medical Research Programs (CDMRP) Award # W81XWH-14-1-0447. The authors report no declaration of interest.
References
- Aakeroy CB, Forbes S, Desper J. 2009. Using cocrystals to systematically modulate aqueous solubility and melting behavior of an anticancer drug. J Am Chem Soc. 131(47):17048–17049. [DOI] [PMC free article] [PubMed] [Google Scholar]
- Alday PH, Bruzual I, Nilsen A, Pou S, Winter R, Ben Mamoun C, Riscoe MK, Doggett JS. 2017. Genetic evidence for cytochrome b Qi site inhibition by 4(1H)-quinolone-3- diarylethers and antimycin in toxoplasma gondii. Antimicrob. Agents Chemother 61(2):e01866–01816. [DOI] [PMC free article] [PubMed] [Google Scholar]
- Baghel S, Cathcart H, O’Reilly NJ. 2016. Polymeric amorphous solid dispersions: a review of amorphization, crystallization, stabilization, solid-state characterization, and aqueous solubilization of biopharmaceutical classification system class II drugs. J Pharm Sci. 105(9):2527–2544. [DOI] [PubMed] [Google Scholar]
- Bhujbal SV, Zemlyanov DY, Cavallaro A, Mangal S, Taylor LS, Zhou QT. 2018. Qualitative and quantitative characterization of composition heterogeneity on the surface of spray dried amorphous solid dispersion particles by an advanced surface analysis platform with high surface sensitivity and superior spatial resolution. Mol Pharmaceutics. 15(5):2045–2053. [DOI] [PMC free article] [PubMed] [Google Scholar]
- Chauhan B, Shimpi S, Paradkar A. 2005. Preparation and evaluation of glibenclamide-polyglycolized glycerides solid dispersions with silicon dioxide by spray drying technique. Eur. J. Pharm. Sci 26(2):219–230. [DOI] [PubMed] [Google Scholar]
- Chen Y, Li G, Huang J-G, Wang R-H, Liu H, Tang R. 2009. Comparison of self-microemulsifying drug delivery system versus solid dispersion technology used in the improvement of dissolution rate and bioavailability of vinpocetine. Acta pharmaceutica Sinica. 44(6):658–666. [PubMed] [Google Scholar]
- Chiou WL, Riegelman S. 1971. Pharmaceutical applications of solid dispersion systems. J Pharm Sci. 60(9):1281–1302. [DOI] [PubMed] [Google Scholar]
- Constantinides PP. 1995. Lipid microemulsions for improving drug dissolution and oral absorption: physical and biopharmaceutical aspects. Pharm. Res 12(11):1561–1572. [DOI] [PubMed] [Google Scholar]
- Craig DQM. 2002. The mechanisms of drug release from solid dispersions in water-soluble polymers. Int. J. Pharm 231(2):131–144. [DOI] [PubMed] [Google Scholar]
- Dave RH, Patel HH, Donahue E, Patel AD. 2013. To evaluate the change in release from solid dispersion using sodium lauryl sulfate and model drug sulfathiazole. Drug Dev. Ind. Pharm 39(10):1562–1572. [DOI] [PubMed] [Google Scholar]
- Doherty C, York P. 1987. Mechanisms of dissolution of frusemide/PVP solid dispersions. Int. J. Pharm 34(3):197–205. [Google Scholar]
- Dondorp AM, Fairhurst RM, Slutsker L, MacArthur JR,MD J GB, Guerin PJ, Wellems TE, Ringwald P, Newman RD, Plowe CV. 2011. The threat of artemisinin-resistant malaria. N. Engl. J. Med 365(12):1073–1075. [DOI] [PMC free article] [PubMed] [Google Scholar]
- Elamin AA, Ahlneck C, Alderborn Gr, Nystrom C. 1994. Increased metastable solubility of milled griseofulvin, depending on the formation of a disordered surface structure. Int. J. Pharm 111(2):159–170. [Google Scholar]
- Fairhurst RM, Dondorp AM. 2016. Artemisinin-Resistant Plasmodium falciparum Malaria. EI10-0013-2016. Microbiol. Spectr 4(3). [DOI] [PMC free article] [PubMed] [Google Scholar]
- Friesen DT, Shanker R, Crew M, Smithey DT, Curatolo WJ, Nightingale JAS. 2008. Hydroxypropyl methylcellulose acetate succinate-based spray-dried dispersions: an overview. Mol Pharmaceutics. 5(6):1003–1019. [DOI] [PubMed] [Google Scholar]
- Frueh L, Li Y, Mather MW, Li Q, Pou S, Nilsen A, Winter RW, Forquer IP, Pershing AM, Xie LH et al. 2017. Alkoxycarbonate ester prodrugs of preclinical drug candidate ELQ-300 for prophylaxis and treatment of malaria. ACS Infect Dis. 3(10):728–735. [DOI] [PMC free article] [PubMed] [Google Scholar]
- Ha E-S, Baek I-h, Cho W, Hwang S-J, Kim M-S. 2014. Preparation and evaluation of solid dispersion of atorvastatin calcium with Soluplus® by spray drying technique. Chem. Pharm. Bull 62(6):545–551. [DOI] [PubMed] [Google Scholar]
- Homayouni A, Sadeghi F, Nokhodchi A, Varshosaz J, Afrasiabi Garekani H. 2015. Preparation and characterization of celecoxib dispersions in Soluplus®: comparison of spray drying and conventional methods. Iranian journal of pharmaceutical research: IJPR. 14:35–50. [PMC free article] [PubMed] [Google Scholar]
- Jain A, Ran Y, Yalkowsky SH. 2004. Effect of pH-sodium lauryl sulfate combination on solubilization of PG-300995 (an anti-HIV agent): a technical note. AAPS PharmSciTech. 5(3):e45. [DOI] [PMC free article] [PubMed] [Google Scholar]
- Jinno J, Kamada N, Miyake M, Yamada K, Mukai T, Odomi M, Toguchi H, Liversidge GG, Higaki K, Kimura T. 2006. Effect of particle size reduction on dissolution and oral absorption of a poorly water-soluble drug, cilostazol, in beagle dogs. J. Control. Release 111(1–2):56–64. [DOI] [PubMed] [Google Scholar]
- Jung J-Y, Yoo SD, Lee S-H, Kim K-H, Yoon D-S, Lee K-H. 1999. Enhanced solubility and dissolution rate of itraconazole by a solid dispersion technique. Int. J. Pharm 187(2):209–218. [DOI] [PubMed] [Google Scholar]
- Kang BK, Lee JS, Chon SK, Jeong SY, Yuk SH, Khang G, Lee HB, Cho SH. 2004. Development of self-microemulsifying drug delivery systems (SMEDDS) for oral bioavailability enhancement of simvastatin in beagle dogs. Int. J. Pharm 274(1):65–73. [DOI] [PubMed] [Google Scholar]
- Kawakami K 2012. Modification of physicochemical characteristics of active pharmaceutical ingredients and application of supersaturatable dosage forms for improving bioavailability of poorly absorbed drugs. Adv. Drug Deliv. Rev 64(6):480–495. 64(6) [DOI] [PubMed] [Google Scholar]
- Khan F, Islam MS, Roni MA, Jalil R-U. 2012. Systematic development of self-emulsifying drug delivery systems of atorvastatin with improved bioavailability potential. Sci. Pharm 80(4):1027–1043. [DOI] [PMC free article] [PubMed] [Google Scholar]
- Kimura K, Hirayama F, Arima H, Uekama K. 2000. Effects of aging on crystallization, dissolution and absorption characteristics of amorphous tolbutamide-2-hydroxypropyl-beta-cyclodextrin complex. Chem. Pharm. Bull 48(5):646–650. [DOI] [PubMed] [Google Scholar]
- Leuner C, Dressman J. 2000. Improving drug solubility for oral delivery using solid dispersions. Eur. J. Pharm. Biopharm 50(1):47–60. [DOI] [PubMed] [Google Scholar]
- Lindmark T, Nikkilӓ T, Artursson P. 1995. Mechanisms of absorption enhancement by medium chain fatty acids in intestinal epithelial Caco-2 cell monolayers. J. Pharmacol. Exp. Ther 275(2):958–964. [PubMed] [Google Scholar]
- Lo Y, Hsu C, Huang J. 1998. Comparison of effects of surfactants with other MDR reversing agents on intracellular uptake of epirubicin in Caco-2 cell line. Anticancer Res. 18(4C):3005–3009. [PubMed] [Google Scholar]
- Lundin PlDP, Bojrup M, Ljusberg-Wahren H, Westrom BrR, Lundin S. 1997. Enhancing effects of monohexanoin and two other medium-chain glyceride vehicles on intestinal absorption of desmopressin (dDAVP). J. Pharmacol. Exp. Ther 282(2):585–590. [PubMed] [Google Scholar]
- Miller JM, Beig A, Carr RA, Spence JK, Dahan A. 2012. A win-win solution in oral delivery of lipophilic drugs: supersaturation via amorphous solid dispersions increases apparent solubility without sacrifice of intestinal membrane permeability. Mol Pharmaceutics. 9(7):2009–2016. [DOI] [PubMed] [Google Scholar]
- Nerurkar MM, Burton PS, Borchardt RT. 1996. The use of surfactants to enhance the permeability of peptides through caco-2 cells by inhibition of an apically polarized efflux system. Pharm. Res 13(4):528–534. [DOI] [PubMed] [Google Scholar]
- Neslihan Gursoy R, Benita S. 2004. Self-emulsifying drug delivery systems (SEDDS) for improved oral delivery of lipophilic drugs. Biomed. Pharmacother 58(3):173–182. [DOI] [PubMed] [Google Scholar]
- Nilsen A, LaCrue AN, White KL, Forquer IP, Cross RM, Marfurt J, Mather MW, Delves MJ, Shackleford DM, Saenz FE et al. 2013. Quinolone-3-Diarylethers: A new class of antimalarial drug. Sci. Transl. Med 5(177):177ra137–177ra137. [DOI] [PMC free article] [PubMed] [Google Scholar]
- Nilsen A, Miley GP, Forquer IP, Mather MW, Katneni K, Li Y, Pou S, Pershing AM, Stickles AM, Ryan E et al. 2014. Discovery, synthesis, and optimization of antimalarial 4(1H)-quinolone-3-diarylethers. J Med Chem. 57(9):3818–3834. [DOI] [PMC free article] [PubMed] [Google Scholar]
- Okimoto K, Miyake M, Ibuki R, Yasumura M, Ohnishi N, Nakai T. 1997. Dissolution mechanism and rate of solid dispersion particles of nilvadipine with hydroxypropylmethylcellulose. Int. J. Pharm 159(1):85–93. [Google Scholar]
- Ozaki S, Minamisono T, Yamashita T, Kato T, Kushida I. 2012. Supersaturation-nucleation behavior of poorly soluble drugs and its impact on the oral absorption of drugs in thermodynamically high-energy forms. J Pharm Sci. 101(1):214–222. [DOI] [PubMed] [Google Scholar]
- Patel AR, Vavia PR. 2007. Preparation and in vivo evaluation of SMEDDS (self-microemulsifying drug delivery system) containing fenofibrate. The AAPS Journal. 9(3):E344–E352. [DOI] [PMC free article] [PubMed] [Google Scholar]
- Patel J, Patel A, Raval M, Sheth N. 2011. Formulation and development of a self-nanoemulsifying drug delivery system of irbesartan. J Adv Pharm Technol Res. 2(1):9–16. [DOI] [PMC free article] [PubMed] [Google Scholar]
- Porter CJ, Trevaskis NL, Charman WN. 2007. Lipids and lipid-based formulations: optimizing the oral delivery of lipophilic drugs. Nat. Rev. Drug Discov 6(3):231–48. [DOI] [PubMed] [Google Scholar]
- Pouton CW. 1997. Formulation of self-emulsifying drug delivery systems. Adv. Drug Deliv. Rev 25(1): 47–58 [Google Scholar]
- Pouton CW. 2000. Lipid formulations for oral administration of drugs: non-emulsifying, self-emulsifying and self-microemulsifying drug delivery systems. Eur J Pharm Sci. 11:S93–S98. [DOI] [PubMed] [Google Scholar]
- Prabhu S, Ortega M, Ma C. 2005. Novel lipid-based formulations enhancing the in vitro dissolution and permeability characteristics of a poorly water-soluble model drug, piroxicam. Int. J. Pharm 301(1):209–216. [DOI] [PubMed] [Google Scholar]
- Scott Swenson E, Curatolo WJ. 1992. (C) Means to enhance penetration: (2) Intestinal permeability enhancement for proteins, peptides and other polar drugs: mechanisms and potential toxicity. Adv. Drug Deliv. Rev 8(1):39–92. [Google Scholar]
- Sha X, Yan G, Wu Y, Li J, Fang X. 2005. Effect of self-microemulsifying drug delivery systems containing Labrasol on tight junctions in Caco-2 cells. Eur J Pharm Sci. 24(5):477–486. [DOI] [PubMed] [Google Scholar]
- Singh A, Van den Mooter G. 2016. Spray drying formulation of amorphous solid dispersions. Adv. Drug Deliv. Rev 100:27–50. [DOI] [PubMed] [Google Scholar]
- Smith AJ, Kavuru P, Wojtas L, Zaworotko MJ, Shytle RD. 2011. Cocrystals of quercetin with improved solubility and oral bioavailability. Mol Pharmaceutics. 8(5):1867–1876. [DOI] [PubMed] [Google Scholar]
- Surikutchi BT, Patil SP, Shete G, Patel S, Bansal AK. 2013. Drug-excipient behavior in polymeric amorphous solid dispersions. Journal of Excipients and Food Chemicals. 4(3):70–74. [Google Scholar]
- Tarr BD, Yalkowsky SH. 1989. Enhanced intestinal absorption of cyclosporine in rats through the reduction of emulsion droplet size. Pharm Res. 6(1):40–43. [DOI] [PubMed] [Google Scholar]
- Van Duong T, Van den Mooter G. 2016. The role of the carrier in the formulation of pharmaceutical solid dispersions. Part II: amorphous carriers. Expert Opin. Drug Deliv 13(12):1681–1694. [DOI] [PubMed] [Google Scholar]
- Vasconcelos Tf, Sarmento B, Costa P. 2007. Solid dispersions as strategy to improve oral bioavailability of poor water soluble drugs. Drug Discov. Today 12(23):1068–1075. [DOI] [PubMed] [Google Scholar]
- Veiga MaD, Diaz PJ, Ahsan F 1998. Interactions of griseofulvin with cyclodextrins in solid binary systems. J Pharm Sci. 87(7):891–900. [DOI] [PubMed] [Google Scholar]
- White NJ. 2008. Qinghaosu (Artemisinin): The price of success. Science. 320(5874):330–334. [DOI] [PubMed] [Google Scholar]
- Winter R, Kelly JX, Smilkstein MJ, Hinrichs D, Koop DR, Riscoe MK. 2011. Optimization of endochin-like quinolones for antimalarial activity. Exp. Parasitol 127(2):545–551. [DOI] [PMC free article] [PubMed] [Google Scholar]
- World Health Organization. 2018. World malaria report.
- Yalkowsky SH, Rubino JT. 1985. Solubilization by cosolvents I: organic solutes in propylene glycol-water mixtures. J Pharm Sci. 74(4):416–421. [DOI] [PubMed] [Google Scholar]
- Yamashita K, Nakate T, Okimoto K, Ohike A, Tokunaga Y, Ibuki R, Higaki K, Kimura T. 2003. Establishment of new preparation method for solid dispersion formulation of tacrolimus. Int. J. Pharm 267(1):79–91. [DOI] [PubMed] [Google Scholar]
- Yu L, Bridgers A, Polli J, Vickers A, Long S, Roy A, Winnike R, Coffin M. 1999. Vitamin E-TPGS increases absorption flux of an HIV protease inhibitor by enhancing its solubility and permeability. Pharm Res. 16(12):1812–1817. [DOI] [PubMed] [Google Scholar]


