

Abstract
Background:
Given the fact that the carpal tunnel syndrome (CTS) happens as a consequence of the median nerve entrapment, besides other known factors, the shape and anthropometric characteristics of the carpal tunnel, wrist, and hand could be considered as a predisposing risk factor for idiopathic CTS. The aim of this study was to evaluate the morphology and radiologic scales in CTS hands.
Methods:
In this prospective study, patients who underwent upper extremity electrodiagnostic studies were enrolled for hand morphologic and radiographic indexes. Patients were divided into CTS suffering and CTS symptom-free groups according to nerve conduction velocity (NCV) findings. A true posteroanterior radiograph of the hands was pas performed for each participant. Metacarpal length to wrist length index (carpal ratio), metacarpal length to metacarpal width index, third to first metacarpal length, hand length index, and hand volume index were measured in both groups.
Results:
Significant differences were seen between the two groups regarding the body mass index (P< 0.001), metacarpal length divided by metacarpal width index (P=0.08), first metacarpal length divided by third metacarpal length (P=0.002), wrist circumference divided by distal flexor wrist crease to the tip of the third finger (P< 0.001), distal flexor wrist crease to the tip of the third finger divided by hand volume (P=0.05), and distal flexor wrist crease to the tip of the third finger divided by wrist circumference (P< 0.001). Multivariable analysis of hand indices were statically significant for the first metacarpal length divided by third metacarpal length (P=0.00), wrist circumference divided by distal flexor wrist crease to the tip of the third finger (P=0.138), and distal flexor wrist crease to the tip of the third finger divided by wrist circumference (P=0.117). However, first metacarpal length divided by third metacarpal length and third metacarpal length divided by palm height were associated with higher CTS occurrences. Receiver operating characteristic curve analysis demonstrated cutoff points which were possible to estimate only for first metacarpal length divided by third metacarpal length and wrist circumference divided by distal flexor wrist crease to the tip of the third finger.
Conclusion:
Based on our findings, CTS hand is characterized by shorter fingers compared to thumb and wrist (metacarpal length to wrist length and hand length indexes), wider (metacarpal length to metacarpal width index), and bulkier (hand volume index) compared to non-CTS hands. The severity of CTS was correlated with a higher carpal ratio. In conclusion, CTS hands are bulkier with wider palms and shorter fingers compared to thumb. In this study, the thumb to the third metacarpal length was proved to be the best index for diagnosis of “CTS hand”.
Key Words: Carpal tunnel syndrome, Electrodiagnostic studies, EMG- NCV, Hand shape, Radiological
Introduction
Background
Carpal tunnel syndrome (CTS) is a peripheral neuropathy and considered as one of the most common hand disorders with a prevalence of 2.7% and mostly in women (1). A variety of clinical signs and symptoms can be used for diagnosis of carpal tunnel syndrome including tingling and numbness of fingers, wrist pain, and its special hand diagram (2, 3). In case the diagnosis fails through typical analysis of the signs and symptoms, further assessments such as nerve conduction studies or even imaging assessments are necessary (4). Furthermore, CTS has been known as a multifactorial disorder and several studies have discussed multiple factors such as age, sex, and body mass index (BMI) which may affect CTS; however, there are few studies that consider the hand shape as a risk factor (4, 5). Since CTS happens secondary to entrapment of the median nerve in the closed bony and soft tissue chamber of the carpal tunnel, the shape and anthropometric characteristics of the carpal tunnel, wrist, and hand can be considered as predisposing risk factors for idiopathic CTS.
Rationale
Retrospective review of the referred cases of hand and upper extremity reveals that most of the patients with idiopathic CTS refer to the clinic with small bulky hands with short fingers. We seldom encounter to an idiopathic CTS with long fingers and a slim hand. Some studies try to find the morphologic characteristics of “CTS Hand”. They found the “CTS Hands” to have wide palms and short fingers. However, most of the studies focus on the association between the hand and wrist morphologies in CTS using apparent characteristics (1, 6-9). However, to the best of the authors’ knowledge, a study that demonstrates this association through hand radiographic indices has not been conducted. Moreover, studies on the severity of the CTS and anthropometric and radiographic characteristic are rare (5, 10, 11).
Study Questions
The purpose of this study was to clarify the morphologic and radiologic differences between CTS and control groups. Our secondary questions included the differences between sensory negative and positive groups regarding hand morphology and radiologic scales and the relationships between hand and wrist morphologic and radiologic indices and nerve conduction velocity (NCV) studies in patients suffering from CTS. At the end, the study tries to find a cutoff point between two groups among the assessed indexes.
Materials and Methods
Study set up
In this prospective study, patients who underwent upper extremity electrodiagnostic studies at our referral hospital were subjected to evaluation of hand morphologic and radiographic indexes. The study was approved by the institutional review board and all patients signed an informed consent before enrolling in the study.
Electro diagnostic considerations
Electro diagnostic testing was performed for all patients to determine the severity of the disease and exclude conditions in the differential diagnosis. Standard nerve conduction studies (NCSs) that were used in the evaluation of patients include median and ulnar NCSs and opponens pollicis (OP) muscle electromyography (EMG). In this study, we considered normal EMG or NCV studies as negative result and abnormal studies as positive results.
Median sensory study
For median sensory study, the electrode which was placed on the index finger recorded the stimulation of median nerve at wrist (12). If the sensory distal latency (SDL) was more than 3.5 ms, the median sensory study was marked as abnormal (+ sensory) (12).
Median motor study
After attaching the recording electrode over the abductor pollicis brevis muscle, the median nerve was stimulated at the wrist and antecubital fossa. By this stimulation, electrical shock passed along the median nerve to change nerve conduction speed. Normal nerve conduction velocity was evaluated based on a normal nerve speed, so, if the NCV was slower than what was expected, it was considers as abnormal NCV (12, 13). If the distal motor latency was longer than 4.2 ms and the nerve conduction velocity was less than 49 m/s, it was considered as an abnormal median motor study (motor +) (12).
In our study all patients were adults aged between 18 to 65 years-old. Patients with clinical manifestation of CTS (2-31) but without confirmation in electrodiagnostic studies were excluded (2-30). All patients with a history of hand or wrist surgery, any type of polyneuropathy and, the onset of symptoms during pregnancy were also excluded. In the second step, patients with documented CTS according to severity were divided into two groups based on sensory NCV (sensory+, sensory -).
After electrodiagnostic studies, a true posteroanterior radiography was performed for patients who met the inclusion criteria. The hand radiologic indices including metacarpal length to wrist length index (third metacarpal length divided by the carpal height), metacarpal length to metacarpal width index (third metacarpal length divided by the proximal metacarpal width) and wrist third to first metacarpal length were measured. In addition, hand anatomical indices such as hand volume and length index (hand length divided by the wrist circumflex) were measured.
Scales of measurement
Third metacarpal length: the length between the third metacarpophalangeal joint to the middle point of carpometacarpal space line [Figure 1, AB].
Figure 1.
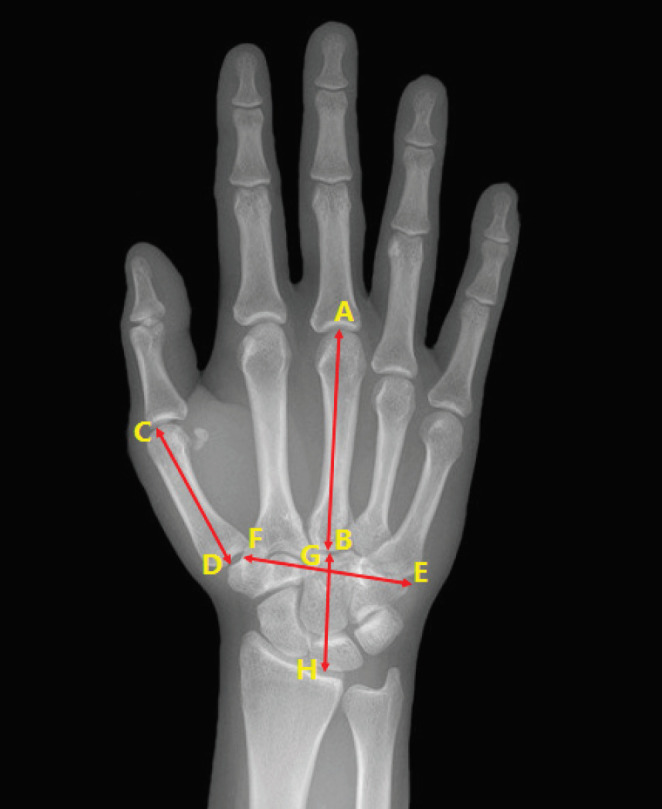
Scales using for measurement of the hand radiological indices: AB: Third metacarpal length: the length between the third metacarpophalangeal joint to the middle point of carpometacarpal space line. CD: First metacarpal length: the length between the first metacarpophalangeal joint to trapezium at the first carpometacarpal joint. GH: Wrist Height: the length between the base of third metacarpal and subchondral region of the distal radius along with third metacarpus axis. EF: Hand width: transverse distance between the bases of the second metacarpus to the fifth metacarpus. AB/GH: Metacarpal length to wrist length index (carpal ratio): measured as third metacarpal length divided by palm height. AB/EF: Metacarpal length to metacarpal width index: measured as third metacarpal length divided by palm width. AB/CD: Third to first metacarpal length: measured as third metacarpal length divided by first metacarpal length
First metacarpal length: the length between the first metacarpophalangeal joint to trapezium at the first carpometacarpal joint [Figure 1, CD].
Wrist Height: the length between the base of third metacarpal and subchondral region of the distal radius along with third metacarpus axis [Figure 1, GH].
Hand width: transverse distance between the bases of the second metacarpus to the fifth metacarpus [Figure 1, EF].
Metacarpal length to wrist length index (carpal ratio): measured as third metacarpal length divided by palm height [Figure 1, AB/GH].
Metacarpal length to metacarpal width index: measured as third metacarpal length divided by palm width [Figure 1, AB/EF].
Third to first metacarpal length: measured as third metacarpal length divided by first metacarpal length [Figure 1, AB/CD].
Hand length index: measured as palm height divided by wrist circumference.
Hand volume index: defined as hand volume to hand length.
Wrist circumference: this distance was measured using narrow cloth measuring tape around distal flexor wrist crease of the wrist.
Hand volume: Hand volume were measured using 30 x 20x 15 CM glass cube filled with water which was graded. The distal flexor wrist crease of the wrist was marked with water proof marker. The hand volume was defined as the water volume change in glass cube when the hand soaked until marker [Figuer 2].
Figure 2.

A: Graded cube used for measuring hand volume. B: Volume change showed after insertion of hand in water cube
Hand length: distance which measures the distal flexor wrist crease to the tip of the third finger while fingers were fully extended on a flat hard supporting surface [Figure 3, e].
Figure 3.
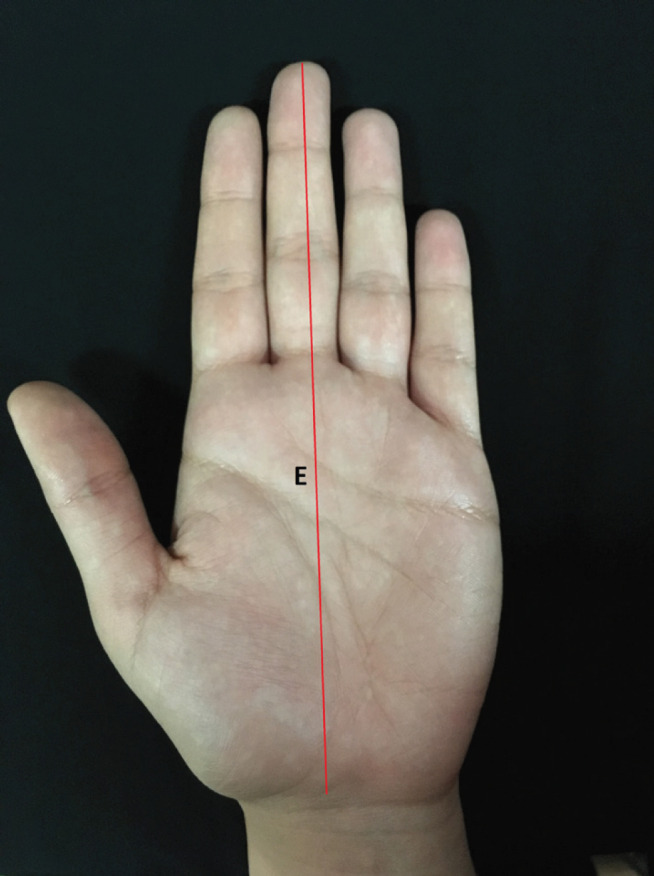
Hand length (e) measures while fingers are fully extended from the distal flexor wrist crease to the tip of the third finger
Population
Among 81 patients who were enrolled in this study 17 patients had clinical symptoms of CTS, but not enough electro diagnostic evidence documenting CTS. Demographic features of the participants and measured scales are shown in Table 1 . Nine (11.1%) patients were male and 72 (88.9%) were female with the mean age of 47.1 ± 12.7. According to NCV results, 46.9% of the participants had normal NCV studies and 53.1 % had CTS (34.6% right hand, 29.6% left hand, and 5.09% both hands). Demographic features in both groups did not differ except in BMI [ Table 2 ].
Table 1.
Demographic characteristic of all participants (n=81)
| Age(mean, SD) | 47.1 (12.7) | |
| Gender (N,%) | Male | 9 (11.1) |
| Female | 72 (88.9) | |
| Affected side | Right | 28 (34.6) |
| Left | 24 (29.6) | |
| Both | 29 (35.8) | |
| Education (mean, SD) | 9.43 (5.09) | |
| Job (N,%) | Housewife | 44 (54.3) |
| Retired | 3 (3.70) | |
| Business | 13 (16) | |
| Employee | 14 (17.3) | |
| Others | 7 (8.60) | |
| Carpal Tunnel Syndrome (N,%) | Yes | 43 (53.1) |
| No | 38 (46.9) | |
| BMI (mean, SD) | 26.1 (5.41) | |
| Grip (mean, SD) | 16.2 (8.09) | |
| Pinch (mean, SD) | 4.44 (1.79) | |
| Third metacarpal length (AB)(mean, SD) | 5.52 (0.844) | |
| First metacarpal length (CD) (mean, SD) | 3.94 (0.624) | |
| Carpal Height (GH) (mean, SD) | 2.70 (0.450) | |
| Metacarpal width (EF) (mean, SD) | 4.37 (0.714) | |
| Hand length(mean, SD) | 15.8 (2.62) | |
| Distal flexor wrist crease to the tip of the third finger (E) (mean, SD) | 17.8 (1.31) | |
| Wrist Circumference (mean, SD) | 16.8 (1.23) | |
| Hand volume (mean, SD) | 309 (63.1) | |
| AB/GH (mean, SD)* | 2.05 (0.172) | |
| AB/EF (mean, SD)** | 1.27 (0.083) | |
| CD/AB (mean, SD)*** | 0.714 (0.044) | |
| W/E (mean, SD)**** | 0.944 (0.065) | |
| E/V (mean, SD)***** | 0.060 (0.010) | |
| E/WC (mean, SD)****** | 1.06 (0.074) | |
*Metacarpal length divided by wrist length index
*** First metacarpal length divided by third metacarpal length
****Wrist circumference divided by distal flexor wrist crease to the tip of the third finger
***** Distal flexor wrist crease to the tip of the third finger divided by hand volume
******Distal flexor wrist crease to the tip of the third finger divided by wrist circumference
Table 2.
Bivariate analysis of demographic characteristic and hand indices in patients with CTS and control’s groups
| Variable | Patients (n=43 ) | Control (n=38 ) | P-value | |
|---|---|---|---|---|
| Age(mean, SD) | 48.1 (11.1) | 46.0 (14.4) | 0/453 | |
| Gender (N,%) | Male | 4 (9.3) | 5 (13.2) | 0/582 |
| Female | 39 (90.7) | 33 (86.8) | ||
| BMI (mean, SD) | 28.9 (5.04) | 22.9 (3.80) | < 0.001 | |
| Grip (mean, SD) | 15.8 (7.98) | 16.7 (8.29) | 0/594 | |
| Pinch (mean, SD) | 4.38 (1.90) | 4.51 (1.68) | 0/739 | |
| AB/GH (mean, SD)* | 2.03 (0.161) | 2.07 (0.183) | 0/329 | |
| AB/EF (mean, SD)** | 1.24 (0.088) | 1.29 (0.070) | 0/008 | |
| CD/AB (mean, SD)*** | 0.728 (0.042) | 0.698 (0.040) | 0/002 | |
| W/E (mean, SD)**** | 0.976 (0.050) | 0.907 (0.060) | < 0.001 | |
| E/V (mean, SD)***** | 0.057 (0.008) | 0.063 (0.010) | 0/005 | |
| E/WC (mean, SD)****** | 1.02 (0.052) | 1.11 (0.072) | < 0.001 | |
| Duration of symptoms (Days) (mean, SD) | 619 (884) | 306 (514) | 0/012 | |
*Metacarpal length divided by wrist length index
** Metacarpal length divided by metacarpal width index
*** First metacarpal length divided by third metacarpal length
****Wrist circumference divided by distal flexor wrist crease to the tip of the third finger
***** Distal flexor wrist crease to the tip of the third finger divided by hand volume
******Distal flexor wrist crease to the tip of the third finger divided by wrist circumference
Statistics
SPSS version 16.0 (Chicago, IL) was used for statistical analysis. In the first step, a bivariate analysis between the patients with documented CTS and those who suffered from any upper extremity conditions was performed regarding the hand indices. Student’s t-test and Exact Fisher’s test were used for quantitative and qualitative variables respectively. After dividing the patients with CTS into two groups according to NCV sensory response (sensory+, sensory -), a bivariate analysis was performed to reveal the severity of CTS. Finally, the correlations between electro diagnostic tests and hand indices were estimated. In this study P<0.05 was considered as statistically significant.
Furthermore, receiver operating characteristic (ROC) curve was used to estimate optimal cutoff points for our indices. The ROC curve which can be used to measure optimal cutoff points can be affected by changes in sensitivity and specificity (14). In the above-mentioned analysis, there is also a specific area that is important for distinguishing the classification accuracy of the indices which are called the area under the ROC curve (AUC) (14). The optimal cutoff point was estimated with regard to the highest possible logical specificity and sensitivity.
Results
The results of bivariate analysis of demographic characteristics and hand indices between patients who suffered from CTS and normal participants are shown on Table 2. There were significant differences between two groups regarding to BMI, AB/EF (Metacarpal length divided by metacarpal width index), CD/AB (First metacarpal length divided by third metacarpal length), W/E (Wrist circumference divided by distal flexor wrist crease to the tip of the third finger), E/V (Distal flexor wrist crease to the tip of the third finger divided by hand volume), and E/WC (Distal flexor wrist crease to the tip of the third finger divided by wrist circumference).
Multivariable analysis of hand indices were statically significant for CD/AB, WE and EWE; however, in terms of odd ratio, CD/AB with OR=1.37 and AB/GH with OR=12.2 were associated with higher CTS occurrences [Table 3].
Table 3.
Bivariate analysis of hand scales and indices in patients with or without positive NCV test
| CTS | Mean | Std. Deviation | P value | |
|---|---|---|---|---|
| AB/GH* | Sensory + | 2/02 | 0/164 | 0/559 |
| Sensory - | 2/05 | 0/16 | ||
| AB/EF** | Sensory + | 1/26 | 0/085 | 0/167 |
| Sensory - | 1/23 | 0/089 | ||
| CD/AB*** | Sensory + | 0/72 | 0/025 | 0/139 |
| Sensory - | 0/74 | 0/053 | ||
| W/E**** |
Sensory + | 0/97 | 0/044 | 0/222 |
| Sensory - | 0/99 | 0/056 | ||
| E/WE***** | Sensory + | 1/04 | 0/046 | 0/243 |
| Sensory - | 1/02 | 0/057 | ||
| 0/818 | ||||
| Grip | Sensory + | 16 | 7/68 | |
| Sensory - | 15/5 | 8/47 | ||
| Pinch | Sensory + | 4/24 | 1/76 | 0/628 |
| Sensory - | 4/52 | 2/07 | ||
| BMI | Sensory + | 28/2 | 4/89 | 0/343 |
| Sensory - | 29/7 | 5/2 | ||
*Metacarpal length divided by wrist length index
** Metacarpal length divided by metacarpal width index
*** First metacarpal length divided by third metacarpal length
****Wrist circumference divided by distal flexor wrist crease to the tip of the third finger
***** Distal flexor wrist crease to the tip of the third finger divided by hand volume
******Distal flexor wrist crease to the tip of the third finger divided by wrist circumference
After performing NCV test in CTS patients and according to the NCV test results, a bivariate analysis of wrist scales and indices between patients with or without positive NCV test was performed, but, no differences were found between the two groups [Table 4].
Table 4.
Multivariable Analysis of hand indices
| Wrist indices | Odd Ratio | Standard Error | P value | CI | |
|---|---|---|---|---|---|
| Lower | Upper | ||||
| AB/GH * | 12/2 | 2/46 | 0/308 | 0/099 | 1508/253 |
| AB/EF ** | 0/095 | 5/1 | 0/644 | < 0.001 | |
| CD/AB *** | 1/37E+13 | 10/9 | 0/005 | 7766/305 | 2/43E+22 |
| W/E **** | < 0.001 | 87/1 | 0/046 | < 0.001 | 0/032 |
| E/WE***** | < 0.001 | 79/4 | 0/03 | < 0.001 | < 0.001 |
| E/V****** | < 0.001 | 37/3 | 0/181 | < 0.001 | 12712496738 |
*Metacarpal length divided by wrist length index
** Metacarpal length divided by metacarpal width index
*** First metacarpal length divided by third metacarpal length
****Wrist circumference divided by distal flexor wrist crease to the tip of the third finger
***** Distal flexor wrist crease to the tip of the third finger divided by hand volume
******Distal flexor wrist crease to the tip of the third finger divided by wrist circumference
Spearman’s analysis revealed a significant relationship between the metacarpal length to wrist length index and across wrist sensory latency in the affected side. Also, significant relationship between metacarpal length to metacarpal width index and variables such as across wrist sensory latency, across wrist sensory NCV and across wrist motor latency in affected side had been measured [Table 5].
Table 5.
Correlation between hand indices and nerve conduction velocity (NCV) test’s results
| Wrist indices |
Across wrist sensory latency
(affected side) |
Across wrist sensory NCV (affected side) |
Across wrist motor latency
(affected side) |
|
|---|---|---|---|---|
| E/V | Correlation | 0/215 | 0/233 | 0/276 |
| P value | 0/423 | 0/384 | 0/3 | |
| AB/GH* | Correlation | 0/501 | 0/391 | 0/465 |
| P value | 0/048 | 0/135 | 0/07 | |
| AB/EF** | Correlation | 0/589 | 0/512 | 0/529 |
| P value | 0/016 | 0/043 | 0/035 | |
| CD/AB*** | Correlation | 0/096 | 0/211 | 0/093 |
| P value | 0/723 | 0/433 | 0/731 | |
| W/E**** | Correlation | 0/079 | 0/054 | 0/184 |
| P value | 0/771 | 0/844 | 0/494 | |
| E/WE***** | Correlation | 0/071 | 0/043 | 0/166 |
| P value | 0/793 | 0/874 | 0/538 | |
*Metacarpal length divided by wrist length index
** Metacarpal length divided by metacarpal width index
*** First metacarpal length divided by third metacarpal length
****Wrist circumference divided by distal flexor wrist crease to the tip of the third finger
***** Distal flexor wrist crease to the tip of the third finger divided by hand volume
******Distal flexor wrist crease to the tip of the third finger divided by wrist circumference
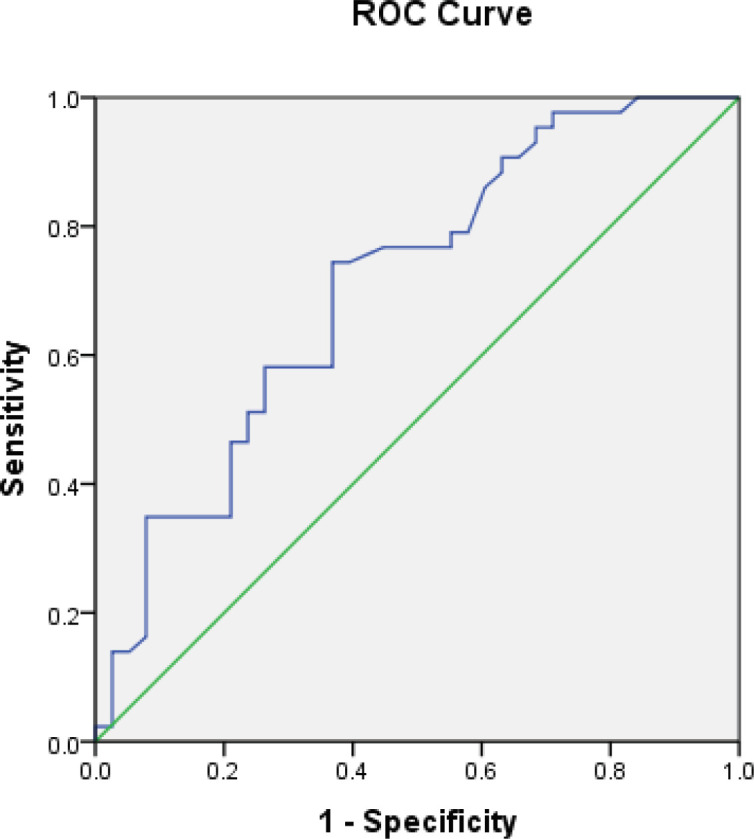
Moreover, ROC curve analysis demonstrated cutoff points which were possible to estimate only for CD/AB (First metacarpal length divided by third metacarpal length) and WE (Wrist circumference divided by distal flexor wrist crease to the tip of the third finger). The optimal cutoff point for CD/AB was 0.6969 with 76% and 50% sensitivity and specificity, respectively [Diagram 1]. In addition, the optimal cutoff point for WE was 0.9306 with 80% sensitivity and 70% specificity [Diagram 2].
Diagram 1.
The optimal cutoff point for CD/AB
Diagram 2.

the optimal cutoff point for WE
Discussion
Although various studies have clarified the association between the hand and wrist morphology and CTS, studies which demonstrate this association by using hand radiographic indices are rare [Table 6] (1, 6-9). In this study, we used hand radiography as a documented tool to calculate hand indices which may decrease the risk of measurement errors. The current study also revealed significant differences in hand radiographic indices between CTS and normal group.
Table 6.
Differences between our study and similar studies
| Reference | Authors | Patients | Significant | Not Significant | Correlate with severity of CTS | |
|---|---|---|---|---|---|---|
| Moghtaderi et al (2005) | 128 CTS, 109 Controls | BMI, Wrist ratio* | wrist circumference, Gender | (Mild, Moderate, Severe) no difference | _ | |
| MONDELLI et al (2015) | 370 CTS, 747 Controls | BMI, Wrist ratio, Hand ratio, Hand shape ratio, Digit index, Wrist to palm ratio, | Hand length-height ratio | _ | Could not find cut off between measurements and indexes | |
| Hlebs et al (2014) | 50 CTS, 50 Control | BMI, Wrist ratio, Hand ratio | Digit index, Ratio of hand length to body height | _ | In multivariable analysis: BMI, Wrist ratio, and Ratio of hand length to body height were significant | |
| FARMER and DAVIS (2008) | 50 CTS, 50 Control | wrist ratio | BMI, Hand ratio | _ | _ | |
| Cheroni et al (2001) | 50 CTS, 50 Control | Hand ratio, palm length, Palm width, Digit length | _ | _ | All were women | |
| STETSON et al (1992) | 105 healthy people | _ | _ | Index finger circumference was correlated with nerve conduction, but not wrist ratio and wrist circumference | _ | |
| Boz (2004) | 198 CTS, 194 Control | BMI, Wrist ratio (women), Hand shape index (women), Digit index (women) | Hand length-height ratio, wrist ratio (men), Hand shape index (men), Digit index(men) | _ | _ | |
The CTS hands were proved to have shorter fingers compared to thumb and wrist (metacarpal length to wrist length and hand length indexes), and wider (metacarpal length to metacarpal width index), and bulkier (hand volume index) compared to non-CTS hands [Figure 4]. The severity of the CTS was correlated with a higher carpal ratio.
Figure 4.

Normal hand (A) versus hand suffering from carpal tunnel syndrome (B): in the “CTS hand” the palm is wither, fingers are shorter, and the thumb seems longer compare to fingers
The present study had some limitations; however, efforts were made on the side of the researchers to minimize their effect. One of the limitations was the number of participants. The second limitation was the use of traditional devices for hand lengths and volume. Using three dimensional scans can provide more accurate data about the hand indexes and volume. Moreover, more different indexes could have been defined with three dimensional scans.
Discussion: Is there any difference between CTS group and control group regarding to hand morphology and radiologic scales?
CTS hands had shorter fingers compared to thumb and wrist length in radiographic evaluation. The researchers failed to find any similar study using the radiographic measurement for CTS anthropometric evaluation; However, several studies used simple hand measurements indicating same results (1, 6, 8, 9, 11, 15). Hand ratio (palm width to hand length length), and digit ratio (third digit length to hand length) were different in several studies among patients suffering from CTS with control group indicating that patients with idiopathic CTS have shorter fingers compared to palm (1, 6, 8, 11). Interestingly, shorter fingers are less obvious in men with CTS hand (8). Moreover, the results indicate that not only fingers are shorter compared to palm but also they are shorter compared to the thumb (first metacarpus third metacarpus ratio).
CTS hands are wider than normal hands. Except for one study other studies support the findings of the current study by using hand ratio (hand width to hand length) (1, 4, 6, 8, 11). .
According to this study, CTS hands are bulkier than non-CTS hands (Hand volume index). Other studies used wrist ratio (wrist depth to wrist length) as an indicator of hand volume which was constantly higher in index studies (1, 6, 8, 9, 15).
BMI was higher in patients suffering from CTS (1, 6, 8, 15).
Discussion: Is there any difference between sensory negative and positive groups regarding the hand morphology and radiologic scales?
The presence or absents of sensory response was used as the indicator of CTS severity and the patients with CTS were divided into two groups based on this criterion. No difference between the two groups was observed. Moghtaderi et al. divided the CTS hands to three groups (mild, moderate, and severe) based on the electrodiagnostic studies and could not find any difference (15).
Discussion: Is there any relation between hand and wrist morphologic and radiologic indices and nerve conduction velocity (NCV) studies in patients suffering from CTS?
In the present study, the severity of the CTS was correlated with higher carpal ratio; however, it did not differ between CTS and non-CTS hands. It seems that the carpal ratio can be used as an index of CTS severity and not as a risk factor for the existence of CTS disease. A study with 105 healthy median and ulnar nerves demonstrated that the index finger circumference was correlated with nerve conduction, but not with the wrist ratio and wrist circumference (5).
Discussion: what are the optimal cutoff points of indices which used in our study?
Among all of our used indices only CD/AB and WE had been able to demonstrate cutoff points. Furthermore, if the disease is prevalent, it will be beneficial to identify the sensitivity or specificity that illustrate the accuracy of a diagnostic test, so, the sensitivity and specificity of CTS were estimated which is one of the most prevalent disorders (6). If the area under the ROC curve (AUC) is closer to one, it means that the test is perfect for use (16). In this study, AUC for both indices were about 0.7 to 0.8 which demonstrated that these indices are good enough to be used.
According to our findings, CTS hands have different shape and radiologic criteria compared to normal hands. They are bulkier with wider palms and shorter fingers compared to the thumb. Having knowledge of the shape of CTS hand can help us be more accurate in the clinical diagnosis of CTS and help us interoperate the electro diagnostic studies better than before. At last, the thumb to third metacarpal length was found as the best index for diagnosis of “CTS hand”; its ratio of over 0.7 is an index of CTS.
References
- 1.Hlebs S, Majhenic K, Vidmar G. Body mass index and anthropometric characteristics of the hand as risk factors for carpal tunnel syndrome. Collegium antropologicum. 2014;38(1):219–26. [PubMed] [Google Scholar]
- 2.Sucher BM, Schreiber AL. Carpal tunnel syndrome diagnosis. Physical medicine and rehabilitation clinics of North America. 2014;25(2):229–47. doi: 10.1016/j.pmr.2014.01.004. [DOI] [PubMed] [Google Scholar]
- 3.Moradi A, Mellema JJ, Oflazoglu K, Isakov A, Ring D, Vranceanu A-M. The relationship between catastrophic thinking and hand diagram areas. The Journal of hand surgery. 2015;40(12):2440–6. doi: 10.1016/j.jhsa.2015.07.031. [DOI] [PubMed] [Google Scholar]
- 4.Ellis R, Blyth R, Arnold N, Miner-Williams Ph DW. Is there a relationship between impaired median nerve excursion and carpal tunnel syndrome? A systematic review. Journal of hand therapy : official journal of the American Society of Hand Therapists. 2016 doi: 10.1016/j.jht.2016.09.002. [DOI] [PubMed] [Google Scholar]
- 5.Stetson DS, Albers JW, Silverstein BA, Wolfe RA. Effects of age, sex, and anthropometric factors on nerve conduction measures. Muscle & nerve. 1992;15(10):1095–104. doi: 10.1002/mus.880151007. [DOI] [PubMed] [Google Scholar]
- 6.Mondelli M, Curti S, Farioli A, Aretini A, Ginanneschi F, Greco G, et al. Anthropometric measurements as a screening test for carpal tunnel syndrome: receiver operating characteristic curves and accuracy. Arthritis care & research. 2015;67(5):691–700. doi: 10.1002/acr.22465. [DOI] [PubMed] [Google Scholar]
- 7.Neral M, Winger D, Imbriglia J, Wollstein R. Hand Shape and Carpal Tunnel Syndrome. Current rheumatology reviews. 2016 [PubMed] [Google Scholar]
- 8.Boz C, Ozmenoglu M, Altunayoglu V, Velioglu S, Alioglu Z. Individual risk factors for carpal tunnel syndrome: an evaluation of body mass index, wrist index and hand anthropometric measurements. Clinical neurology and neurosurgery. 2004;106(4):294–9. doi: 10.1016/j.clineuro.2004.01.002. [DOI] [PubMed] [Google Scholar]
- 9.Farmer JE, Davis TR. Carpal tunnel syndrome: a case-control study evaluating its relationship with body mass index and hand and wrist measurements. The Journal of hand surgery, European volume. 2008;33(4):445–8. doi: 10.1177/1753193408090142. [DOI] [PubMed] [Google Scholar]
- 10.Mondelli M, Curti S, Mattioli S, Aretini A, Ginanneschi F, Greco G, et al. Associations Between Body Anthropometric Measures and Severity of Carpal Tunnel Syndrome. Archives of physical medicine and rehabilitation. 2016;97(9):1456–64. doi: 10.1016/j.apmr.2016.03.028. [DOI] [PubMed] [Google Scholar]
- 11.Chroni E, Paschalis C, Arvaniti C, Zotou K, Nikolakopoulou A, Papapetropoulos T. Carpal tunnel syndrome and hand configuration. Muscle & nerve. 2001;24(12):1607–11. doi: 10.1002/mus.1195. [DOI] [PubMed] [Google Scholar]
- 12.Basiri K, Katirji B. Practical approach to electrodiagnosis of the carpal tunnel syndrome: A review. Advanced biomedical research. 2015:4. doi: 10.4103/2277-9175.151552. [DOI] [PMC free article] [PubMed] [Google Scholar]
- 13.contributors W. Nerve conduction study Wikipedia, The Free Encyclopedia. ; [updated 1 December 2016 04:58 UTC. Available from: https://en.wikipedia.org/w/index.php?title=Nerve_conduction_study&oldid=752425534 .
- 14.Liu X. Classification accuracy and cut point selection. Statistics in medicine. 2012;31(23):2676–86. doi: 10.1002/sim.4509. [DOI] [PubMed] [Google Scholar]
- 15.Moghtaderi A, Izadi S, Sharafadinzadeh N. Hand length An evaluation of gender, body mass index, wrist circumference and wrist ratio as independent risk factors for carpal tunnel syndrome. Acta neurologica Scandinavica. 2005;112(6):375–9. doi: 10.1111/j.1600-0404.2005.00528.x. [DOI] [PubMed] [Google Scholar]
- 16.Akobeng AK. Understanding diagnostic tests 3: Receiver operating characteristic curves. Acta paediatrica (Oslo, Norway :1992) 2007;96(5):644–7. doi: 10.1111/j.1651-2227.2006.00178.x. [DOI] [PubMed] [Google Scholar]