Abstract.
Purpose: Deep convolutional neural networks (CNN) have demonstrated impressive success in various image classification tasks. We investigated the use of CNNs to distinguish between benign and malignant microcalcifications, using either conventional or dual-energy mammography x-ray images. The two kinds of calcifications, known as type-I (calcium oxalate crystals) and type-II (calcium phosphate aggregations), have different attenuation properties in the mammographic energy range. However, variations in microcalcification shape, size, and density as well as compressed breast thickness and breast tissue background make this a challenging discrimination task for the human visual system.
Approach: Simulations (conventional and dual-energy mammography) and phantom experiments (conventional mammography only) were conducted using the range of breast thicknesses and randomly shaped microcalcifications. The off-the-shelf Resnet-18 CNN was trained on the regions of interest with calcification clusters of the two kinds.
Results: Both Monte Carlo simulations and experimental phantom data suggest that deep neural networks can be trained to separate the two classes of calcifications with high accuracy, using dual-energy mammograms.
Conclusions: Our work shows the encouraging results of using the CNNs for non-invasive testing for type-I and type-II microcalcifications and may stimulate further research in this area with expanding presence of the novel breast imaging modalities like dual-energy mammography or systems using photon-counting detectors.
Keywords: convolutional neural network, type-I and type-II microcalcifications, anthropomorphic breast phantom, dual-energy mammography
1. Introduction
The presence of clustered microcalcifications in the breast can be an early sign of in situ breast cancer, making up to 34% of all newly diagnosed breast cancers detected in mammography.1 However, many benign breast lesions also exhibit clustered microcalcifications. It has been reported that to 85% of all microcalcification clusters observed in a screening population are benign.2
Differentiating malignant from benign microcalcification lesions can be a challenging task owing to similarities in appearance. Radiologists typically analyze both the spatial distributions of microcalcifications within the cluster as well as the shape of individual microcalcifications to help in making a diagnosis. However, these features alone cannot be solely used to accurately distinguish between malignant and benign calcified lesions. Core biopsy followed by histopathological work-up is often required to establish a definitive diagnosis. Generally, radiologist performance in differentiating malignant and benign microcalcifications is suboptimal. For example, Veldkamp et al.3 conducted a retrospective study analyzing performance of nine radiologist observers reading 280 biopsy proved microcalcification clusters (145 malignant) and reported area under the receiver operator characteristic (ROC) curve of 0.64. Another retrospective study by Jiang et al.4 analyzed performance of 10 radiologists reading 104 histologically verified cases of microcalcifications and reported area under the ROC curve of 0.61. The implications of this suboptimal performance in differentiating malignant and benign microcalcification clusters are many unnecessary tissue biopsies that are performed causing undue patient anxiety and increased healthcare costs.
Frappart et al.5 reported that there are two major types of microcalcifications found within breast tissue. Type-I microcalcifications consist of calcium oxalate (CO) crystals , whereas type-II microcalcifications consist of calcium phosphates , predominantly hydroxyapatite (HA). Type-I microcalcifications are only lightly stained in histologic tissue sections (and thus often not seen) and are observed most frequently in benign ductal lesions not associated with breast cancer. Type-II microcalcifications, the more common type, appear as dark blue deposits in histologic tissue sections and are found in both benign and malignant lesions, but most often in infiltrating and intraductal carcinoma. It has been suggested5–8 that type-II microcalcifications are the result of cellular degeneration or necrosis and type-I microcalcifications are a production of secretions.
Truong et al.9 reported that 12% of a 91 patient cohort studied had benign biopsies based on mammographic observation of CO microcalcifications. This observation has provided motivation for investigating whether it would be possible to differentiate HA and CO microcalcifications using non-invasive imaging methods with the hope of conservatively managing some patients with calcified lesions using serial mammography and avoiding the risks and patient anxiety associated with breast biopsy. Wang et al.10 reported on a non-invasive method for classifying microcalcification-based lesions using phase-contrast x-ray mammography. Using simple experimental phantoms with large crystalline samples of HA and CO, this group reported 100% sensitivity and specificity in classifying the two chemical sample types. Ghammraoui and Glick11 recently reported on the use of energy dispersive x-ray coherent scatter computed tomography for differentiation of type-I and type-II microcalcifications. Both phase-contrast and x-ray coherent scattering are promising methods for classifying microcalcifications, however, these imaging modalities are not currently available for routine clinical use.
Other studies have investigated classification of microcalcification type using dual-energy mammography and spectral mammography with photon counting detectors.11–14 These investigations used simulations and experimental phantom acquisitions to process multiple energy windows with the goal of classifying microcalcifications. Analytical classification algorithms were used and although excellent performance was reported, a number of modeling approximations were made to simplify the problem. In Ref. 14, pure HA and CO were mixed with deionized water filling a relatively large cylindrical tube (2-cm diameter). These cylindrical tubes with different chemicals were then imaged within a rectangular shaped tank filled with water. Microcalcifications typically found within the breast are considerably smaller in size; typically with varying non-spherical shapes. Furthermore, to accurately test the proposed algorithm, it is important to model classification performance using a structured background modeling realistic parenchymal tissue rather than using a uniform water background. Another limitation in some of the reported studies13,14 was that calcifications were modeled as pure HA and CO. As reported by Warren et al.,15 pure HA is much more attenuating than that observed in clinical microcalcifications. The density of solid HA is significantly higher than the density of HA in clinical microcalcifications. Thus classifying microcalcifications that are modeled as pure HA and pure CO is a much simpler problem and results are unlikely to translate to clinical performance.
Ghammraoui and Glick11 and Ghammraoui et al.12 used a more accurate model for the photon attenuation of HA and CO, assuming similar densities of both materials and analyzed performance with both photon counting spectral mammography and dual-energy mammography. These studies modeled the line-integral through a single calcification and uniform background consisting of 50% adipose and 50% fibroglandular tissue of varying breast thickness. Performance in classifying the two materials was moderate when analyzing a single microcalcification but greatly improved when averaging performance over five separate microcalcifications.
The study presented here uses a more realistic imaging model of single- and dual-energy mammography and classifies microcalcification type using a specifically trained convolution neural network (CNN). Both simulation and experimental studies are acquired with anthropomorphic breast phantoms of different compressed breast thicknesses and a random number of randomly positioned non-spherical microcalcifications within each cluster. Simulated mammograms for training and testing were generated using a GPU-based Monte Carlo (MC) simulation software to create a large number of region-of-interest (ROI) images with microcalcification clusters. Experimental acquisitions were acquired using a Hologic Selenia Dimensions 3D mammography system with custom fabricated HA and CO microcalcification clusters inserted into inkjet-printed 3D anthropomorphic breast phantoms of varying thickness.
Two important parameters in the model are the mass densities for the two types of calcifications. The literature provides little data on experimentally measured microcalcification density (of either type) from biopsied tissue samples. Solid CO and HA have mass densities and , respectively. As was pointed out earlier, Warren et al.15 argued that pure HA microcalcifications would result in considerably higher contrast than is typically observed in mammograms. They reported a factor of 0.84 to correct for the difference in x-ray attenuation of pure CO and imaged microcalcifications in mastectomy specimens. Accounting for this in the simulation part of this study, CO and HA calcifications were conservatively modeled to be of the same mass density . For the experimental acquisitions, the measured densities of synthetically fabricated calcifications were and . The small difference between the two compositions was due to the physical constraints in the process of mechanically compressing the synthetic calcification tablets.
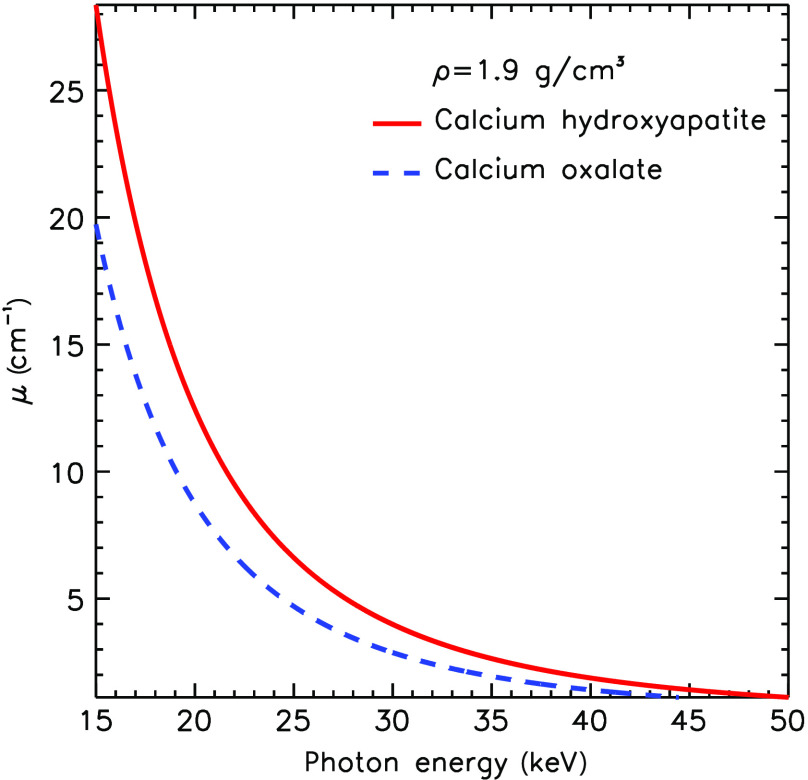
We believe this choice represents a reasonable starting point since no other data exists in the literature on density of real calcifications of either type. Assigning both calcification types to have similar density is a conservative estimate, likely making the classification task in this study more difficult than it would be in clinical use. Figure 1 illustrates the difference between in the linear attenuation coefficient for the two chemical compositions of the same density in the mammographic range of energies.
Fig. 1.
Linear attenuation coefficient for CO and HA of the same density.
In Sec. 2, we describe the MC and experimental study designs as well as the neural network architecture, its training, and testing conditions. Section 3 summarizes our main findings in terms of ROC curves and corresponding area under the curve (AUC) values. Discussion of these results and the list of limitations of the study are provided in Sec. 4. We sum up and conclude our results in Sec. 5.
2. Methods
2.1. MC-GPU Software
Monte Carlo simulation of radiographic images using graphics processing units (MC-GPU) mammography and breast tomosynthesis x-ray transport code16 was used for simulating a full-field digital mammography (FFDM) system. The software models the entire x-ray imaging process chain, including a finite size x-ray focal spot, a multi-energetic x-ray spectra emitted within a cone beam shaped by a collimator, an anti-scatter grid, and an a-Se direct-conversion detector. The simulation settings were assigned to model the Siemens Mammomat 2D/3D clinical mammography system. The MC-GPU can work with any input spectrum/filter combinations and high-resolution voxelized breast phantoms representing patient anatomy. Interaction cross section for photoelectric absorption and elastic and inelastic scattering is incorporated within the model and tabulated for many relevant materials, including microcalcifications and masses. The software is highly parallelizable and scales well on multiple graphics processing units. As an output, MC-GPU produces a grayscale x-ray FFDM image and allows for accurate estimates of dose deposited in different tissue types.
2.2. Digital Breast Phantom with Embedded Calcifications
A procedural analytic model developed by Graff17 was used to produce a population of anthropomorphic digital breast phantoms compressed to 30, 40, 50, 60, and 70 mm. Graff’s method creates an uncompressed breast first and then performs 3D finite-element computations to deform it into a desired thickness, as shown in Fig. 2(a). Heterogeneous breast models with 30% fibroglandular and 70% adipose tissue composition were used throughout. Each voxelized phantom had resolution in all dimensions. Two sets of 25 phantom realizations of each thickness were generated for a total of different phantoms. Each 125-phantom set was then populated with HA or CO calcification clusters. Depending on a compression thickness, 38 to 50 random clusters were embedded in a central slice of each phantom to maximize the number of non-overlapping signal ROIs’, as illustrated in Fig. 2(b). The number of calcifications per cluster varied from 5 to 15. Microcalcification particles were modeled as ellipsoids with semiaxes of random lengths matching the volumes of the spheres varying between and 1-mm in diameter. In order to make calcification shapes less regular an arbitrary fraction (15% to 50%) of the number of random voxels making up an ellipsoid were removed from (and added to) its surface. A simulated FFDM projection of the compressed breast with signal clusters is shown in Fig. 2(c). All in all, a total of unique ROIs with CO and HA clusters were modeled.
Fig. 2.
Simulated conventional FFDM projections of the 4-cm-thick breast phantom with calcification clusters of both types: (a) Graff’s digital FE-compressed breast model; (b) central slice of numerical phantom with embedded calcification clusters; and (c) simulated FFDM projection of a compressed breast phantom.
2.3. Experimental 2D-Printed Breast Phantom and Calcification Templates
A physical anthropomorphic breast phantom, as described by Ikejimba et al.,18 was used for the measurements on a clinical FFDM system Hologic Selenia Dimensions. X-ray contrast is achieved by using parchment paper, which mimics adipose tissue, with fibroglandular tissue represented by 2D inkjet-printed patterns of iodine-doped dye. A 4 cm thick phantom is a 571–sheet stack held together by two 6 mm polymethyl methacrylate (PMMA) plates, as shown in Fig. 3(a). Each -thick sheet of paper represents a single slice in silico. Two posts keep the sheets aligned. Phantoms of smaller thicknesses can be obtained by removing sheets from the stack. For calcification signals, an x-ray transparent “insert” was designed. Figure 3(b) shows such an insert with a array of calcification clusters and of a set of gold-printed fiducial markers along the periphery. Like in the MC experiment, each cluster contained a random number of calcifications of different sizes, varying from 5 to 15 per cluster. The production steps for fabrication of calcifications include using raw CO and HA commercial powder, mixing it with a small amount of binding substance, creating the tablets by applying mechanical pressure, and using a mortar and a pestle to crush the tablets into the specks. This procedure was previously described by Ghammraoui et. al.12 CO and HA particles, used in the inserts, were then sifted using differential sieving to isolate all particles with size ranging approximately from 200 to . The fabricated tablets were measured to have density and . A 5.55% difference was unintentional and resulted from mechanical constraints when using the tableting machine. It is unknown if these density values were retained for individuals particles, after the tablets were crushed with a mortar and a pestle. Figure 3(c) demonstrates an example FFDM image of the paper breast phantom with the calcification signal template inserted.
Fig. 3.
Breast phantom, template with microcalcification clusters, FFDM image: (a) parchment paper breast phantom; (b) insert with calcification clusters; and (c) Hologic Selenia Dimensions FFDM image of the phantom with CO signal clusters.
2.4. Monte-Carlo Experiment Design: Conventional and Dual-Energy FFDM
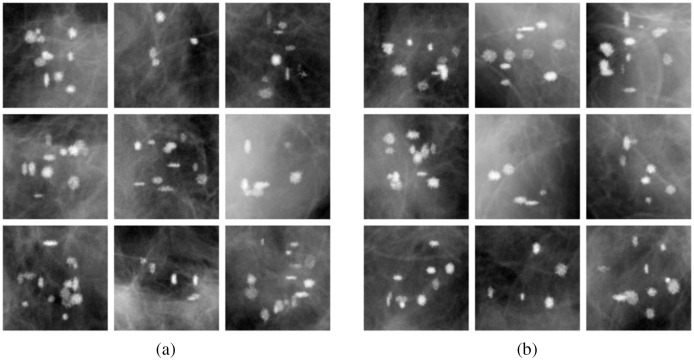
Two experiments were carried out using MC-GPU, modeling conventional single-energy and dual-energy FFDM. Table 1 summarizes the main acquisition parameters used. Compressed breast phantoms of five thicknesses of 30, 40, 50, 60, and 70 mm were imaged. For conventional mammography, simulations used a standard W-Rh x-ray spectrum with fixed x-ray tube voltage of 30 kVp, with the number of generated photons adjusted to maintain the average glandular dose (AGD) to be . For dual-energy simulations, parameters that were found to be optimal by Ghammraoui et al.,12 were used. Namely, a 26-kVp W-spectrum with 0.2-mm Al-filtration was used for the low-energy acquisitions, and a 50-kVp W-spectrum with 0.6-mm Al-filtration was used for high-energy acquisitions. A total dual-energy AGD of 3 mGy matched the AGD for the single-energy mode and was split evenly between the high- and low-energy exposures. Figure 4 provides examples of ROIs with simulated clusters of both types in a 4-cm compressed breast. It can be observed that the specks in Fig. 4(b) may appear slightly more attenuating (brighter) on average than in Fig. 4(a). Irregular shapes of calcifications make distinction more challenging. For instance, CO and HA particles may have similar apparent size (in -plane) but be of different depths along the x-ray path, with the CO particle being more prolate. In this case, CO calcifications may appear of similar or higher contrast than HA calcifications. The classification task becomes even more difficult with calcifications in breast phantoms of varying thicknesses. Higher attenuating HA signals will have reduced contrast in thicker breasts, whereas less attenuating CO signals in thinner breasts will appear brighter.
Table 1.
Exposure settings used in MC experiments.
| Phantom thickness (mm) | 30 | 40 | 50 | 60 | 70 |
| Mode | Single energy | Dual energy | |||
| Spectrum | W-Rh | ||||
| kVp | 30 | 26 | 50 | ||
| AGDa (mGy) | 3.0 | 1.5 | 1.5 | ||
The number of photon histories was adjusted to produce target AGD for given phantom thickness.
Fig. 4.
Simulated x-ray projection ROIs of calcifications of both types in a 4-cm digital breast phantom. The same window level and window width was applied to all ROI images. (a) Type-I (CO) and (b) type-II (HA).
2.5. Clinical FFDM System Experiment Design
For experiments with a physical phantom, a fixed x-ray tube voltage of 30 kVp was used throughout. The system’s AEC software automatically selected the current–time product. The system then estimated AGD delivered to the phantom. Table 2 lists acquisition parameters used in the experiments on the clinical system.
Table 2.
Exposure settings used in measurements on a clinical system.
| 30 kVp W-Rh spectrum | |||||
|---|---|---|---|---|---|
| Phantom thickness (mm) | 20 | 30 | 40 | 50 | 60 |
| Current × timea (mAs) | 40 | 80 | 125 | 250 | 350 |
| AGDa (mGy) | 0.41 | 0.83 | 1.31 | 2.63 | 3.50 |
Settings selected/estimated by the system.
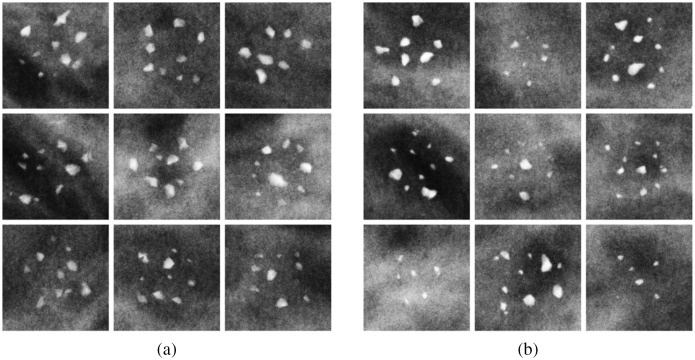
Four templates with calcifications of each type were manufactured. In order to model various breast thicknesses, acquisitions were taken with 2-, 3-, and 4-cm phantoms by removing paper sheets from the stack as well as with 5- and 6-cm phantoms, by adding 1- and 2-cm-thick PMMA plates. Each calcification insert was imaged three times, oriented normally, flipped horizontally, and flipped vertically, for additional ROI background realizations. This allowed them to produce a total of unique CO and HA ROIs. Shown in Fig. 5 are example ROIs of clusters of each type. An observant reader might notice that HA calcifications in Fig. 5(b) have a slightly higher contrast on average than CO calcifications in Fig. 5(a).
Fig. 5.
Clinical system x-ray projection ROIs of calcifications of both types in a 4-cm paper breast phantom. The same window level and window width was applied to all ROI images. (a) Type-I (CO) and (b) type-II (HA).
2.6. Convolutional Neural Network for Classifying Type-I and Type-II Calcifications
A Pytorch machine-learning library built-in implementation of ResNet-18 architecture was used for image classification.19 The network was trained from scratch on the set of either MC generated or clinical mammography system images. An ADAM optimizer with initial learning rate of and a step-decay schedule with a 1/2 learning rate drop after every 5 epochs was used to train the neural network. A weight decay (regularization) factor of 0.0001 was found to be optimal for stable training. Binary cross entropy was chosen as the loss function for the two-class problem. Training dataset augmentation in a form of random vertical and horizontal flipping was applied. As an input, for conventional FFDM modeling, grayscale TIFF files containing calcification clusters were used. It was found that unprocessed (with no rescaling or standardization) floating-point raw ROIs, as cropped from the MC-GPU output, resulted in the best performance. The clinical system generates “for presentation” 12-bit grayscale DICOM mammograms, from which 16-bit ROIs with calcification clusters were extracted.
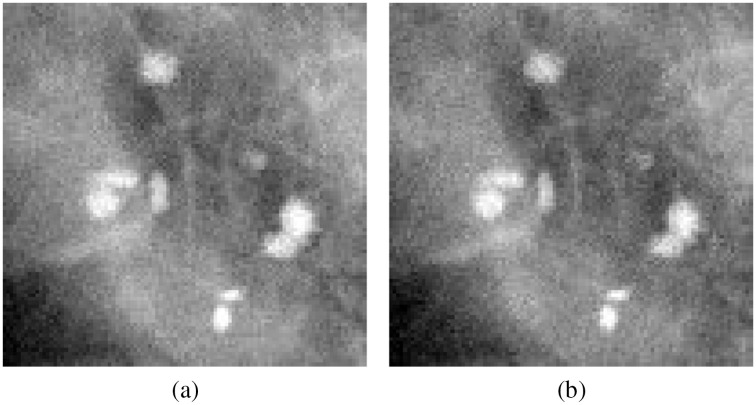
For dual-energy mammography (studied only with MC simulations), a two-channel dataset was produced, in which each ROI is a two-frame TIFF image, with the first channel containing a 26-kVp acquisition, and the second channel containing a 50-kVp acquisition, as shown in Fig. 6. Similar to the single-energy mode, using raw floating-point MC-GPU data resulted in the best classification performance. The output of the CNN was the list of probabilities to produce type classification ROC curves.
Fig. 6.
Two channels of the dual-energy FFDM image: (a) acquired using 26 kVp spectrum and (b) acquired using 50 kVp spectrum.
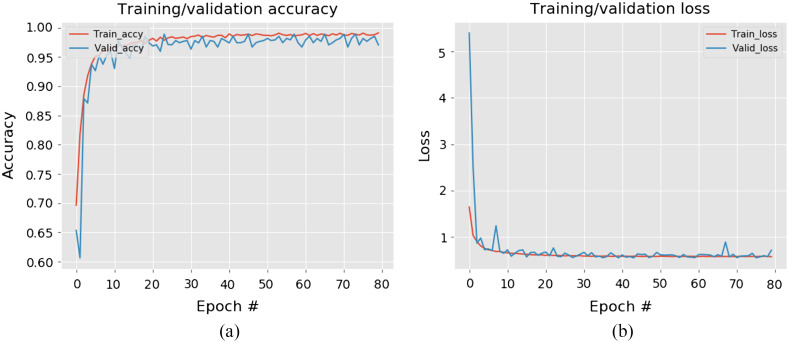
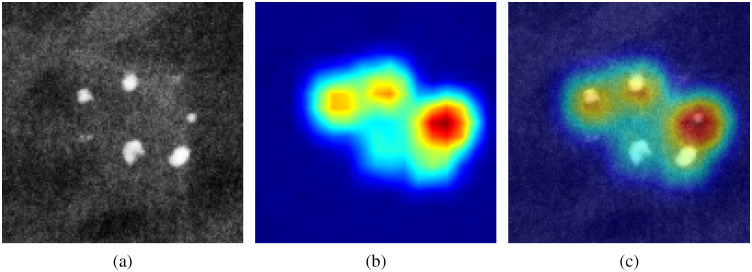
The network was trained and tested on 10,000/950 images for the MC simulations, and on 6000/600 images for the experimental study. A typical example of the ResNet learning process is illustrated in Fig. 7. Shown in Fig. 8 is the localization feature map computed for the final convolutional layer of the network, highlighting the regions in the image that the CNN is using to predict calcification type. As expected, the neural network is focusing primarily on the calcification particles for the task of distinguishing one type of microcalcifications from another.
Fig. 7.
Neural network learning curves: (a) training and test accuracy and (b) training and test loss value.
Fig. 8.
Visualization of “attention” heatmap: (a) original image; (b) heatmap; and (c) the two overlayed.
3. Results
The main findings of this work are summarized in a form of the ROC curves and corresponding AUC values. The uncertainties on the ROC curves are reported as 95% confidence interval (CI) bands calculated using a vertical averaging method.20 Likewise, errors on the AUC values correspond to 95% CI standard error on the mean.
3.1. Simulations: Conventional Mammography; Microcalcifications of Fixed Density
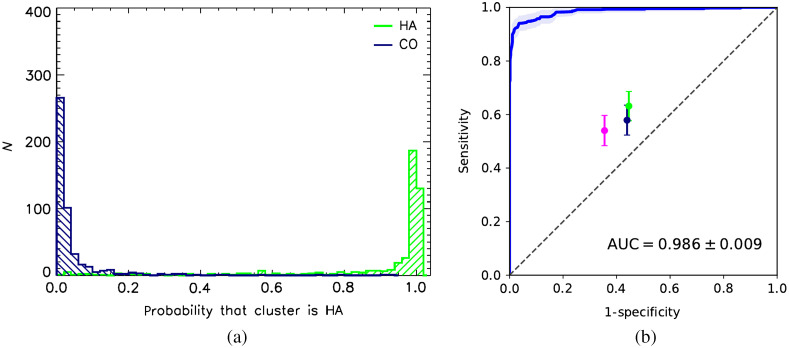
Figure 9(a) shows a good separation between true-positive and true-negative probability distributions as estimated by the neural network, for the classification task of assessing whether the microcalcification cluster is HA for conventional mammography. The corresponding ROC curve, shown in Fig. 9(b), has . With breast phantom thickness varying between 3 and 7 cm, non-uniform anthropomorphic background, and random clusters of microcalcifications of different shapes and sizes, the neural network is able to distinguish CO and HA calcifications with very high accuracy. It is also interesting to notice that the ROC is “well-behaved” in the high-sensitivity portion of the curve, asymptotically approaching sensitivity = 1 line.
Fig. 9.
Estimated CNN performance for simulated conventional (single energy) mammography: (a) conventional FFDM type probability distribution and (b) type discrimination ROC and human observer performance. Error bands around ROC curve and the error bars represent 95% CI.
In clinical use, it is likely that the operating point for this algorithm would be set at a very high sensitivity, maximizing the number of true positives, i.e., when HA clusters are classified as such, and minimizing the number of false negative cases, when HA is misclassified as CO. In this clinical situation, false negatives would carry a high risk and should be minimized. False positive decisions, i.e., when CO is identified as HA by the CNN, entail a low risk and mean that a patient would go to biopsy just as she normally would without additional information from the neural network.
It is curious to compare deep learning image classifier performance with human readers. To do this, a binary choice (type I or type II calcifications) reader study was carried out. Three medical physicists were presented with 200 CO and 200 HA ROIs randomly drawn from a set used for the NN testing. Readers were shown one image at a time and were asked to decide whether it was one type or another, before proceeding to the next image. A “train-as-you-go” arrangement was used with a right/wrong feedback provided after a decision was made. The first 100 ROIs were discarded, and only the remaining 300 ROIs were used for computing true positive and false positive rates. The results are shown in Fig. 9(b) as filled color circles with the 95% CI error bars, with the error on the mean estimated from binomial distribution. All three readers scored similarly with sensitivity and specificity values scattered around 0.6. Notably, the humans performed better than guessing but far inferior to the deep neural network.
3.2. Simulations: Dual-Energy Mammography; Microcalcifications of Fixed Density
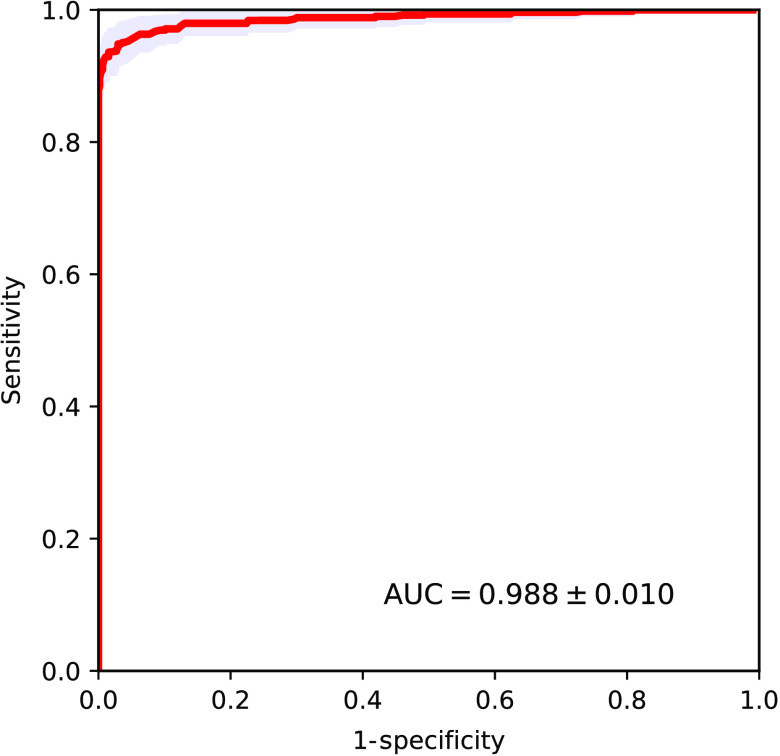
Neural network classification performance for dual-energy mammography is shown in Fig. 10. Observed AUC performance is very close to the one for conventional mammography and is within the measurement error bars. Our first conclusion from these results is that in a case of calcifications of the same density (which might not be exactly the case in real patients) dual-energy modality does not provide noticeable advantages over conventional FFDM in discriminating the calcifications of the two kinds. In this test scenario, the deep neural network seems to be capable of using single energy x-ray images to accurately distinguish between CO and HA calcification clusters.
Fig. 10.
Estimated CNN performance for simulated dual-energy mammography.
3.3. Experimental Measurements: Clinical FFDM System and Anthropomorphic Phantom with Microcalcifications
In the experimental part of the study, multiple CO and HA microcalcification templates were imaged within the anthropomorphic breast phantom of varying thickness ranging from 2 to 6 cm on a clinical FFDM system Hologic Selenia Dimensions. The obtained AUROC value was perfect 1.0 with negligible errors. One possible explanation for this ideal classification performance, as was mentioned earlier, is that our experimental HA particles unintentionally came out to be of density of , whereas CO particles had density of , as was measured after forming the tablets. Such 5.5% difference, with more x-ray opaque HA particles also being slightly denser, may have been a conducive contributing factor to the observed ideal classification performance.
3.4. Simulations: Non-Constant Calcification Density
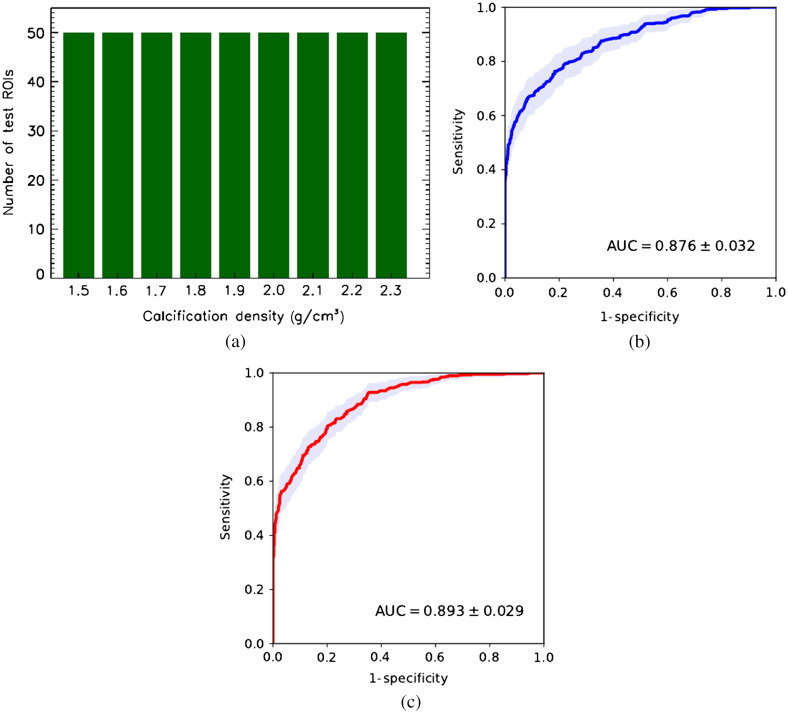
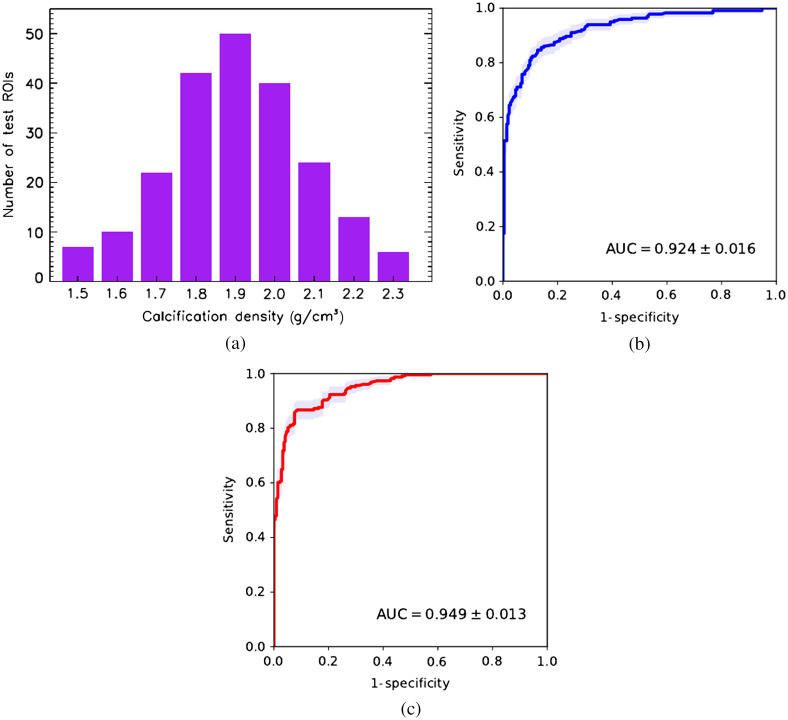
For all study results described above, constant microcalcification density of was assumed. However, it is likely that the density of real microcalcifications is distributed around some mean value. Unfortunately is it difficult to measure density of individual microcalcifications in biopsy samples. A reasonable speculation would be to presume that calcification density of both type-I and type-II microcalcifications follows, perhaps, a normal distribution. One kind of a sensitivity test for the proposed methodology would be to test the CNN that is trained using ROI images of clusters with calcifications of fixed density (of ) on the ROI images with varying density. Let us consider two test case scenarios.
-
1.
More extreme case. Calcification density varies uniformly around the mean value , from 1.5 to [see Fig. 11(a)].
-
2.
More likely case. Calcification density follows normal distribution within the same range [see Fig. 12(a)].
Fig. 11.
CNN classifier performance trained on cluster images with fixed calcification density of tested on images of calcifications with uniformly distributed density. (a) Test set density distribution; (b) conventional mammography; and (c) dual-energy mammography.
Fig. 12.
CNN classifier performance trained on cluster images with fixed calcification density of tested on images of calcifications with normally distributed density. (a) Test set density distribution; (b) conventional mammography; and (c) dual-energy mammography.
Figures 11(b) and 11(c) show ROC cluster classification performance for simulated conventional and dual-energy mammography for test the images with calcification density uniformly distributed between 1.5 and . First, we see a significant to 11% drop in AUC for both modalities compared to the AUC measured using test ROI images with constant microcalcification density . Second, dual-energy mode provides a tangible improvement in AUC compared the single energy mode. Third, in the high-sensitivity region of the ROC curve, the dual-energy modality results in noticeable improvement over that from conventional mammography. In Fig. 12, similar results are presented for the simulated x-ray mammograms with normally distributed calcification density. In this test case, both modalities show increase in classification accuracy, with dual-energy modality behaving better in the high-sensitivity part of the ROC curve. In terms of the AUC performance, dual-energy mode has a advantage compared to conventional mammography. It should be emphasized that the test case considered here purposely has fairly broad density distribution to demonstrate NN capabilities in a rather extreme scenario. Currently, there is no published data available on distribution of microcalcification density in the human breast specimens.
4. Discussion
4.1. Brief Recap and Main Findings
Microcalcifications are localized calcium deposits in breast tissue and are sometimes considered an early mammographic indication of breast cancer. Studies have shown that radiologist performance in differentiating malignant and benign microcalcifications present mammography is less than optimal. Previous reader studies have shown that given a patient cohort of mammographic images with known (based on biopsy) malignant and benign microcalcifications, radiologists are only able to accurately classify to 70% at best. This lack of classification accuracy results in many unnecessary biopsies causing undue patient anxiety and increases in healthcare costs.
Type-I microcalcifications are predominantly observed in benign calcified breast lesions, whereas type-II microcalcifications can be found in either malignant or benign lesions. This finding has motivated researchers to develop imaging methods to accurately differentiate type-I and type-II microcalcifications. Recent studies have been reported using various imaging approaches,11–14 and analysis was conducted using theoretical simulations or experimental phantom acquisitions. The study presented herein uses more accurate modeling of the problem compared to previous efforts and should relate better to performance achievable with clinical data. Simulations are generated using MC simulation of mammograms modeled with a clinically realistic mammography device. Physical phantom acquisitions were acquired with a Hologic Selenia Dimensions 3D clinical FFDM system.
The breast phantom in both simulations and experimental acquisitions accounted for the structure of the breast parenchyma, providing realistic background. In addition, breast phantoms modeling varying compressed thicknesses were used. Microcalcifications were modeled using a range of realistic sizes (0.2 to 1.0 mm) and shapes. Other previous studies modeled microcalcifications as pure HA or pure CO but doing so is not realistic. In particular, it has been shown that microcalcifications of pure HA would provide much higher image contrast than that observed in clinical images.15 Therefore in this simulation study, the density of both HA and CO was conservatively estimated to be the same, both assigned to be . In the phantom study, the density of HA was slightly higher than CO (1.9 versus ).
As far as we know, this is the first study describing the classification of microcalcifications based on their chemical composition using a CNN. The application was studied using both conventional FFDM and dual-energy FFDM. Ideally, training datasets for this classification problem would be obtained from clinical images with known truth. Unfortunately, large datasets of clinical images containing microcalcifications of known chemical composition verified through histopathological analysis are not available. Thus in this study, datasets used for training of the CNN were generated using a realistic MC simulation or by imaging an anthropomorphic breast phantom with custom fabricated microcalcifications of differing chemical composition. The resulting networks were then applied to independently simulated and experimental phantom acquisitions for performance analysis. Results presented here suggest that the ResNet CNN can accurately differentiate microcalcifications of differing chemical composition, in both independently simulated images as well as with experimental phantom acquisitions of custom fabricated, synthetic microcalcifications. For the CNN that was trained and tested on MC simulated images, the AROC for conventional mammography was and for dual-energy mammography was . Given that the dataset consisted of mammograms simulated with phantoms of varying compressed thickness embedded with microcalcifications of varying size and shape, it was somewhat surprising that performance with conventional FFDM was similar to that with dual-energy FFDM. Since microcalcification contrast within the image is dependent on size and shape of the calcification as well as on the breast compression thickness, this result might suggest that the CNN is learning information on the breast thickness and microcalcification size from the ROI image. Sensitivity studies run using simulated data suggested that CNN performance will be slightly degraded if microcalcification density of each type follows a random distribution, with likely less of a penalty observed with dual-energy mammography.
For the CNN that was trained and tested on experimental phantom images, the AUROC for FFDM was perfect 1.0, exceeding the performance observed with simulation studies. Although this performance is remarkable, some caveats should be noted specific to the experimental phantom study. Unlike the simulation study where all microcalcifications had the same variations in shape, HA and CO calcification batches might have had subtle differences in shape. HA and CO powders might have bonded differently when mixed with the binder substance, thereby resulting in different ways the tablets break up (i.e., flaking versus breaking as solid chunks) under mechanical pressure when crushed with a mortar and pestle. Another caveat is that although different breast compression thicknesses were studied, the thicknesses selected for study were discrete with five different thicknesses used (3 to 7 cm). Since it is likely that the CNN would need to estimate breast thickness for each ROI analyzed, having only five discrete thicknesses in the testing cohort could make the classification problem easier than in real case where patient breast thickness is a continuous unknown variable. Based on the results of this study, we hypothesize that the CNN trained on either the simulated or experimentally acquired dataset could be used to accurately differentiate microcalcifications in clinical images. Further studies with clinical data are needed to test this hypothesis, however, there are some limitations in this reported study that should be first explored further.
4.2. Limitations
Microcalcifications in the simulation study were modeled as ellipsoids in a voxelized geometry, with some fraction of voxels on the ellipsoid surface removed and added to attain less regular boundaries. Ellipsoids were only oriented along Cartesian coordinates axes. Although this model is likely more realistic than modeling microcalcifications as perfect spheres, there is some clinical evidence that benign calcifications often exhibit more regular, continuous appearance, whereas malignant calcifications tend to have irregular complex configurations. Nonetheless, we took a more conservative approach of generating both HA and CO calcifications with the same model. Thus one might expect even higher classification accuracy in this task if the neural network can learn differences in the morphology of type-I and type-II microcalcifications.
Although each simulated breast phantom had a unique distribution of breast tissues, thus providing non-repetitive anthropomorphic background realizations, each phantom within the population used in the study was based on the same heterogeneous mixture of adipose and fibroglandular composition (i.e., 30% fibroglandular and 70% adipose tissue). In the experimental study, only one physical phantom was used, and parchment paper sheets were removed to obtain thinner breast models, and PMMA was added to model thicker breast models. This approach is somewhat coarse but provides a readily available method for modeling breasts of different sizes in the experiment. Further studies might include breast phantom models with even more variation in breast density and compression thickness.
It is known that some fraction (around 15%) of biopsied calcified lesions contained a mixture of CO and HA in the clusters. This may further complicate the classification of such clusters from benign ones. Additional studies are needed to understand classification performance when these mixed type clusters are included in the analysis.
5. Conclusions
The motivation for this work was prompted by encouraging results from the prior simulations studies by Ghammraoui and Glick,11 Ghammraoui et al.,12 and Kim et al.,13 showing good potential for dual-energy mammography in distinguishing type-I and type-II microcalcifications in the breast lesions without performing biopsy. With the recent success of CNN in classifying images of all kinds, it is logical to hypothesize that CNNs might accurately classify microcalcification chemical types in both dual energy as well as conventional FFDM images. The two types of materials occurring in calcified lesions, calcium HA and CO, have moderate differences in their chemical compositions, namely the average atomic number, resulting in HA having larger photoelectric absorption cross section and consequently slightly higher contrast in mammography x-ray images. The combination of adipose and fibroglandular tissues distribution in the breast, variations in compressed breast thickness as well as calcifications of different shapes and sizes add a substantial amount of complexity in discriminating between the two calcification types with a visual inspection of a mammogram by a human reader. A literature review3,4 suggests that only about 60% to 70% of all calcified lesions were identified by radiologists as benign or malignant correctly, based on their visual appearance alone. This study attempted to account for the above factors in the MC simulation and clinical FFDM phantom experiments described herein. Our modeling results agree quite well with our experimental findings and suggest that deep CNNs’ may have the capacity to discriminate type I and type II calcification clusters in the breast, using either conventional or dual-energy (diagnostic) mammography images with class separation ROC for the worst case scenario explored here. The in silico and the phantom experiments were arranged, to the best of our ability, in a way that the only difference between the calcifications of both kinds was their chemical composition. A number of simplifying assumptions and following limitations, as listed above, were used in the modeling study and in the experiments. Nevertheless, our initial results demonstrate that deep neural networks may have a strong potential in assisting breast radiologists with reliable classification between malignant and benign calcified lesions found in mammograms.
Future work to further analyze the clinical feasibility of this approach will include using Raman spectroscopy on biopsy specimens to define gold standard chemical composition. These specimens will be imaged combined with a physical anthropomorphic breast phantom to further evaluate CNN discrimination performance.
As of the time of writing, dual-energy contrast-enhanced spectral mammography (CESM) has been approved by the FDA for three mammography equipment vendors to market. Although currently we have not seen a lot of clinical use of CESM, more and more clinical studies are showing the benefit of CESM for diagnostic work-up. We show the potential for using dual-energy spectral mammography to gain further knowledge on the chemical composition of microcalcifications. In the future, we expect dual-energy imaging to become more common for diagnostic work-up, for analyzing both masses (using iodinated contrast) and microcalcifications (using dual-energy and chemical decomposition methods). We believe that the results of this study provide motivation for further research and development of spectral mammography systems, including both dual energy and use of photon counting detectors.
Acknowledgments
The authors would like to acknowledge Dr. Kenny Cha (FDA) for help with setting up machine learning libraries, Dr. Lynda C. Ikejimba (FDA) for assisting in designing calcification inserts, and Dr. Christian G. Graff (former FDA) for help with generating digital breast phantoms.
Biography
Biographies of the authors are not available.
Disclosures
The authors have no relevant conflicts of interest to disclose. The mention of commercial products herein is not to be construed as either an actual or implied endorsement of such products by the Department of Health and Human Services.
Contributor Information
Andrey Makeev, Email: andrey.makeev@fda.hhs.gov.
Gabriela Rodal, Email: gabimrod@gmail.com.
Bahaa Ghammraoui, Email: bahaa.ghammraoui@fda.hhs.gov.
Andreu Badal, Email: andreu.badal-soler@fda.hhs.gov.
Stephen J. Glick, Email: stephen.glick@fda.hhs.gov.
References
- 1.Kerlikowske K., “Epidemiology of ductal carcinoma in situ,” J. Natl. Cancer Inst. Monogr. 2010(41), 139–141 (2010). 10.1093/jncimonographs/lgq027 [DOI] [PMC free article] [PubMed] [Google Scholar]
- 2.Wei L., et al. , “A study on several machine-learning methods for classification of malignant and benign clustered microcalcifications,” IEEE Trans. Med. Imag. 24(3), 371–380 (2005). 10.1109/TMI.2004.842457 [DOI] [PubMed] [Google Scholar]
- 3.Veldkamp W. J., et al. , “Automated classification of clustered microcalcifications into malignant and benign types,” Med. Phys. 27(11), 2600–2608 (2000). 10.1118/1.1318221 [DOI] [PubMed] [Google Scholar]
- 4.Jiang Y., et al. , “Improving breast cancer diagnosis with computer-aided diagnosis,” Acad. Radiol. 6(1), 22–33 (1999). 10.1016/S1076-6332(99)80058-0 [DOI] [PubMed] [Google Scholar]
- 5.Frappart L., et al. , “Different types of microcalcifications observed in breast pathology. Correlations with histopathological diagnosis and radiological examination of operative specimens,” Virchows Arch. A 410, 179–187 (1987). 10.1007/BF00710823 [DOI] [PubMed] [Google Scholar]
- 6.Radi M. J., “Calcium oxalate crystals in breast biopsies. An overlooked form of microcalcification associated with benign breast disease,” Arch. Pathol. Lab. Med. 113(12), 1367–1369 (1989). [PubMed] [Google Scholar]
- 7.Morgan M. P., Cooke M., McCarthy M. G., “Microcalcifications associated with breast cancer: an epiphenomenon or biologically significant feature of selected tumors?,” J. Mammary Gland. Biol. Neoplasia 10(2), 181–187 (2005). 10.1007/s10911-005-5400-6 [DOI] [PubMed] [Google Scholar]
- 8.Radi M. J., “Calcium oxalate crystals in breast biopsies. An overlooked form of microcalcification associated with benign breast disease,” Arch. Pathol. Lab. Med. 113, 1367–1369 (1989). [PubMed] [Google Scholar]
- 9.Truong L. D., Cartwright J., Jr., Alpert L., “Calcium oxalate in breast lesions biopsied for calcification detected in screening mammography: incidence and clinical significance,” Mod. Pathol. 5(2), 146–152 (1992). [PubMed] [Google Scholar]
- 10.Wang Z., et al. , “Non-invasive classification of microcalcifications with phase-contrast x-ray mammography,” Nat. Commun. 5, 3797 (2014). 10.1038/ncomms4797 [DOI] [PubMed] [Google Scholar]
- 11.Ghammraoui B., Glick S. J., “Investigating the feasability of classifying breast microcalcifications using photon-counting spectral mammography: a simulation study,” Med. Phys. 44(6), 2304–2311 (2017). 10.1002/mp.12230 [DOI] [PubMed] [Google Scholar]
- 12.Ghammraoui B., et al. , “Classification of breast microcalcifications using dual-energy mammography,” J. Med. Imaging 6(1), 013502 (2019). 10.1117/1.JMI.6.1.013502 [DOI] [PMC free article] [PubMed] [Google Scholar]
- 13.Kim H., et al. , “Evaluation of photon-counting spectral mammography for classification of breast microcalcifications,” Radiat. Phys. Chem. 162, 39–47 (2019). 10.1016/j.radphyschem.2019.04.028 [DOI] [Google Scholar]
- 14.Martini N., et al. , “Characterization of breast calcification types using dual energy x-ray method,” Phys. Med. Biol. 62(19), 7741–7764 (2017). 10.1088/1361-6560/aa8445 [DOI] [PubMed] [Google Scholar]
- 15.Warren L. M., et al. , “Comparison of the x-ray attenuation properties of breast calcifications, aluminium, hydroxyapatite and calcium oxalate,” Phys. Med. Biol. 58, N103–N113 (2013). 10.1088/0031-9155/58/7/N103 [DOI] [PubMed] [Google Scholar]
- 16.Badal A., Badano A., “Accelerating Monte Carlo simulations of photon transport in a voxelized geometry using a massively parallel graphics processing unit,” Med. Phys. 36(11), 4878–4880 (2009). 10.1118/1.3231824 [DOI] [PubMed] [Google Scholar]
- 17.Graff C. G., “A new, open-source, multi-modality digital breast phantom,” Proc. SPIE 9783, 978309 (2016). 10.1117/12.2216312 [DOI] [Google Scholar]
- 18.Ikejimba L. C., et al. , “A novel physical anthropomorphic breast phantom for 2D and 3D x-ray imaging,” Med. Phys. 44(2), 407–416 (2017). 10.1002/mp.12062 [DOI] [PubMed] [Google Scholar]
- 19.He K., et al. , “Deep residual learning for image recognition,” in Proc. of IEEE Conf. Comput. Vision and Pattern Recognit. (2016). [Google Scholar]
- 20.Macskassy S. A., Provost F., “Confidence Bands for ROC Curves: Methods and an Empirical Study,” in ROC Analysis in Artificial Intelligence, 1st Int. Workshop, https://www.researchgate.net/publication/221055307_Confidence_Bands_for_ROC_Curves_Methods_and_an_Empirical_Study (2004). [Google Scholar]


