Abstract
Many municipal governments have come to depend heavily on fines and fees generated by the criminal justice system. This essay uses data from all courts of limited jurisdiction (municipal and district courts) in Washington State between 2000 and 2014 to evaluate the relationships between local government finances, the Great Recession, and the imposition of debt through the criminal justice system. I find that municipalities issued more criminal justice debt during and after the recession across Washington, but that government finances as measured by tax receipts and expenditures per capita were weakly related to sentencing practices. These findings suggest that macroeconomic fiscal pressures may be drivers of enforcement and prosecutorial practices through increasing case volumes, but that macroeconomic pressures and local fiscal pressures did not appear to shift court sentencing practices in Washington during the Great Recession.
Introduction
When the Department of Justice investigated the Ferguson Police Department following the killing of Michael Brown, it found that the municipality had turned the criminal justice system into an engine of revenue generation.1 Many local and county governments around the country derive a substantial share of their revenues from criminal justice and the courts, but our understanding of this process is limited by the availability of high-quality data.2 In this study, I use comprehensive administrative data from all courts of limited jurisdiction in Washington State to evaluate how local government budgets relate to the sentencing of legal debt through the criminal justice system. I also evaluate whether sentencing and enforcement behaviors shifted during and after the Great Recession.
Courts of limited jurisdiction in Washington handle a variety of ordinance violations, traffic infractions, and misdemeanors. They include municipal courts, which hear violations of city ordinances, and county-level district courts, which hear nonfelony criminal and traffic cases. Washington municipalities and counties have flexibility in attaching fines and fees to violations of municipal or county law. The total revenue they can capture from these sources is governed by state law. District and municipal courts are tasked with collecting “all fees, costs, fines, forfeitures and other money imposed by any municipal court for the violation of any municipal or town ordinances”. Of these collections, 32 percent of noninterest revenues are owed to the state.3 In general, local governments are allowed to retain the remaining 68 percent, with the exception of some costs imposed by the state.
Given the flexibility to impose fines and fees, and the capacity to retain a majority of collected fines and fees at the local level, the Revised Code of Washington provides municipal and county governments with direct financial incentives to issue and collect debt through the criminal justice system. In this study, I use administrative court data to evaluate the following questions:
Do fiscal pressures lead cities/counties to initiate more cases?
Do fiscal pressures lead courts to issue higher financial penalties?
Are these behaviors more likely in cities/counties with larger non-white populations?
Did court behavior change during the Great Recession (2008– 2010)?
I. Data and Methods
I use case-level records on all criminal cases filed in courts of limited jurisdiction in Washington State between 2000 and 2014. Data from the Washington Administrative Office of the Courts (AOC) includes data from 61 district courts and 109 municipal courts across the state. It includes all courts, except the Seattle Municipal Court, which collects its own data. I attach this data to data provided by the Seattle Municipal Court for the same period: 2000 to 2014. I focus only on those cases where a fine, fee, cost, or other nonrestitution legal financial obligation (LFO) was imposed. These data record 1.6 million traffic misdemeanors with LFOs, 1.3 million nontraffic misdemeanors, 5.6 million traffic infractions, and 0.3 million nontraffic infractions.
From these data, I construct three place-level measures by type of case: misdemeanors (traffic/nontraffic) and infractions (traffic/nontraffic). I group all cases with LFOs of each type at the place-level, then calculate the total number of cases per resident, the total imposed LFO debt per resident, and the average LFO debt imposed per case. These three measures capture the breadth of court contact across the population, the fiscal intensity of that contact, and the average penalty in a single case.
Focal predictors are obtained from the Annual Survey of State and Local Government Finance and the U.S. Census. Local government–level financial data used in this analysis include per capita tax receipts and per capita government expenditures. Tax receipts provide a key measure of government own-source revenue. Paired with expenses, these measures provide a simple and direct indicator of fiscal strain. I pair municipal financial data with that city’s municipal court and pair county financial data with that county’s district court(s). All budget and LFO data are inflation-adjusted to 2018 dollars.
I use the 2000 and 2010 US Census to provide city and county-level population estimates for the total population, the Latinx population, the American Indian/Alaska Native population, and the Black population size. I use a linear interpolation to estimate population between 2000 and 2014, using the decennial Census data from 2000 and 2010. Note that this approach understates uncertainty in population change within these cities and counties during this period. As such, regression parameters for population characteristics should be interpreted with caution.
II. Findings
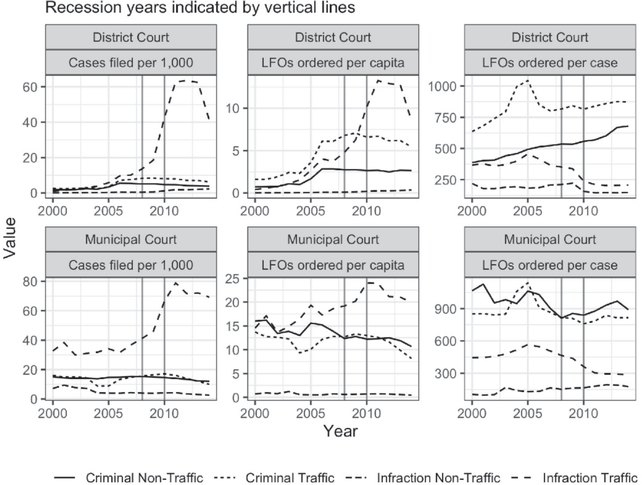
Figure 1 displays the trajectory of case volume, fine and fee volume, and average LFO sentence over time by case type. Note that the dashed vertical lines indicate the period of the Great Recession. The top row of the figure summarizes changes in district court LFO cases between 2000 and 2014, and the bottom row summarizes municipal court LFO cases. In the leftmost column, I show shifts in case volume over this time window, adjusted for population size across Washington state.
Figure 1:
Municipal and District Court Cases in WA
Between 2000 and 2014, the number of traffic infraction cases filed in both district and municipal courts increased dramatically, while other categories of cases remained relatively stable. In 2000, there were about 33 traffic infraction cases filed across all Washington Municipal courts per 1000 state residents. In 2014, that number had more than doubled to 69.3 cases per 1000 state residents. For district courts, the change is more dramatic. In 2000, district courts handled about 1.1 traffic infraction cases per 1000 state residents. By 2014, this rate had increased 36-fold, to 41.4 cases per 1000 state residents. In municipal courts, rates at which other case types were filed remained relatively stable. In district courts, I observe increases in the rates at which criminal traffic and nontraffic cases were filed over this period. Note that for both district and municipal courts, per capita traffic infraction rates increased substantially during the recession years.
The middle column displays total LFOs ordered across all municipal and district court cases in the state per 1000 residents. For district courts, there are clear increases in the volume of LFO debt issued per capita over the 2000 to 2014 period across all violation categories. In 2000, Washington district courts ordered about 41 cents per 1000 residents in traffic infraction LFOs. In 2014, they ordered about $8.55 per 1000 residents. Per capita LFO orders remained relatively stable in municipal courts, increasing from about $14.55 per 1000 residents in 2000 to about $19.92 per 1000 residents in 2014.
The righthand column of Figure 1 shows the average total LFO imposed per case across municipal and district courts in Washington. While the average total LFO debt ordered per case for misdemeanors in district courts increased over this period, I note declines in the per-case average LFO imposed for traffic infractions. Given the sharp increase in LFOs ordered per capita and cases per capita, this strongly suggests that the increase is driven by changes in policing and enforcement, with higher case volumes driving increased rates of LFO sentencing.
III. Statistical Models
To explore how the Recession, local government budgets, and racial and ethnic population composition relate to the imposition of court debt in Washington, I construct a series of regression models.
For municipalities and counties separately, I estimate multilevel models for total LFO debt and debt ordered per case that include court-specific and year-specific varying intercepts. Model predictors include parameters for local government expenses per capita, local government tax revenues per capita, the square root of the proportion of the population that is Latinx, American Indian/Alaska Native (AIAN), and Black (separately), the log of the total, and an indicator for whether the observation occurs during the 2008 to 2010 Recession years.
IV. Model Results
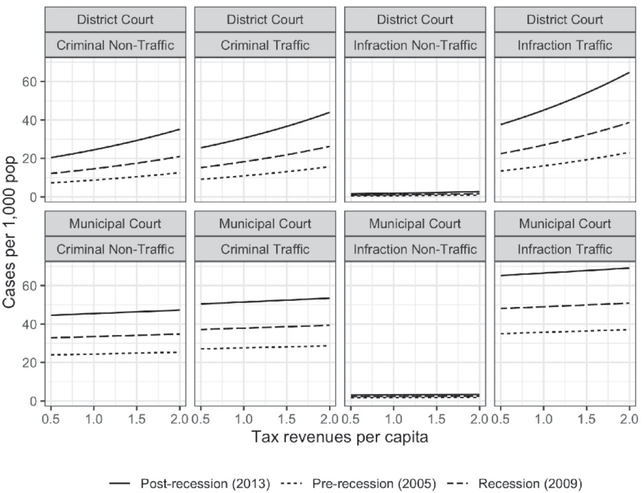
Figure 2 displays the results of regression model predictions for a set of hypothetical cases where we hold all predictors at their mean and systematically vary tax revenues per capita from 0.5 dollars per capita to 2 dollars per capita. Note that in the district and municipal court models, the coefficient for tax revenues per capita is not statistically significant, and there is no clear bivariate association between tax receipts and LFO cases per capita. These models suggest that case volumes are not significantly different in high tax receipt jurisdictions when compared to low tax receipt jurisdictions. Washington courts of limited jurisdiction initiated more cases with LFOs on average during and after the recession than they did before the recession. The models predict the highest volume of cases in the years following the recession, with significant increases during the recession years. These results suggest, along with the time series displayed in Figure 1, that shifts in enforcement and court practices leading to higher case volumes likely began during or immediately before the recession, and have continued to drive up case volumes since.
Figure 2:
Predicted LFO Cases per Capita
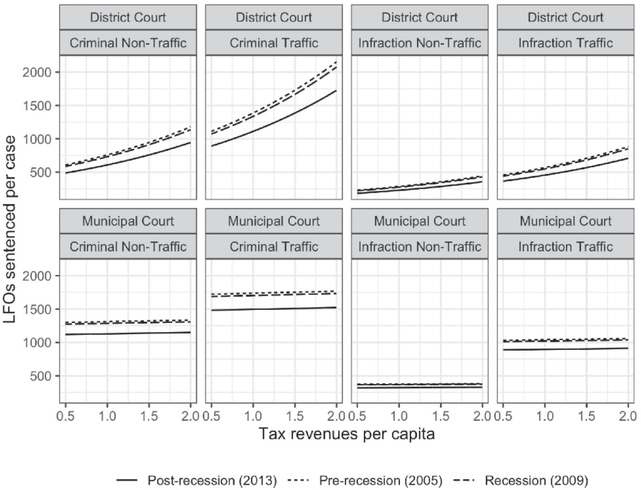
Figure 3 displays the model-predicted average total debt assessed by Washington courts of limited jurisdiction per case by case type. Increases in total LFOs during and after the recession in Washington State courts of limited jurisdiction were largely a function of increased case volume, not increased sentencing in court. In both Municipal Courts and District Courts during and after the recession, the number of cases coming into the court increased, but the average amount ordered remained relatively stable. For most classes of offenses, the average sentenced amount slightly decreased between 2005 and 2013, and remained stable during the recession. This suggests that shifts in debt issued during and after the recession are likely due to shifting enforcement and prosecution, not due to court practices.
Figure 3:
Predicted Average LFO Ordered
Contrary to a fiscal pressure theory, we see higher levels of sentenced LFO debt in high property tax receipt jurisdiction district courts (county). We see no clear relationship between property tax revenues and municipal court practices. These results provide no support for a microlevel fiscal pressure theory of LFO sentencing at the court level.
Conclusion
This study provides an overview of the issuance of criminal justice debt for misdemeanors and infractions across Washington state courts of limited jurisdiction. I show that district and municipal courts in Washington began issuing much higher volumes of traffic infraction debt during and after the Great Recession, but this was largely a function of a higher volume of cases. Average LFOs ordered per case have declined over time. I do not find a clear relationship between local government finances (as measured by property tax revenues) and the issuance of low-level criminal justice debt in Washington. This suggests that courts in Washington may not be sensitive to fiscal pressures from their host local governments, despite clear financial incentives for increased collections. Prior research has clearly indicated, however, that court clerks in Washington do feel fiscal pressure to increase collections given strains on the courts’ own budgets.4
Based on these findings, the relationship between local government budgets and criminal justice debt collections are either weak or more complex than the current model evaluated here. These results showed that the total amount of debt issued by courts increased during and after the recession, but average debt issued per case remained stable over time. This strongly suggests that inflows of cases drove these changes. Policing, traffic enforcement, and prosecutorial decisionmaking are likely the drivers of these shifts. Fiscal pressures may indeed by shaping the broader system of legal debt, but it appears that the courts themselves were not the primary institution responsible for changes during and after the recession. Future research should closely examine how police enforcement patterns and prosecutorial decision shifted during and after the recession, and examine whether local government fiscal pressures affect police practices.
These results suggest that in Washington, courts of limited jurisdiction do not appear to dramatically shift their sentencing practices in response to macroeconomic shocks or pressures on municipal budgets. The volumes of legal debt issued in Washington changed dramatically during and after the recession, but the courts themselves do not appear to have been the primary source of this change. Instead, researchers and advocates should take a holistic view of the legal systems that produce criminal debt, including police, prosecutors, and commercial interests, to better map the relationships between fiscal pressures and criminal-legal debt.
Footnotes
U.S.Dep’t of Justice, Civil Rights Div., Investigation of the Ferguson Police Department (2015).
April D. Fernandes etal., Monetary Sanctions: A Review of Revenue Generation, Legal Challenges, and Reform, 15 Ann. Rev. l. and Soc. Science 397 (2019); Kasey Henricks & Daina Cheyenne Harvey, Not One But Many: Monetary Punishment and the Fergusons of America, 32 Soc. F. 930 (2017); Michael W. Sances & Hye Young You, Who Pays for Government? Descriptive Representation and Exploitative Revenue Sources, 79 J. Pol. 1090 (2017).
RCW3.50.100, RCW3.62.020.
Alexes Harris, A Pound of Flesh: Monetary Sanctions as Punishment for the Poor (2016).


