

Aggregation intermediates of Parkinson’s disease–related α-synuclein on liposomes are structurally characterized by NMR.
Abstract
Recent advances in the structural biology of disease-relevant α-synuclein fibrils have revealed a variety of structures, yet little is known about the process of fibril aggregate formation. Characterization of intermediate species that form during aggregation is crucial; however, this has proven very challenging because of their transient nature, heterogeneity, and low population. Here, we investigate the aggregation of α-synuclein bound to negatively charged phospholipid small unilamellar vesicles. Through a combination of kinetic and structural studies, we identify key time points in the aggregation process that enable targeted isolation of prefibrillar and early fibrillar intermediates. By using solid-state nuclear magnetic resonance, we show the gradual buildup of structural features in an α-synuclein fibril filament, revealing a segmental folding process. We identify distinct membrane-binding domains in α-synuclein aggregates, and the combined data are used to present a comprehensive mechanism of the folding of α-synuclein on lipid membranes.
INTRODUCTION
α-Synuclein (αS) is a 140-residue intrinsically disordered protein that is abundant in the human brain and enriched in the presynaptic nerve termini (1). Under a variety of conditions, it readily self-associates and eventually forms highly ordered fibril structures. Aberrant accumulation of such misfolded αS in neurons and glial cells is found in a family of diseases called synucleinopathies, which include Parkinson’s disease (PD) (2), dementia with Lewy bodies (3, 4), and multiple system atrophy (MSA) (5, 6).
In recent years, structures of fibrils have been successfully studied by means of solid-state nuclear magnetic resonance (NMR) spectroscopy and cryo–electron microscopy (EM), revealing a multitude of architectures (7–10). At their core, these fibril structures consist of the so-called non–amyloid-β component (NAC), a hydrophobic, highly aggregation-prone region encompassing residues 61 to 100 (11). On a mechanistic level, monomeric αS aggregates to form multiple populations of oligomeric intermediates that interconvert and are rich in antiparallel β sheet (12). Such oligomers can either be off-pathway, not converting further, or on-pathway and eventually restructure and elongate to form fibrils (13). Growing evidence suggests that these transient intermediates constitute the major toxic species in disease progression (14). Membrane disruption by αS oligomers has been suggested as a potential mechanism for toxicity (15, 16). Structural information on these nonfibrillar intermediates is scarce.
Because of its location and its preference for the binding to phospholipid membranes, αS has been linked to a regulatory role in synaptic vesicle exocytosis, brain lipid metabolism, and neuronal survival (17). In its native state, αS binds to anionic phospholipid bilayers via an amphipathic helix comprising residues 1 to 100, which contain nine imperfect repeats with the consensus sequence KTKEGV (18, 19). Lipid interaction of αS has been shown to modulate the aggregation kinetics depending on head group charge, acyl-chain length, and protein-to-lipid ratio (20, 21). Despite recent advances in structural characterization of αS fibrils and oligomers, structural studies on aggregates grown in the presence of phospholipids are limited. Comellas et al. (22) elegantly showed the progression from monomeric to fibrillar αS in a lipid environment but did not investigate intermediates in detail.
Here, we used solid-state NMR (ssNMR) to obtain atomic resolution information on aggregation intermediates in the presence of phospholipid membranes. Our results reveal that αS fibril formation is initiated by formation of two loop regions (residues 58 to 61 and 71 to 80). This species then rapidly rearranges, with parts of the NAC adopting the final fibril conformation. The structural changes observed during the aggregation process are each distinguished by a characteristic response to thioflavin T (ThT) and can be attributed to specific time points in the aggregation cascade. Through the use of nuclear Overhauser effect (NOE)–based ssNMR measurements, we identified two membrane-binding domains in αS fibrils, substantiating the observed mechanism.
RESULTS
αS adopts polymorph 2 type fold in the presence of phospholipids
To understand the process of fibril formation in the presence of phospholipids, fibrils grown de novo from monomeric full-length αS in the presence of small unilamellar vesicles (SUVs) composed of 1-palmitoyl-2-oleoyl-sn-glycero-3-phosphate (POPA) and 1-palmitoyl-2-oleoyl-sn-glycero-3-phosphocholine (POPC) were investigated by ssNMR in combination with transmission electron microscopy (TEM). To obtain de novo assignments for 1H, 13C, and 15N backbone and side-chain resonances of fibrils, we recorded proton-detected three-dimensional (3D) spectra (Materials and Methods; figs. S1 and S2) alongside 13C,13C 2D correlation spectra with dipolar-assisted rotational recoupling (DARR; 20-ms mixing time) (Fig. 1A). For this purpose, we prepared fibrils of 13C,15N-labeled αS. Furthermore, we prepared fibrils of 2H,13C,15N-labeled αS leveraging the increased amide proton sensitivity originating from perdeuteration for confirmation of assignments (23). Secondary structure prediction by TALOS+ (Fig. 1B) (24) revealed several stretches of β sheets, including residues L38-V95 as previously found in other studies (25). These β sheets are interrupted by turns composed of residues K45-E46, K58-K60, G73-T75, as well as K80 and T81. On comparing chemical shifts with those for fibril polymorph 2 reported by Guerrero-Ferreira et al. (9) (BMRB entry 18860; Fig. 1, C and D), remarkable similarity is seen for two extended segments V41-A56 and V70-K80 (9, 25). Marked differences were, however, observed for residues E57-A69 and T81-V95. An origin of these differences might be the absence of a rigid N-terminal domain, as we did not observe residues G14-G25 being incorporated into the fibril core, unlike previously reported structures (9).
Fig. 1. Characterization of αS fibrils in the presence of phospholipids.

Structural and morphological characterization of αS fibrils grown in the presence of anionic phospholipids (POPA/POPC 1:1, L/P = 5:1). (A) 13C,13C 2D correlation spectrum with 20-ms DARR mixing of 13C,15N-labeled fibrils acquired at 850 MHz with 17-kHz magic-angle spinning. (B) Chemical shift differences between the fibril preparation here compared to the polymorph 2 fibrils deposited in BMRB 18860 plotted onto the structure of polymorph 2 (PDB 6ssx). Similar chemical shifts are represented in green, large differences are in red, and partial similarity is in yellow (scale indicated below). (C) Torsion angles (top) and order parameter S2 (center) derived by TALOS+ from Cα, Cβ, and C′ chemical shifts of αS fibrils; (bottom): secondary structure propensity predicted by TALOS+ (arrows indicate β sheet; curved lines indicate turn or loop regions). (D) Chemical shift differences between the fibril preparation here compared to BMRB 18860 (shaded according the color scale in B). (E to G) TEM micrographs of fibrils depicting the most abundant polymorphic structures (scale bars, 100 nm): (E) high-pitch fibrils (helical pitch, 90 nm), (F) medium-pitch fibrils (114 nm), and (G) low-pitch fibrils (300 nm).
Unambiguous 13C-13C long-range contacts (table S1; distances up to ~7 Å) were obtained from 13C,13C 2D correlation spectra with 200-ms DARR mixing (fig. S3A). Several contacts observed in the DARR spectra conflict with the reported polymorph 2 structures (distance >7 Å; table S1) (9). These conflicts are consistent with the observed chemical shift differences for the corresponding residues. For example, we could not find evidence for contact between I88 and N65, as would be expected from reported structures for polymorph 2 [Protein Data Bank (PDB) entries 6ssx and 6sst] (9). Nevertheless, we still observe the expected contact between I88 and G67, indicating a slightly different arrangement of the backbone of the C-terminal part of the fibril core, while the orientation of the side chain is mostly preserved. This confirms that the global fold of αS within a filament is comparable to PDB 6ssx and 6sst (fig. S3B). The recently reported structure of the E46K mutant of αS (PDB 6ufr) features a similar αS fold (26); however, for this structure, a contact of I88 and G67 is not expected as the I88 side chain faces outside the filament. In the following, we will therefore refer to fibrils in this work as polymorph 2 type.
Electron micrographs display fibrils of 10 to 15 nm in width, carrying three distinct morphologies (Fig. 1, E to G, and fig. S4). The two predominant species are straight with a helical pitch of 85.5 ± 8.3 nm and slightly curved with a helical pitch of 123.2 ± 20.7 nm, similar to morphologies of other fibrils with a comparable filament fold (26). The less populated species shows a helical pitch of 299.7 ± 185.3 nm and appears either straight or curved, sometimes even wavy. Considering that the 13C,13C 2D ssNMR spectra show only a single set of signals, the conformations of the monomers within the fibrils appear to be very similar. Such observation of homogeneous monomer structure and different mesoscopic structure of amyloid fibrils have been reported earlier (27).
αS fibrils bind to anionic phospholipids via their C- and N-terminal domains
Fibrillar forms of αS bind to anionic phospholipid bilayers, and it has been suggested that they interact via the N-terminal domain (28). Minor structural perturbation of the fibril core in the presence of lipids was also reported, yet little is known about the molecular details of this interaction (22, 29). To comprehensively characterize binding domains of the rigid core of αS, we recorded 3D H(H)NH spectra with longitudinal mixing similar to previously reported (Fig. 2, A to C) (30). These experiments yield residue-specific information on the exposure to the immediate water and lipid environment with transfer to mobile species mediated via NOE (31). We prepared perdeuterated 13C,15N-labeled αS fibrils in the presence of lipids, allowing the discrimination of peaks originating from the 1H chemical shifts of water at 4.7 parts per million (ppm) (Fig. 2B), choline CH3 at 3.3 ppm (Fig. 2C), and lipid acyl-CH2 at 1.3 ppm (Fig. 2D) (30).
Fig. 2. Interaction of αS fibrils with phospholipids.

(A) 2D (H)NH spectrum and planes of a 3D H(H)NH spectrum with 25-ms NOE mixing corresponding to water (B, 4.7 ppm), choline (C, 3.3 ppm), and lipid-CH2 (D, 1.3 ppm) recorded on 2H,13C,15N-αS with POPA and POPC. (E) Residues in contact with water (blue), choline (green), and lipid-CH2 (dark red) along the αS sequence and (F) filament structure (PDB 6ssx) color-coded depending on the environment of the protein backbone. Gray residues were not assignable or not observed. (G) Enlarged view of the extended cavity inside the filament indicated by the dotted box in (F). (H) TEM micrographs showing strong binding of fibrils to anionic lipid vesicles (scale bars, 100 nm).
The observed peaks were assigned to the αS sequence allowing the description of the immediate environment of the protein backbone (Fig. 2E). Several extended stretches of residues are in contact with water. Unexpectedly, residues V63-A69 also appear to be in contact with water, despite being capped by the C-terminal part of the NAC (Fig. 2F). An extended cavity formed between residues G67-A69 and residues V82-I88 (Fig. 2G) bears enough space for enclosed water molecules.
Two lipid-binding domains were identified at both the N- and C-terminal edges of the fibril structures (Fig. 2F). The existence of multiple lipid-binding domains is in agreement with TEM micrographs (Figs. 1, E to G, and 2H), where vesicles are often seen bound to more than one side of the fibril surface, in some cases creating lipid-engulfed fibrils. This is enhanced by the fibril twist enabling the different domains to simultaneously face the same lipid bilayer.
In the N-terminal region, residues L38-S42 and E46 are in contact with the CH2 groups of the lipid acyl chains (Fig. 2, D and F). Moreover, residues T75 and K80 were found to be in contact with the choline CH3 groups of POPC (Fig. 2C), suggesting that residues L38-S42 are more deeply embedded in the membrane. Anchoring of αS fibrils to lipid bilayers through the N-terminal domain had been described earlier (22). In the C-terminal part of the NAC, residues A85-G86 and G93-V95 are found to be in contact with lipids (Fig. 2F), underpinning the differences in fibril structure observed in this region compared to published structures for polymorph 2 (Fig. 1D) (9). Furthermore, binding of fibrils to lipids via residues A85-V95 rationalizes why they are not bound to residues G14-G25 as part of the cross–β sheet fibril core, as the lipid molecules displace residues G14-G25 from the fibril.
αS intermediates are enriched at the end of the lag phase
The isolation of intermediates during amyloid fibril formation is a challenging process that is aggravated by their transient nature and their time-dependent population. Using ThT fluorescence, alongside circular dichroism (CD), solution NMR, atomic force microscopy (AFM), and TEM, we characterized the aggregation process under the present conditions in detail to determine ideal points for enrichment of intermediates.
Since solution conditions heavily influence kinetics and often render the comparison of absolute aggregation times difficult, we decided for a lag time calibrated time scale (Fig. 3, A and B) (32). This allows discussion of the observations based on characteristic relative time points. Figure 3B shows the ThT fluorescence curve of the fibril formation kinetics of several individual runs with an average lag time of 6.6 ± 2.0 hours. A plateau confirms completion of fibril formation after about five times tlag, corresponding to about 36 hours on average. The structural transition of α-helical membrane-bound monomer to β sheet–rich aggregate was further confirmed using CD spectroscopy (Fig. 3C). CD spectra show little alteration before the end of the lag phase and then a sudden change in secondary structure at t = tlag in agreement with a sharp rise in fluorescence at the same time.
Fig. 3. Identification of intermediates during αS aggregation in the presence of phospholipids.
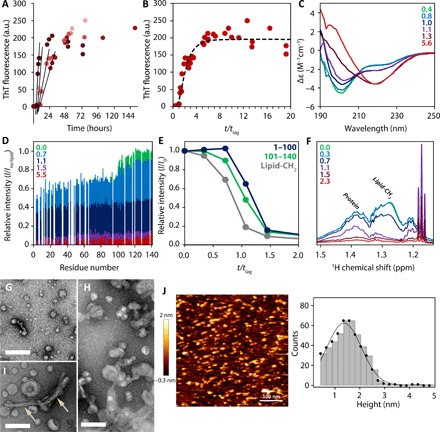
(A) Lag-time determination by linear fitting for four independent aggregation experiments under the same conditions followed by ThT fluorescence. a.u., arbitrary units. (B) Kinetics of αS aggregation followed by ThT fluorescence plotted against t/tlag. For fitted line, see Materials and Methods. (C) Far-ultraviolet CD spectroscopy and (D) relative intensities of resonances from 1H-15N-HSQC spectra plotted per residue for samples taken at characteristic time points during aggregation represented by t/tlag. Intensities were normalized by the intensities of lipid-free αS. (E) Intensities of monomeric αS in 1H-15N-HSQC spectra referenced to the intensities before aggregation (I0). Averages of I/I0 are shown for the C terminus (residues 101 to 140), the N terminus (residues 1 to 100), and the lipid signals plotted against t/tlag. (F) 1H spectrum of αS during aggregation. (G to I) Representative TEM micrographs taken at t/tlag ~ 0.4 (G) and at t/tlag ~ 0.7 (H and I). Arrows in (I) indicate fibril-like rods (scale bars, 100 nm). (J) AFM image of aggregated αS with lipids taken at t/tlag ~ 0.8 incubated on mica and histogram analysis (right) of the protein structures together with a Gaussian fit resulting in a protein height of 1.4 ± 0.7 nm (mean height ± SD). All experiments were performed with SUVs consisting of POPA and POPC (1:1) and an L/P ratio of 10:1.
To obtain residue-specific information on monomeric αS in solution, we recorded 2D 1H-15N–heteronuclear single-quantum coherence (HSQC) spectra of uniformly 15N-labeled αS during aggregation (fig. S5). Before aggregation, residues 1 to 100 show attenuation (Fig. 3D), characteristic for the binding of the protein to the slow tumbling vesicles, whereas the unbound C-terminal residues 101 to 140 show signal intensities comparable to the free monomer without lipid (33). At t/tlag = 0.8, corresponding to the time right before the end of the lag phase on ThT fluorescence, the intensities of the C-terminal residues decrease, while the rest of the sequence shows only minor deviation (Fig. 3, D and E). At the same time, the lipid signal observed in a 1H-NMR spectrum decreases substantially (Fig. 3F). This is best explained by aggregate formation on the bilayers of the SUVs, resulting in a slower tumbling of the aggregate-SUV complex paired with an increase in SUV size as seen from micrographs of early-stage aggregation (Fig. 3G) compared to later stages (Fig. 3, H and I). Consequently, even the C terminus becomes unobservable by NMR. The N-terminal residues experience no change at this point (Fig. 3D), indicating that no further monomer is recruited from solution to form the membrane-bound aggregates. After the lag phase has passed (t/tlag = 1.1), the attenuation profile indicative of membrane binding is completely lost, meaning that only free monomer is observed in solution 1H NMR spectra at this point. This implies that initial aggregates are formed only by membrane-bound αS.
To confirm the presence of nonfibrillar aggregates, we performed a morphological analysis of samples at the end of the lag phase by AFM and TEM. TEM micrographs (Fig. 3, G and H) acquired over the course of the aggregation process reveal particles of similar size, alongside SUVs. At the end of the lag phase (Fig. 3I), a low population of short fibril-like rods can be observed. AFM height images (Fig. 3J) show formation of a supported lipid bilayer and spherical and ellipsoidal particles of 10 to 20 nm in diameter and a mean height of 1.5 ± 0.3 nm, similar to membrane-embedded αS aggregates published earlier (34). It is apparent from the combined data that immediately before the end of the lag phase (t/tlag = 0.7 to 0.8), small aggregates with both α-helical and β sheet content form on the surface of the negative phospholipid bilayer. These aggregates then quickly rearrange to form β sheet–rich aggregates and fibrils.
To understand the individual steps of αS fibril formation on a structural level, samples were taken at characteristic time points before fibril maturation based on ThT fluorescence. Samples were then further analyzed by ssNMR (see below) to obtain structural information.
Figure 4 shows the ThT response of the isolated species, which we call Intermediate 1 (blue) and Intermediate 2 (purple). The ThT response served to retrospectively define for the nine samples the time point of isolation plotted in terms of t/tlag. The corresponding values for t/tlag were estimated on the basis of a curve derived from fitting of a secondary nucleation dominated kinetic model to four independent time-course experiments (Fig. 3A and Materials and Methods) (35). Samples of Intermediate 1 are characterized by ThT values corresponding to t/tlag < 1, indicating isolation within the lag phase, while for Intermediate 2, we generally observed ThT values corresponding to t/tlag ≥ 1, meaning that the lag phase had ended at the time of isolation. Intermediate 1 is therefore identified as a prefibrillar species, while Intermediate 2 is of fibrillar nature. Intermediate 1 at the end of the lag phase shows negligible ThT response, likely due to an unfinished cross–β structure or poorly accessible binding sites. At the end of the lag phase, upon formation of Intermediate 2, aggregation has passed a certain threshold, leading to a pronounced change in ThT response, confirming the formation of extended cross–β sheets and accessible dye binding sites.
Fig. 4. Kinetic parameters of αS intermediates.
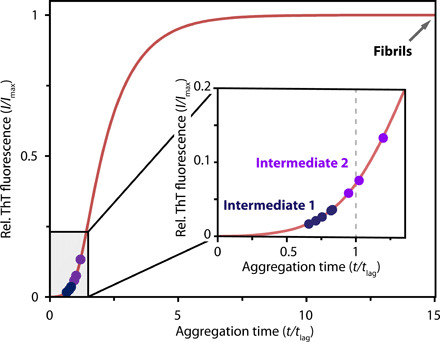
ThT fluorescence of Intermediates 1 (blue) and 2 (purple) served to retrospectively determine the progress of aggregation at the time of isolation expressed as t/tlag. The red curve was obtained from fitting a kinetic model to ThT data recorded under the same conditions (see Fig. 3B). The arrow indicates the time point of isolation for fibrils. Structural categorization was obtained from ssNMR.
αS filament formation progresses through segmental folding
With the aim of getting atomic resolution information on the isolated αS intermediates described above, we recorded 13C,13C 2D correlation spectra with DARR mixing (Fig. 5) and compared the spectra to those of monomers and fibrils. To characterize monomeric αS in the presence of phospholipids, 13C,13C-DARR spectra on 13C,15N-labeled αS were acquired at increasing mixing times (5, 20, 50, and 200 ms; fig. S6, Materials and Methods). Assignments of αS 13C resonances are often ambiguous, due to the highly repetitive sequence, which includes the KTKEGV repeats. Nevertheless, 2D 15N,13C correlation spectra reveal that the resonances observed in the DARR spectra belong to multiple rather than one set of repeats, as several 15N resonances are observed for most 13C resonances (fig. S7). The attenuation profile observed in solution shows that residues 1 to 100 are interacting with lipids (Fig. 3D). In the ssNMR spectra, mostly residue-type assignments are possible; however, the observation of an isoleucine resonance confirms involvement of the NAC region. As I112 is located in the disordered C terminus (residues 101 to 140), this resonance can be assigned to I88. Along with the absence of any methionine resonances (e.g., M1 and M5) in the DARR spectra, this suggests that the resonances observed in the 13C,13C correlation spectra belong to residues 6 to 100. Secondary chemical shifts predominantly indicate helical conformation (Fig. 5C), with the exception of one threonine and one glycine residue, each showing a chemical shift indicative of a coil conformation (T′ and G′ in fig. S6) (36).
Fig. 5. Comparison of αS species occurring during aggregation in the presence of anionic phospholipids.
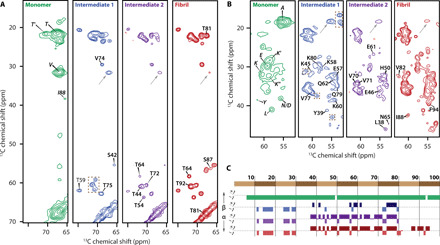
(A and B) Slices of 2D 13C-13C spectra of αS monomers (green), Intermediate 1 (blue), Intermediate 2 (purple), and fibrils (red) prepared in the presence of phospholipids (POPA and POPC 1:1). All spectra were recorded with DARR mixing of 20 ms. Dashed boxes indicate unassigned peaks with chemical shifts different from fibrils demonstrating the structural difference between intermediates and fibril. Gray arrows indicate peaks with chemical shifts indicative of an N-terminal helix. Tentative assignment of N-terminal resonances stems from similarity with monomer spectra. Peaks are labeled when they appear first. Their assignment was reproduced in all samples stemming from time points later in the aggregation process. (C) Chemical shift index values plotted for sequentially assigned residues in 13C-13C DARR spectra (clusters of three “−1” are designated helix, clusters of four “+1” are designated β strand, and all other residues are considered coil; for monomeric αS, nonhelical threonine and glycine were not considered, due to lack of sequence-specific assignment).
This finding is in contrast to earlier studies on the monomeric state in the presence of lipids that described uniformly helical secondary chemical shifts (37). The existence of residues in a coil conformation can be explained by a “broken helix,” i.e., two helical segments connected by a nonhelical linker as described in previous studies (38). Alternatively, the nonhelical residues could be located at either edge of a single extended helix (39). Without further investigation, we cannot exclude either of these possibilities. For simplicity, we therefore depict αS in an extended, unbroken helix conformation (Fig. 6), acknowledging that further studies are needed to confirm the detailed structure of membrane-bound monomeric αS.
Fig. 6. Mechanism of αS aggregation in the presence of anionic phospholipids derived from the results in this work.
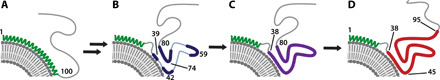
(A) Both solution and ssNMR support the model of monomeric αS binding to phospholipid bilayers via residues 1 to 100 adopting a helical conformation. A broken helix with nonhelical residues in a putative linker was not considered, due to lack of sequence-specific assignment. (B) Subsequently, residues 73 to 80 in the core as well as residues 57 to 61 at the edge of the NAC region form β sheet loops, while the N-terminal domain remains bound to the membrane and assists folding. (C) Starting from these initial structural elements, the αS aggregates quickly rearrange to adopt a fibril-like conformation for residues 38 to 80 while the C terminus remains unstructured. (D) Eventually, mature fibrils form. Note that, for simplicity, protein is drawn only contacting the lipid surface, while the evidence points to a placement of both helical and sheet regions deeper in the membrane.
The helical N-terminal conformation found in monomeric αS can be detected throughout the aggregation process, as resonances similar to those of the lipid-bound monomer are observed in all aggregate samples (gray arrows in Fig. 5, A and B, and fig. S8). This observation highlights that αS does not leave the membrane surface during aggregation and shows that membrane binding in the N-terminal domain is not limited to residues L38-S42 (Fig. 2E). Resonances assigned to Y39 and I88 for helical monomeric lipid-bound αS are not detected after formation of Intermediate 1, indicating that the N-terminal helix is restricted to less than the first 38 residues (Fig. 5, A and B). Accordingly, remaining alanine and valine resonances were assigned to residues within the sequence A11-A30. Other resonances within this sequence are likely too low in abundance to be detected. The involvement of residues A11-A30 in a helical membrane-binding domain throughout the aggregation process further explains the absence of the N terminus in the cross–β sheet fibril core. With increasing aggregation time, the cross peaks of the helical domain decrease in intensity relative to the peaks of the remainder of the protein. In fibrils, the membrane-bound fraction therefore becomes small compared to the total aggregate size, leading to the conclusion that fibrils only interact partially with lipids while large parts are not in contact with vesicles (Figs. 1, E to G, and 2H).
Comparison of the spectra obtained for Intermediate 1 (Fig. 5, blue) to those of αS-fibrils (Fig. 5, red) reveals two stretches of residues, including the sequences 57EKTKEQ62, as well as 72TGVTAVAQK80, with chemical shifts similar to fibrils, indicating a comparable local conformation of the associated residues. Intriguingly, these residues make up two prominent loops in the filament folds of polymorph 2. Besides these extended stretches, residues Y39, S42, and K45 in the N-terminal part of the rigid filament core could be assigned. Since these residues are in contact with lipids in both monomers (Fig. 3D) and fibrils (Fig. 2E), they are likely permanently bound to the membrane during the whole aggregation process. The strong similarity in Cα and Cβ chemical shifts of Intermediate 1 compared to fibrils suggests that the corresponding residues carry a similar backbone arrangement. At the same time, the carbonyl chemical shifts differ in many cases between Intermediate 1 and the fibrils (fig. S8E), indicating that in Intermediate 1, the hydrogen bonding environment is not fully formed and, although cross–β structure may be present, is not yet complete. Differences in water accessibility could be one explanation (40). While there are partial similarities between Intermediate 1 and the fibril, a significant number of residues either exhibit different chemical shifts (dashed boxes in Fig. 5, A and B) or are not observed. These residues are expected to feature an arrangement of side chains, inter-monomer hydrogen bonding, or a non–β sheet structure different to that in fibrils. The fact that most of the protein is not in the final fibril conformation is in line with the low ThT signal of Intermediate 1 samples (Fig. 4) and suggests that the sites necessary for binding of the dye have not fully developed.
While in Intermediate 1, a significant number of residues display distinct chemical shifts from fibril resonances, spectra of Intermediate 2 much more closely resemble those of fully formed fibrils (Fig. 5C). Peaks for residues 38 to 80 in Intermediate 2 were unambiguously assigned from direct comparison to chemical shift data obtained for fibrils (BMRB Entry 50585). A remarkable difference to fibrils is the absence of resonances for residues T81-V95 for both intermediates, implying that the C-terminal conformation found in fibrils is not yet formed. The delayed incorporation of residues T81-V95 into the cross–β fibril core can be attributed to the membrane interaction of hydrophobic residues in the sequence A85-V95 as evidenced by contacts to lipid-CH2 (Fig. 2E). These residues are not part of an ordered structure and become visible upon incorporation into the ordered cross–β fibril core. The mechanism derived from these results is summarized in Fig. 6. For simplicity, the interaction of the C-terminal part of the NAC with membranes is not shown.
The time points for the isolation of Intermediates 1 and 2 are less than or equal to 1 hour apart under aggregation-inducing conditions. Since peaks characteristic to Intermediate 1 (dashed boxes in Fig. 5) do not appear in spectra of Intermediate 2 (Fig. 5, purple), the transition appears in bulk. The early fibrillar Intermediate 2 appears to be competent to rapidly recruit monomeric protein (Fig. 3D). Both isolated intermediate species are stable over several days at room temperature packed in a solid-state rotor, as confirmed in a series of back-to-back acquisitions (fig. S9). Nevertheless, conversion into fibrils occurs within less than 2 months, despite storage at 277 K, suggesting the on-pathway nature of these intermediate aggregates. Freezing of intermediate samples at −80°C, however, ensures their stability past 2 months. Besides the remarkable stability of the intermediates presented here, we want to highlight the good reproducibility of the sample preparation (fig. S10).
DISCUSSION
The successful characterization of a multitude of fibril polymorphs in recent years has significantly improved our knowledge on the intricacies of fibril architectures. Nevertheless, the molecular mechanism underlying αS folding that ultimately leads to amyloid fibrils is poorly understood. Our results give a comprehensive view of filament formation and allow insight into the hierarchy of formation of structural elements during fibrillogenesis in the presence of phospholipids.
Using solution NMR spectroscopy, we show that initial aggregates are formed by the membrane-bound fraction of the protein, while free monomer in solution is recruited only at later stages (Fig. 3, D and E). Such an enhancement of primary nucleation by lipids had been proposed previously by Galvagnion et al. and is likely a combination of crowding on the membrane surface and an altered conformation of the membrane-bound state (20).
Furthermore, we show that membrane binding through an N-terminal helical domain is not only relevant for primary nucleation but also retained in all species relevant to the aggregation process including fibrils. Such a helical domain in aggregates had previously been described for oligomers grown in the absence of lipids, when they were subjected to membranes (15). The presence of a defined membrane-binding domain has been proposed as a cause for the permeabilization of membranes by fibrils and might account for a certain amount of their toxicity (14, 28, 41). The essential role of the N-terminal domain in pathological processes has been indicated in yeast models, where deletion of the first 5 to 11 residues showed almost completely abolished membrane affinity and thereby toxicity (42). Recently, Newberry et al. (43) corroborated these results by the use of deep mutational scanning and argued that any distortion in the lipid-bound state reduces adverse effects by αS. αS oligomers, potential causative agents for such toxicity, display significantly reduced membrane binding and impairment when lacking N termini (15).
Furthermore, we show that not only the N-terminal but also the C-terminal part of the NAC is involved in lipid binding. Both Y39 and F94 have been identified to be important for membrane interaction of αS (44). Moreover, residues N65-K97 have been suggested to be involved in a double-anchor binding mode, in which one αS monomer interacts with two vesicles simultaneously, ultimately leading to their fusion (45). Our results show that the important role in membrane binding of these residues carries on from monomer toward fibrils, highlighting their importance for both function and misfolding.
The finding that all αS species carry a membrane-binding capability in combination with the rapid decrease of the mobile lipid signal (Fig. 3, E and F) is in line with the model of continued lipid extraction throughout the whole aggregation process proposed by Reynolds et al. (46). The mobilization of lipids via such pathways ultimately will result in the rich abundance of lipid membrane fragments found in Lewy bodies and Lewy neurites in patients with PD (47). The decrease in lipid signal intensity is also in line with a rigidification of lipid molecules caused by an insertion of αS into the lipid bilayer, as well as an increase in vesicle diameter, possibly through fusion mediated by αS (45).
The fibrils presented here adopt a filament structure characteristic to the polymorph 2 type published recently (9). Residues L38-V95 were identified by ssNMR to adopt a similar monomer fold, albeit with stark differences in both the C- and the N-terminal regions of the protein (Fig. 1D). These differences can be rationalized by the interaction of these regions with membranes (Fig. 2) and the segmental buildup of αS fibrils (Fig. 6).
We show here that intermediates of αS at the end of the lag phase show a distinct response to ThT, which can be correlated to their respective structures. The sensitivity of ThT toward the cross–β structure of such aggregates stems from its alignment parallel to the fibril axis, where it is surrounded on two sides by a regular repetition of side chains, leading to its rigidification and thus fluorescence (48). Intermediate 1 shows minor reactivity toward ThT, having an unfinished cross–β structure or because of poorly accessible binding sites (Fig. 4). Inaccessibility of any binding pocket could additionally arise from binding of intermediates to the phospholipids. The low ThT response could also hint to an insufficient size of the intermediates, as studies have shown that binding sites of ThT are constituted of about 8 αS monomers (49). In the isolation of defined intermediates based on this minimal response to ThT, we present another useful tool for the isolation of prefibrillar intermediates.
The structure of Intermediate 1 contains two loops including residues E57-E61 and residues V73-K80, respectively (Fig. 6). The observation that the NAC core is part of an early structural element is in good agreement with its well-established crucial role in fibril formation, since its deletion (Δ71-82) strongly diminishes the aggregation propensity of αS (11). Other toxic early aggregates of αS have been shown to incorporate residues V70-I88 as part of their early β sheet structure (15). In contrast to the previous observation of antiparallel β sheet formation in early aggregates, both Intermediates 1 and 2 suggest parallel associations, based on similarity to chemical shifts of fibril (12, 50). It is possible that earlier aggregates carry such structural features; however, further studies are needed to investigate this.
Intermediate 1 further involves residues Y39 and S42, which are adjacent to the NAC region in fibrils of the polymorph 2 type and bind to lipids (Fig. 2E). These residues are located within the region from V37-S42 that was recently identified to have a supporting role for both membrane binding and fibril formation (51). A weak transient contact of these residues with the highly aggregation prone NAC region was identified in αS monomers by the use of paramagnetic relaxation NMR experiments (51, 52). This contact appears to be a segue into fibril formation, hinting toward why these regions are forming a building block of the early fibril structure.
Our finding that the initial structural elements of fibril filaments are formed by several residues in the NAC domain was similarly reported by Comellas et al. (22) for residues T59, V74, A76, A78, A90, and A91. This finding is particularly interesting, since the fibril structure reported in their studies is of polymorph 1 type (turns at K57-K60, G67, K80, and A85-A89, BMRB 17910) as opposed to the polymorph 2 type reported here (turns at K45-E46, K57-E61, G73-V74, and K80-T81, BMRB 50585), indicating that the observed aggregation tendency of these residues is indifferent to the resulting filament structure. This behavior might be explained by the high level of backbone dynamics in the NAC region, which facilitate the conformational rearrangements necessary for the stark structural transition from monomer to aggregate (53). The conformation adopted by these residues upon formation of aggregation intermediates appears to predefine the fibril structure. Therefore, finding the determining factors will be essential in future studies toward understanding the aggregation mechanism of αS.
It has to be emphasized that the intermediates we identified here by no means depict the whole spectrum of species occurring during fibril formation as earlier aggregates carrying lower structural content have been reported (15, 22). The segmental buildup of αS fibrils also suggests that further changes in filament structure past those reported here can be expected, since fibrils are known to mature over long time intervals (54).
In conclusion, we have shown here that αS aggregates on membranes in a segmental manner, interacting with the lipid molecules via distinct binding domains. Our results allow atomic resolution insight into how αS fibrils form and show that an intricate interplay between several key regions forming early in the protein gives rise to the formation of specific folds.
The recently published structures from patients with MSA represent the first ex vivo structures of αS fibrils (55). Despite structural differences to recombinant αS fibrils, the individual filaments bear partially comparable topologies carrying the characteristic three-layered L-shaped or “Greek-key” motif frequently observed in vitro (7, 8). The observation that amyloid filaments adopt conserved folds supports the idea that such folds are an inherent property and can be explained by the segmental buildup shown in this study. However, the driving factors behind the formation of specific structural elements in the cross-sectional fold remain elusive and substantial work is needed to get a true understanding of the mechanism of amyloid formation. This is particularly significant for modulating these pathogenic processes with the goal of drug development for disease treatment or prevention.
MATERIALS AND METHODS
Protein expression and purification
Protein expression and purification were performed as previously described (56). For production of uniformly 15N- and 13C,15N-labeled samples, Toronto minimal medium was used supplemented with 15NH4Cl and 13C6-d-glucose (Cambridge Isotope Laboratories and Sigma-Aldrich). 2H,13C,15N-labeled αS was expressed in Escherichia coli adapted to 100% 2H2O Toronto minimal medium supplemented with 2H7,13C6-d-glucose and 15N-NH4Cl. The obtained protein was dialyzed against buffer [50 mM Hepes and 100 mM NaCl (pH 7.4)] to obtain a 0.3 mM solution, and the resulting solution was stored at −80°C until use.
Preparation of SUVs
POPC and POPA (sodium salt) were obtained from Avanti Polar Lipids and used without further treatment. POPA and POPC were each dissolved in chloroform and mixed to obtain a molar ratio of 1:1 for the lipids. The solvent was evaporated under a N2 stream, and the sample was lyophilized overnight to remove residual solvent. The resulting lipid film was hydrated with buffer [50 mM Hepes and 100 mM NaCl (pH 7.4)], resulting in a concentration of 1.5 mM for both lipids. The solution was sonicated at 37 kHz (four times for 10 min with 15-min breaks or until the sample was translucent) in a glass tube. The resulting solution was filtered through 0.22-μm sterile filters to obtain SUVs. Vesicle size was measured in a DynaPro dynamic light scattering (DLS) instrument (Wyatt Technology) and analyzed using DYNAMICS 6.12.03 displaying an average hydrodynamic diameter of 41 ± 2 nm. For DLS measurements, lipid solutions were diluted to 0.7 mM for the total lipid concentration. For testing of integrity and stability of lipids to oxidation (fig. S11), chloroform/methanol (2:1, v:v) was thoroughly mixed with equal volumes of lipid solution in buffer. After centrifugation for 30 s at 13.2 rpm in an F-45-24-11 Rotor in a 5415 D tabletop centrifuge (both Eppendorf), the supernatant was moved to a clean tube and the procedure was repeated. After centrifugation, the supernatant was again removed, the chloroform phases were combined, and the solvent was evaporated under a N2 stream. The resulting pellet was dissolved in Chloroform-d1 (99.8%, Deutero) and 1H spectra were recorded at a Bruker 400-MHz spectrometer (Avance III HD with PA-TBO BB-HFD probe with a z-gradient) at a field of 9.4 T.
Aggregation assays
Monomeric αS in buffer [50 mM Hepes and 100 mM NaCl (pH 7.4)] was centrifuged for 1 hour at 55,000 rpm using a TLA-100.3 rotor in an Optima MAX-XP tabletop ultracentrifuge (both Beckman Coulter) at 4°C and the supernatant was added to a solution of phospholipid SUVs and NaN3 (0.02 weight %) to obtain a final protein concentration of 70 μM and a molar L/P ratio of 10 if not stated otherwise. Samples were subjected to repeated cycles of 30-s sonication (20 kHz) at 37°C followed by an incubation period of 30 min using a Q700-110 sonication device, with a Microplate Horn Assembly (431MPX) and a Compact Recirculating Chiller (4900-110, all QSonica). All samples were kept in the dark to avoid light-induced damage.
ThT fluorescence
A solution of 1 mM ThT in 50 mM glycine buffer at pH 8.5 was prepared and stored at 4°C under light exclusion until use. ThT concentration was determined using an extinction coefficient ε412 of 36,000 M−1 cm−1. On the day of use, 0.1 ml of the 1 mM ThT solution was mixed with 1.9 ml of buffer to obtain 2-ml aliquots of working solution. Five microliters of the aggregating solution was added to the working solution, and fluorescence emission spectra of the resulting solution were measured using a Varian Cary Eclipse fluorescence spectrometer. Fluorescence was excited at 446 nm and emission was recorded from 460 to 600 nm at room temperature (RT).
The obtained fluorescence intensities were corrected for baseline originating from ThT autofluorescence and plotted against time. The lag times were obtained as the intercept of a linear function fitted to the steepest part of the curve and the abscissa. The average lag time was 6.6 ± 2.0 hours, and the average maximum elongation rate was 18.8 ± 10.7 arbitrary units/h. Aggregation times were divided by the lag time and the rescaled curves were fitted using the online tool Amylofit (www.amylofit.ch.cam.ac.uk/) (35). Best fit was obtained for secondary nucleation dominated aggregation [parameters obtained from fit: nc = 2.0, k+kn = 2.36 × 10¹¹ M−nc s−2, n2 = 8.0, k+k2 = 5.15 × 1059 M(−n2–1) s−2].
Solution NMR spectroscopy
Aliquots of 120 μl were taken directly from the aggregating solution containing 15N-labeled αS and mixed with 20 μl of buffer [50 mM Hepes and 100 mM NaCl (pH 7.4)] to obtain samples with 10% D2O and 100 μM 2,2-dimethyl-2-silapentane-5-sulfonate sodium salt (IUPAC: 3-(trimethylsilyl)propane-1-sulfonate, sodium salt). Experiments were recorded on a Bruker 700-MHz spectrometer (Avance III HD with CP-TCI HCND probe with z-gradient) at a field of 16.4 T. Temperature during measurements was kept at 288 K. 1H spectra were acquired using presaturation for water suppression and 64 scans with a relaxation delay of 2.2 s. 1H-15N-HSQC spectra were acquired using 3-9-19 watergate for water suppression using 256 increments in the indirect dimension and a relaxation delay of 1.2 s. 2D datasets were processed in NMRPipe and analyzed in CcpNmr Analysis (57, 58). Peak lists were exported and analyzed using a custom-written python script. Assignment of the 1H- and 15N-backbone resonances was done by comparison to BMRB entries 16300, 16904, and 18857.
CD spectroscopy
Aliquots of 20 μl were taken directly from the aggregating solution and mixed with 160 μl of buffer [10 mM phosphate (pH 7.4)]. Spectra were acquired on a J-815-150S (JASCO), with a single-position Peltier cell holder (PTC-514) for temperature control. Samples were measured in 110-QX cuvettes (Hellma) with a path length of 1 mm in the range of 180 to 260 nm at 298 K and a scanning speed of 20 nm/min with five accumulations.
Atomic force microscopy
Preparation of samples for AFM imaging was performed as previously described (34). Aliquots of 70 μl were taken directly from the aggregating solution and subsequently incubated on freshly cleaved slabs of mica, fixed on stainless steel metal discs (d = 15 mm) by 2 Ton Epoxy (Devcon). After incubation for 20 min at RT, samples were thoroughly rinsed with buffer [10 mM Hepes, 150 mM NaCl, and 1 mM MgCl2 (pH 7.4)].
Height images were acquired in liquid using intermittent mode (AC mode) on a Nanowizard 4 with a Vortis SPMControl station (both JPK BioAFM). The instrument was mounted on a halcyonics_i4 vibration isolation unit (Accurion) and encased in a custom-made acoustic enclosure hood. Measurements were carried out using BioLever Mini cantilevers (Olympus, BL-AC40TS-C2) with a spring constant of 0.09 N/m and a resonance frequency of 100 kHz, mounted on a super-cut glass cantilever holder (JPK BioAFM). Images were analyzed and processed using JPKSPM Data Processing software (version 6.0.69-1, JPK BioAFM).
The protein height analysis was performed following a modified procedure described by Shabardina et al. (59). From the analysis of six AFM images, a mean protein height of 1.5 ± 0.3 nm (mean height ± SE) was determined.
Transmission electron microscopy
Samples were adsorbed onto 400-mesh carbon-coated copper grids, and the buffer was removed using a filter paper. Subsequently, samples were stained by the addition of 1% uranyl acetate aq solution, which was subsequently dried with a filter paper. If image quality was low or micrographs were too crowded, samples were washed with water and diluted by a factor of 1:50 in buffer before measurement. Images were taken at RT via a Talos L120C transmission microscope (Thermo Fisher Scientific/FEI) using a Ceta 4k × 4k complementary metal-oxide semiconductor camera in unbinning mode.
Micrographs were processed and analyzed using the Fiji distribution of ImageJ using the Plot profile function (60). For highly curved fibrils, a segmented line was used to generate profiles. The obtained profile plots were aligned, averaged, and plotted in Origin(Pro) 8.5 (OriginLab Corporation, Northampton, MA, USA) and fitted to a sinusoidal function to quantify the fibril pitch.
ssNMR spectroscopy
For isolation of intermediates, aggregation was monitored regularly by ThT fluorescence as described above. As soon as an increase in fluorescence intensity was detected, incubation was halted by cooling samples on ice and immediately centrifuging at 55,000 rpm (TLA-100.3 rotor in an Optima MAX-TL) for 1 hour at 4°C. For preparation of fibrils, aggregation was continued for 96 hours, followed by similar treatment. After removal of the supernatant, samples were washed with fresh buffer [5 mM Hepes (pH 7.4)] and subsequently centrifuged (10 min, 65,000 rpm, 18°C). Excess moisture was carefully removed, and samples were packed into ssNMR rotors by cutting off the bottom of the tube and centrifuging the pellet directly into the rotor of choice through a custom-made filling device made from a truncated pipette tip. Last, the sample was centrifuged into the rotor in an ultracentrifuge packing device for 30 min at 24,000 rpm in an SW 32 Ti rotor in an Optima L-80 XP Ultracentrifuge (both Beckman Coulter) (61). The molar L/P ratio for αS fibril samples was lowered from 10:1 to 5:1 to increase the amount of protein in solid-state rotors for enhanced signal after confirming that fibril structure is conserved at lower ratios (fig. S9). In case of monomeric αS, protein was dialyzed against salt-free buffer [5 mM Hepes (pH 7.4)], mixed with SUVs at a molar L/P ratio of 50:1 and subsequently lyophilized. The high L/P ratio for monomer samples was used to ensure that most αS monomers are bound to lipid. The resulting powder was rehydrated with salt-free buffer and used similar to pellets of aggregated samples.
3D (H)CANH, (HCO)CA(CO)NH, (H)CONH, (H)CO(CA)NH, (HCA)CB(CA)NH, and (HCA)CB(CACO)NH experiments (62) for protein sequence assignment and 3D H(H)NH (using 25 ms of NOE mixing) experiments for identification of lipid interactions were acquired on 2H,13C,15N-labeled αS on an 800-MHz Bruker Avance III HD spectrometer at a magnetic field of 18.8 T equipped with a 1.3-mm magic-angle spinning (MAS) HCN probe and MAS at 55 kHz. The temperature of the cooling gas was set to 250 K, resulting in an estimated sample temperature of 20°C. The delays for scalar carbon-carbon transfers were optimized on the basis of the T2′ values of 33 ms for Cα and 53 ms for C′.
For protein sequence assignment on protonated fibrils 3D (H)CANH, (HCO)CA(CO)NH spectra were acquired using 13C,15N-labeled αS on a 950-MHz Bruker Avance III HD spectrometer at a magnetic field of 22.3 T equipped with a 0.7-mm HCDN probe and MAS at 100 kHz. The temperature of the cooling gas was set to 250 K, resulting in an estimated sample temperature of 20°C. Chemical shift data for 13CO, 13Cα, and 13Cβ obtained from sequence assignment spectra were used in TALOS+ to obtain predictions on secondary structure as well as dihedral backbone angles (24).
All 2D 13C13C-DARR spectra as well as the 2D (H)NCA spectrum for monomeric αS were acquired on an 850-MHz Avance III spectrometer with a 3.2-mm MAS HCN probe at a magnetic field of 20.0 T and MAS at 17 kHz. DARR spectra for all samples were acquired with mixing times of 20 ms. Furthermore, we acquired spectra with mixing times of 200 ms for fibrils and monomers as well as 5 and 50 ms for monomers.
Spectra were acquired in short blocks, which were each corrected for linear drift of the static magnetic field using an in-house program executed from the command line in Bruker Topspin (63). The drift-corrected blocks were then averaged and processed as one spectrum. Spectra were analyzed using CcpNmr Analysis and NMRFAM-Sparky (64). Detailed parameters for all NMR experiments as well as the accumulated time of the averaged spectra are listed in table S2. CP transfer conditions are listed in table S3. Assigned chemical shift data (HN, Cα, Cβ, C′) for αS fibrils were deposited in the BMRB under the accession number 50585.
Acknowledgments
We thank M. Wegstroth for the preparation of isotope-labeled α-synuclein stock solutions and G. Heim for taking negative-stain electron micrographs. Funding: This work was supported by project A04 of the SFB 803 (to L.B.A. and C.G.), the Emmy Noether program (grant AN1316/1-1 to L.B.A.), and Germany’s Excellence Strategy EXC 2067/1- 390729940 of the Deutsche Forschungsgemeinschaft (DFG, German Research Foundation to C.G. and C.S.) as well as the Max Planck Society (to C.G.). Author contributions: L.A., L.B.A., and C.G. designed the study. L.A. performed protein aggregation assays, solution NMR experiments, CD, AFM, and ThT measurements. L.A. and V.S. prepared protein samples for ssNMR and analyzed spectra. L.A., R.D., V.S., and K.T.M. prepared rotors and performed ssNMR experiments. D.R. acquired EM micrographs. I.M. and C.S. performed a histogram analysis of AFM images. S.B. oversaw protein production. L.B.A. oversaw ssNMR experiments. L.A. interpreted the data and wrote the initial draft. L.A., R.D., V.S., K.T.M., S.B., L.B.A., C.S., D.R., and C.G. reviewed and edited the manuscript. Competing interests: The authors declare that they have no competing interests. Data and materials availability: Assigned chemical shift data (HN, Cα, Cβ, and C′) for αS fibrils were deposited in the BMRB under the accession number 50585. All data needed to evaluate the conclusions in the paper are present in the paper and/or the Supplementary Materials. Additional data related to this paper may be requested from the authors.
SUPPLEMENTARY MATERIALS
Supplementary material for this article is available at http://advances.sciencemag.org/cgi/content/full/7/20/eabg2174/DC1
REFERENCES AND NOTES
- 1.Jakes R., Spillantini M. G., Goedert M., Identification of two distinct synucleins from human brain. FEBS Lett. 345, 27–32 (1994). [DOI] [PubMed] [Google Scholar]
- 2.Spillantini M. G., Schmidt M. L., Lee V. M. Y., Trojanowski J. Q., Jakes R., Goedert M., α-synuclein in Lewy bodies. Nature 388, 839–840 (1997). [DOI] [PubMed] [Google Scholar]
- 3.Gibb W. R. G., Esiri M. M., Lees A. J., Clinical and pathological features of diffuse cortical Lewy body disease (Lewy body dementia). Brain 110, 1131–1153 (1987). [DOI] [PubMed] [Google Scholar]
- 4.Gómez-Tortosa E., Newell K., Irizarry M. C., Sanders J. L., Hyman B. T., α-Synuclein immunoreactivity in dementia with Lewy bodies: Morphological staging and comparison with ubiquitin immunostaining. Acta Neuropathol. 99, 352–357 (2000). [DOI] [PubMed] [Google Scholar]
- 5.Fanciulli A., Wenning G. K., Multiple-system atrophy. New Engl. J. Med. 372, 249–263 (2015). [DOI] [PubMed] [Google Scholar]
- 6.Graham J. G., Oppenheimer D. R., Orthostatic hypotension and nicotine sensitivity in a case of multiple system atrophy. J. Neurol. Neurosurg. Psychiatry 32, 28–34 (1969). [DOI] [PMC free article] [PubMed] [Google Scholar]
- 7.Tuttle M. D., Comellas G., Nieuwkoop A. J., Covell D. J., Berthold D. A., Kloepper K. D., Courtney J. M., Kim J. K., Barclay A. M., Kendall A., Wan W., Stubbs G., Schwieters C. D., Lee V. M. Y., George J. M., Rienstra C. M., Solid-state NMR structure of a pathogenic fibril of full-length human α-synuclein. Nat. Struct. Mol. Biol. 23, 409–415 (2016). [DOI] [PMC free article] [PubMed] [Google Scholar]
- 8.Li B., Ge P., Murray K. A., Sheth P., Zhang M., Nair G., Sawaya M. R., Shin W. S., Boyer D. R., Ye S., Eisenberg D. S., Zhou Z. H., Jiang L., Cryo-EM of full-length α-synuclein reveals fibril polymorphs with a common structural kernel. Nat. Commun. 9, 3609 (2018). [DOI] [PMC free article] [PubMed] [Google Scholar]
- 9.Guerrero-Ferreira R., Taylor N. M. I., Arteni A.-A., Kumari P., Mona D., Ringler P., Britschgi M., Lauer M. E., Makky A., Verasdonck J., Riek R., Melki R., Meier B. H., Böckmann A., Bousset L., Stahlberg H., Two new polymorphic structures of human full-length alpha-synuclein fibrils solved by cryo-electron microscopy. eLife 8, e48907 (2019). [DOI] [PMC free article] [PubMed] [Google Scholar]
- 10.Ke P. C., Sani M.-A., Ding F., Kakinen A., Javed I., Separovic F., Davis T. P., Mezzenga R., Implications of peptide assemblies in amyloid diseases. Chem. Soc. Rev. 46, 6492–6531 (2017). [DOI] [PMC free article] [PubMed] [Google Scholar]
- 11.Giasson B. I., Murray I. V. J., Trojanowski J. Q., Lee V. M. Y., A hydrophobic stretch of 12 amino acid residues in the middle of α-synuclein is essential for filament assembly. J. Biol. Chem. 276, 2380–2386 (2001). [DOI] [PubMed] [Google Scholar]
- 12.Chen S. W., Drakulic S., Deas E., Ouberai M., Aprile F. A., Arranz R., Ness S., Roodveldt C., Guilliams T., De-Genst E. J., Klenerman D., Wood N. W., Knowles T. P. J., Alfonso C., Rivas G., Abramov A. Y., Valpuesta J. M., Dobson C. M., Cremades N., Structural characterization of toxic oligomers that are kinetically trapped during α-synuclein fibril formation. Proc. Natl. Acad. Sci. U.S.A. 112, E1994–E2003 (2015). [DOI] [PMC free article] [PubMed] [Google Scholar]
- 13.Plotegher N., Greggio E., Bisaglia M., Bubacco L., Biophysical groundwork as a hinge to unravel the biology of α-synuclein aggregation and toxicity. Q. Rev. Biophys. 47, 1–48 (2014). [DOI] [PubMed] [Google Scholar]
- 14.Roberts H., Brown D., Seeking a mechanism for the toxicity of oligomeric α-synuclein. Biomolecules 5, 282–305 (2015). [DOI] [PMC free article] [PubMed] [Google Scholar]
- 15.Fusco G., Chen S. W., Williamson P. T. F., Cascella R., Perni M., Jarvis J. A., Cecchi C., Vendruscolo M., Chiti F., Cremades N., Ying L., Dobson C. M., De Simone A., Structural basis of membrane disruption and cellular toxicity by α-synuclein oligomers. Science 358, 1440–1443 (2017). [DOI] [PubMed] [Google Scholar]
- 16.Lashuel H. A., Petre B. M., Wall J., Simon M., Nowak R. J., Walz T., Lansbury P. T. Jr., α-Synuclein, especially the Parkinson’s disease-associated mutants, forms pore-like annular and tubular protofibrils. J. Mol. Biol. 322, 1089–1102 (2002). [DOI] [PubMed] [Google Scholar]
- 17.Sulzer D., Edwards R. H., The physiological role of α-synuclein and its relationship to Parkinson’s disease. J. Neurochem. 150, 475–486 (2019). [DOI] [PMC free article] [PubMed] [Google Scholar]
- 18.Perrin R. J., Woods W. S., Clayton D. F., George J. M., Interaction of human α-synuclein and Parkinson’s disease variants with phospholipids. Structural analysis using site-directed mutagenesis. J. Biol. Chem. 275, 34393–34398 (2000). [DOI] [PubMed] [Google Scholar]
- 19.Eliezer D., Kutluay E., Bussell R., Browne G., Conformational properties of α-synuclein in its free and lipid-associated states. J. Mol. Biol. 307, 1061–1073 (2001). [DOI] [PubMed] [Google Scholar]
- 20.Galvagnion C., Buell A. K., Meisl G., Michaels T. C. T., Vendruscolo M., Knowles T. P. J., Dobson C. M., Lipid vesicles trigger α-synuclein aggregation by stimulating primary nucleation. Nat. Chem. Biol. 11, 229–234 (2015). [DOI] [PMC free article] [PubMed] [Google Scholar]
- 21.Galvagnion C., Brown J. W. P., Ouberai M. M., Flagmeier P., Vendruscolo M., Buell A. K., Sparr E., Dobson C. M., Chemical properties of lipids strongly affect the kinetics of the membrane-induced aggregation of α-synuclein. Proc. Natl. Acad. Sci. U.S.A. 113, 7065–7070 (2016). [DOI] [PMC free article] [PubMed] [Google Scholar]
- 22.Comellas G., Lemkau L. R., Zhou D. H., George J. M., Rienstra C. M., Structural intermediates during α-synuclein fibrillogenesis on phospholipid vesicles. J. Am. Chem. Soc. 134, 5090–5099 (2012). [DOI] [PMC free article] [PubMed] [Google Scholar]
- 23.Zhou D. H., Shah G., Cormos M., Mullen C., Sandoz D., Rienstra C. M., Proton-detected solid-state NMR spectroscopy of fully protonated proteins at 40 kHz magic-angle spinning. J. Am. Chem. Soc. 129, 11791–11801 (2007). [DOI] [PubMed] [Google Scholar]
- 24.Shen Y., Delaglio F., Cornilescu G., Bax A., TALOS+: A hybrid method for predicting protein backbone torsion angles from NMR chemical shifts. J. Biomol. NMR 44, 213–223 (2009). [DOI] [PMC free article] [PubMed] [Google Scholar]
- 25.Gath J., Bousset L., Habenstein B., Melki R., Meier B. H., Böckmann A., Yet another polymorph of α-synuclein: Solid-state sequential assignments. Biomol. NMR Assign. 8, 395–404 (2014). [DOI] [PubMed] [Google Scholar]
- 26.Boyer D. R., Li B., Sun C., Fan W., Zhou K., Hughes M. P., Sawaya M. R., Jiang L., Eisenberg D. S., The α-synuclein hereditary mutation E46K unlocks a more stable, pathogenic fibril structure. Proc. Natl. Acad. Sci. U.S.A. 117, 3592–3602 (2020). [DOI] [PMC free article] [PubMed] [Google Scholar]
- 27.Seuring C., Verasdonck J., Ringler P., Cadalbert R., Stahlberg H., Böckmann A., Meier B. H., Riek R., Amyloid fibril polymorphism: Almost identical on the atomic level, mesoscopically very different. J. Phys. Chem. B 121, 1783–1792 (2017). [DOI] [PubMed] [Google Scholar]
- 28.Chaari A., Horchani H., Frikha F., Verger R., Gargouri Y., Ladjimi M., Surface behavior of α-synuclein and its interaction with phospholipids using the Langmuir monolayer technique: A comparison between monomeric and fibrillar α-synuclein. Int. J. Biol. Macromol. 58, 190–198 (2013). [DOI] [PubMed] [Google Scholar]
- 29.Iyer A., Claessens M. M. A. E., Disruptive membrane interactions of alpha-synuclein aggregates. Biochim. Biophys. Acta Proteins Proteomics 1867, 468–482 (2019). [DOI] [PubMed] [Google Scholar]
- 30.Najbauer E. E., Movellan K. T., Schubeis T., Schwarzer T., Castiglione K., Giller K., Pintacuda G., Becker S., Andreas L. B., Probing membrane protein insertion into lipid bilayers by solid-state NMR. ChemPhysChem 20, 302–310 (2019). [DOI] [PubMed] [Google Scholar]
- 31.Paulson E. K., Morcombe C. R., Gaponenko V., Dancheck B., Byrd R. A., Zilm K. W., High-sensitivity observation of dipolar exchange and NOEs between exchangeable protons in proteins by 3D solid-state NMR spectroscopy. J. Am. Chem. Soc. 125, 14222–14223 (2003). [DOI] [PubMed] [Google Scholar]
- 32.Flyvbjerg H., Jobs E., Leibler S., Kinetics of self-assembling microtubules: An “inverse problem” in biochemistry. Proc. Natl. Acad. Sci. U.S.A. 93, 5975–5979 (1996). [DOI] [PMC free article] [PubMed] [Google Scholar]
- 33.Bodner C. R., Dobson C. M., Bax A., Multiple tight phospholipid-binding modes of α-synuclein revealed by solution NMR spectroscopy. J. Mol. Biol. 390, 775–790 (2009). [DOI] [PMC free article] [PubMed] [Google Scholar]
- 34.Quist A., Doudevski I., Lin H., Azimova R., Ng D., Frangione B., Kagan B., Ghiso J., Lal R., Amyloid ion channels: A common structural link for protein-misfolding disease. Proc. Natl. Acad. Sci. U.S.A. 102, 10427–10432 (2005). [DOI] [PMC free article] [PubMed] [Google Scholar]
- 35.Meisl G., Kirkegaard J. B., Arosio P., Michaels T. C. T., Vendruscolo M., Dobson C. M., Linse S., Knowles T. P. J., Molecular mechanisms of protein aggregation from global fitting of kinetic models. Nat. Protoc. 11, 252–272 (2016). [DOI] [PubMed] [Google Scholar]
- 36.Wishart D. S., Sykes B. D., The 13C chemical-shift index: A simple method for the identification of protein secondary structure using 13C chemical-shift data. J. Biomol. NMR 4, 171–180 (1994). [DOI] [PubMed] [Google Scholar]
- 37.Fusco G., De Simone A., Gopinath T., Vostrikov V., Vendruscolo M., Dobson C. M., Veglia G., Direct observation of the three regions in α-synuclein that determine its membrane-bound behaviour. Nat. Commun. 5, 3827 (2014). [DOI] [PMC free article] [PubMed] [Google Scholar]
- 38.Drescher M., Godschalk F., Veldhuis G., van Rooijen B. D., Subramaniam V., Huber M., Spin-label EPR on α-synuclein reveals differences in the membrane binding affinity of the two antiparallel helices. Chembiochem 9, 2411–2416 (2008). [DOI] [PubMed] [Google Scholar]
- 39.Jao C. C., Hegde B. G., Chen J., Haworth I. S., Langen R., Structure of membrane-bound α-synuclein from site-directed spin labeling and computational refinement. Proc. Natl. Acad. Sci. U.S.A. 105, 19666–19671 (2008). [DOI] [PMC free article] [PubMed] [Google Scholar]
- 40.Kashid S. M., Bagchi S., Experimental determination of the electrostatic nature of carbonyl hydrogen-bonding interactions using IR-NMR correlations. J. Phys. Chem. Lett. 5, 3211–3215 (2014). [DOI] [PubMed] [Google Scholar]
- 41.Lorenzen N., Nielsen S. B., Buell A. K., Kaspersen J. D., Arosio P., Vad B. S., Paslawski W., Christiansen G., Valnickova-Hansen Z., Andreasen M., Enghild J. J., Pedersen J. S., Dobson C. M., Knowles T. P. J., Otzen D. E., The role of stable α-synuclein oligomers in the molecular events underlying amyloid formation. J. Am. Chem. Soc. 136, 3859–3868 (2014). [DOI] [PubMed] [Google Scholar]
- 42.Vamvaca K., Volles M. J., Lansbury P. T., The first N-terminal amino acids of α-synuclein are essential for α-helical structure formation in vitro and membrane binding in yeast. J. Mol. Biol. 389, 413–424 (2009). [DOI] [PMC free article] [PubMed] [Google Scholar]
- 43.Newberry R. W., Leong J. T., Chow E. D., Kampmann M., DeGrado W. F., Deep mutational scanning reveals the structural basis for α-synuclein activity. Nat. Chem. Biol. 16, 653–659 (2020). [DOI] [PMC free article] [PubMed] [Google Scholar]
- 44.Fonseca-Ornelas L., Eisbach S. E., Paulat M., Giller K., Fernández C. O., Outeiro T. F., Becker S., Zweckstetter M., Small molecule-mediated stabilization of vesicle-associated helical α-synuclein inhibits pathogenic misfolding and aggregation. Nat. Commun. 5, 5857 (2014). [DOI] [PubMed] [Google Scholar]
- 45.Fusco G., Pape T., Stephens A. D., Mahou P., Costa A. R., Kaminski C. F., Kaminski Schierle G. S., Vendruscolo M., Veglia G., Dobson C. M., De Simone A., Structural basis of synaptic vesicle assembly promoted by α-synuclein. Nat. Commun. 7, 12563 (2016). [DOI] [PMC free article] [PubMed] [Google Scholar]
- 46.Reynolds N. P., Soragni A., Rabe M., Verdes D., Liverani E., Handschin S., Riek R., Seeger S., Mechanism of membrane interaction and disruption by α-synuclein. J. Am. Chem. Soc. 133, 19366–19375 (2011). [DOI] [PubMed] [Google Scholar]
- 47.Shahmoradian S. H., Lewis A. J., Genoud C., Hench J., Moors T. E., Navarro P. P., Castaño-Díez D., Schweighauser G., Graff-Meyer A., Goldie K. N., Sütterlin R., Huisman E., Ingrassia A., Gier Y. d., Rozemuller A. J. M., Wang J., Paepe A. D., Erny J., Staempfli A., Hoernschemeyer J., Großerüschkamp F., Niedieker D., El-Mashtoly S. F., Quadri M., Van Ijcken W. F. J., Bonifati V., Gerwert K., Bohrmann B., Frank S., Britschgi M., Stahlberg H., Van de Berg W. D. J., Lauer M. E., Lewy pathology in Parkinson’s disease consists of crowded organelles and lipid membranes. Nat. Neurosci. 22, 1099–1109 (2019). [DOI] [PubMed] [Google Scholar]
- 48.Peccati F., Pantaleone S., Riffet V., Solans-Monfort X., Contreras-García J., Guallar V., Sodupe M., Binding of thioflavin T and related probes to polymorphic models of amyloid-β fibrils. J. Phys. Chem. B 121, 8926–8934 (2017). [DOI] [PubMed] [Google Scholar]
- 49.Sulatskaya A. I., Rodina N. P., Sulatsky M. I., Povarova O. I., Antifeeva I. A., Kuznetsova I. M., Turoverov K. K., Investigation of α-synuclein amyloid fibrils using the fluorescent probe thioflavin T. Int. J. Mol. Sci. 19, 2486 (2018). [DOI] [PMC free article] [PubMed] [Google Scholar]
- 50.Celej M. S., Sarroukh R., Goormaghtigh E., Fidelio G. D., Ruysschaert J.-M., Raussens V., Toxic prefibrillar α-synuclein amyloid oligomers adopt a distinctive antiparallel β-sheet structure. Biochem. J. 443, 719–726 (2012). [DOI] [PubMed] [Google Scholar]
- 51.Doherty C. P. A., Ulamec S. M., Maya-Martinez R., Good S. C., Makepeace J., Khan G. N., van Oosten-Hawle P., Radford S. E., Brockwell D. J., A short motif in the N-terminal region of α-synuclein is critical for both aggregation and function. Nat. Struct. Mol. Biol. 27, 249–259 (2020). [DOI] [PMC free article] [PubMed] [Google Scholar]
- 52.Esteban-Martín S., Silvestre-Ryan J., Bertoncini C. W., Salvatella X., Identification of fibril-like tertiary contacts in soluble monomeric α-synuclein. Biophys. J. 105, 1192–1198 (2013). [DOI] [PMC free article] [PubMed] [Google Scholar]
- 53.Rezaei-Ghaleh N., Parigi G., Soranno A., Holla A., Becker S., Schuler B., Luchinat C., Zweckstetter M., Local and global dynamics in intrinsically disordered synuclein. Angew. Chem. Int. Ed. 57, 15262–15266 (2018). [DOI] [PubMed] [Google Scholar]
- 54.Sidhu A., Segers-Nolten I., Raussens V., Claessens M. M. A. E., Subramaniam V., Distinct mechanisms determine α-synuclein fibril morphology during growth and maturation. ACS Chem. Neurosci. 8, 538–547 (2017). [DOI] [PubMed] [Google Scholar]
- 55.Schweighauser M., Shi Y., Tarutani A., Kametani F., Murzin A. G., Ghetti B., Matsubara T., Tomita T., Ando T., Hasegawa K., Murayama S., Yoshida M., Hasegawa M., Scheres S. H. W., Goedert M., Structures of α-synuclein filaments from multiple system atrophy. Nature 585, 464–469 (2020). [DOI] [PMC free article] [PubMed] [Google Scholar]
- 56.Hoyer W., Antony T., Cherny D., Heim G., Jovin T. M., Subramaniam V., Dependence of α-synuclein aggregate morphology on solution conditions. J. Mol. Biol. 322, 383–393 (2002). [DOI] [PubMed] [Google Scholar]
- 57.Delaglio F., Grzesiek S., Vuister G. W., Zhu G., Pfeifer J., Bax A., NMRPipe: A multidimensional spectral processing system based on UNIX pipes. J. Biomol. NMR 6, 277–293 (1995). [DOI] [PubMed] [Google Scholar]
- 58.Vranken W. F., Boucher W., Stevens T. J., Fogh R. H., Pajon A., Llinas M., Ulrich E. L., Markley J. L., Ionides J., Laue E. D., The CCPN data model for NMR spectroscopy: Development of a software pipeline. Proteins 59, 687–696 (2005). [DOI] [PubMed] [Google Scholar]
- 59.Shabardina V., Kramer C., Gerdes B., Braunger J., Cordes A., Schäfer J., Mey I., Grill D., Gerke V., Steinem C., Mode of ezrin-membrane interaction as a function of PIP2 binding and pseudophosphorylation. Biophys. J. 110, 2710–2719 (2016). [DOI] [PMC free article] [PubMed] [Google Scholar]
- 60.Schindelin J., Arganda-Carreras I., Frise E., Kaynig V., Longair M., Pietzsch T., Preibisch S., Rueden C., Saalfeld S., Schmid B., Tinevez J.-Y., White D. J., Hartenstein V., Eliceiri K., Tomancak P., Cardona A., Fiji: An open-source platform for biological-image analysis. Nat. Methods 9, 676–682 (2012). [DOI] [PMC free article] [PubMed] [Google Scholar]
- 61.Böckmann A., Gardiennet C., Verel R., Hunkeler A., Loquet A., Pintacuda G., Emsley L., Meier B. H., Lesage A., Characterization of different water pools in solid-state NMR protein samples. J. Biomol. NMR 45, 319–327 (2009). [DOI] [PubMed] [Google Scholar]
- 62.Barbet-Massin E., Pell A. J., Retel J. S., Andreas L. B., Jaudzems K., Franks W. T., Nieuwkoop A. J., Hiller M., Higman V., Guerry P., Bertarello A., Knight M. J., Felletti M., Le Marchand T., Kotelovica S., Akopjana I., Tars K., Stoppini M., Bellotti V., Bolognesi M., Ricagno S., Chou J. J., Griffin R. G., Oschkinat H., Lesage A., Emsley L., Herrmann T., Pintacuda G., Rapid proton-detected NMR assignment for proteins with fast magic angle spinning. J. Am. Chem. Soc. 136, 12489–12497 (2014). [DOI] [PMC free article] [PubMed] [Google Scholar]
- 63.Najbauer E. E., Andreas L. B., Correcting for magnetic field drift in magic-angle spinning NMR datasets. J. Magn. Reson. 305, 1–4 (2019). [DOI] [PubMed] [Google Scholar]
- 64.Lee W., Tonelli M., Markley J. L., NMRFAM-SPARKY: Enhanced software for biomolecular NMR spectroscopy. Bioinformatics 31, 1325–1327 (2014). [DOI] [PMC free article] [PubMed] [Google Scholar]
- 65.Roos M., Mandala V. S., Hong M., Determination of long-range distances by fast magic-angle-spinning radiofrequency-driven 19F–19F dipolar recoupling NMR. J. Phys. Chem. B 122, 9302–9313 (2018). [DOI] [PMC free article] [PubMed] [Google Scholar]
Associated Data
This section collects any data citations, data availability statements, or supplementary materials included in this article.
Supplementary Materials
Supplementary material for this article is available at http://advances.sciencemag.org/cgi/content/full/7/20/eabg2174/DC1