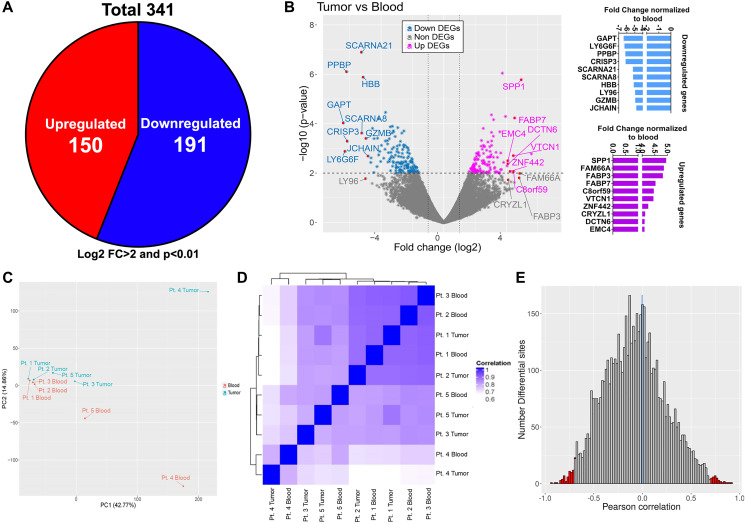
Figure 2. Transcriptome profile of matched tumor and blood CD4+ T cells and correlation with methylation dataset.
(A) Total number of dysregulated genes (both up and down regulated; numbers shown in the pie chart) in tumor associated CD4+ T cells compared to blood CD4+ T cells. Only genes having log2 fold change > 2 and p value < 0.01 were included. (B) Volcano plot showing all the differentially expressed genes (both down- light blue and upregulated- pink). Top 10 dysregulated genes are marked with arrows in the volcano plot and their fold change values normalized to blood is shown in the bar graphs on the right. Principal component analysis (C) and hierarchical clustering (D) of tumor and blood samples based on RNA-seq profile of CD4+ T cells from tumor (blue) and blood (red). (E) Pearson correlation of gene expression and differential methylation (differential methylation sites within 10 kb upstream and 100 bp downstream of the nearest gene); red vertical lines indicate positive (right corner) and negative (left corner) correlation beyond 0.7.

