

Abstract
Cancer cells characteristically consume glucose through Warburg metabolism1, a process forming the basis of tumor imaging by positron emission tomography (PET). Tumor infiltrating immune cells also rely on glucose, and impaired immune cell metabolism in the tumor microenvironment (TME) contributes to tumor immunological evasion2–4. It remains uncertain, however, if immune cell metabolism is dysregulated in the TME by cell intrinsic programs or by competition with cancer cells for limiting nutrients. Here we used PET tracers to measure access and uptake of glucose and glutamine by specific cell subsets in the TME. Surprisingly, myeloid cells had the greatest capacity to uptake intra-tumoral glucose, followed by T cells and cancer cells across a range of cancer models. Cancer cells, in contrast, demonstrated the highest glutamine uptake. This distinct nutrient partitioning was cell intrinsically programmed through mTORC1 signaling and glucose and glutamine-related gene expression. Inhibiting glutamine uptake enhanced glucose uptake across tumor resident cell types, demonstrating that glutamine metabolism suppresses glucose uptake without glucose being limiting in the TME. Thus, cell intrinsic programs drive the preferential immune and cancer cell acquisition of glucose and glutamine, respectively. Cell selective partitioning of these nutrients may be exploited to develop therapies and imaging strategies to enhance or monitor the metabolic programs and activities of specific cell populations in the TME.
Keywords: glucose uptake, glutamine uptake, cancer metabolism
The founding observation in cancer metabolism was that tumors consume glucose to produce lactate in the presence of oxygen. Aerobic glycolysis is widely observed in rapidly proliferating cells, including activated immune cells, to support biosynthetic demands1. In vivo carbon labeling studies have confirmed that glucose supports anabolic metabolism in transformed cells and T cells5,6. Glutamine metabolism provides anaplerotic fuel, and restrains glucose-dependent differentiation and function of macrophages and T cells7–9. These metabolic pathways may become disrupted in immune cells in the TME to prevent anti-tumor immunity2–4,10.
Glucose uptake can be measured using [18F]fluorodeoxyglucose (FDG) positron emission tomography (PET) imaging to detect cancers and monitor therapeutic responses. Depletion of TME glucose by cancer cells may drive nutrient competition as a metabolic mechanism of immunosuppression3,4. High micromolar to millimolar glucose concentration have been measured in mouse and human TME2,11,12. Further, the metabolic phenotypes of T cells can persist even after removal from the TME and culture in nutrient-replete media2,13. The extent of intrinsic metabolic programming or nutrient competition for limited nutrients between cancer cells and immune cells remains uncertain. Here we used PET probes to directly measure glucose and glutamine uptake in TME cell subsets.
Nutrients partition in the TME
Immune cells may contribute significantly to glucose consumption in the TME. We measured nutrient abundance in the tissue interstitial fluid (IF) from freshly resected human renal cell carcinoma (RCC) specimens and subcutaneous murine MC38 tumors using mass spectrometry15 (Figure 1a–b, Supplementary Information Table 1). Glucose, glutamine, and lactate were all detectable in the TME at similar concentrations to matched normal kidney tissue or plasma. In vivo glucose uptake was next directly measured to quantify the accessibility of glucose to distinct cell populations in the TME. Subcutaneous MC38 tumors were visualized by FDG-PET imaging and per cell in vivo 18F radioactivity was measured in fractionated tumor cell subsets (Figure 1c, d). CD45 positive selection magnetic microbeads fractionated tumor cells into enriched CD45−, predominantly cancer cell, and CD45+ immune cell populations (Figure 1e, Extended Data Figure 1a). Unfractionated tumor cells demonstrated higher FDG avidity than control tissue splenocytes (Figure 1f). Strikingly, tumor infiltrating CD45+ immune cells had greater per cell FDG uptake than CD45− cells. FDG autoradiography and immunohistochemistry demonstrated homogenous distribution of FDG and CD45+ cells, showing differential uptake was not due to spatial distribution favoring immune cells (Figure 1g–h). Immune cells also had higher FDG avidity in CT26 and Renca subcutaneous tumors (Figure 1i–j, Extended Data Figure 1b–c) and orthotopic Renca tumors demonstrated higher per cell FDG avidity in immune cells (Figure 1k, Extended Data Figure 1d). Infiltrating immune cells had higher FDG uptake than EPCAM+ cancer cells in both azoxymethane/dextran sodium sulfate-induced (AOM/DSS) inflammatory colon cancer tumors and PyMT genetically engineered mouse model (GEMM) breast cancer models (Figure 1l–m, Extended Data Figure 1e–g). These results show that glucose is available in the TME and preferentially partitions into infiltrating immune cells more than cancer cells across multiple models.
Fig. 1 |. Glucose is preferentially consumed by immune over cancer cells.
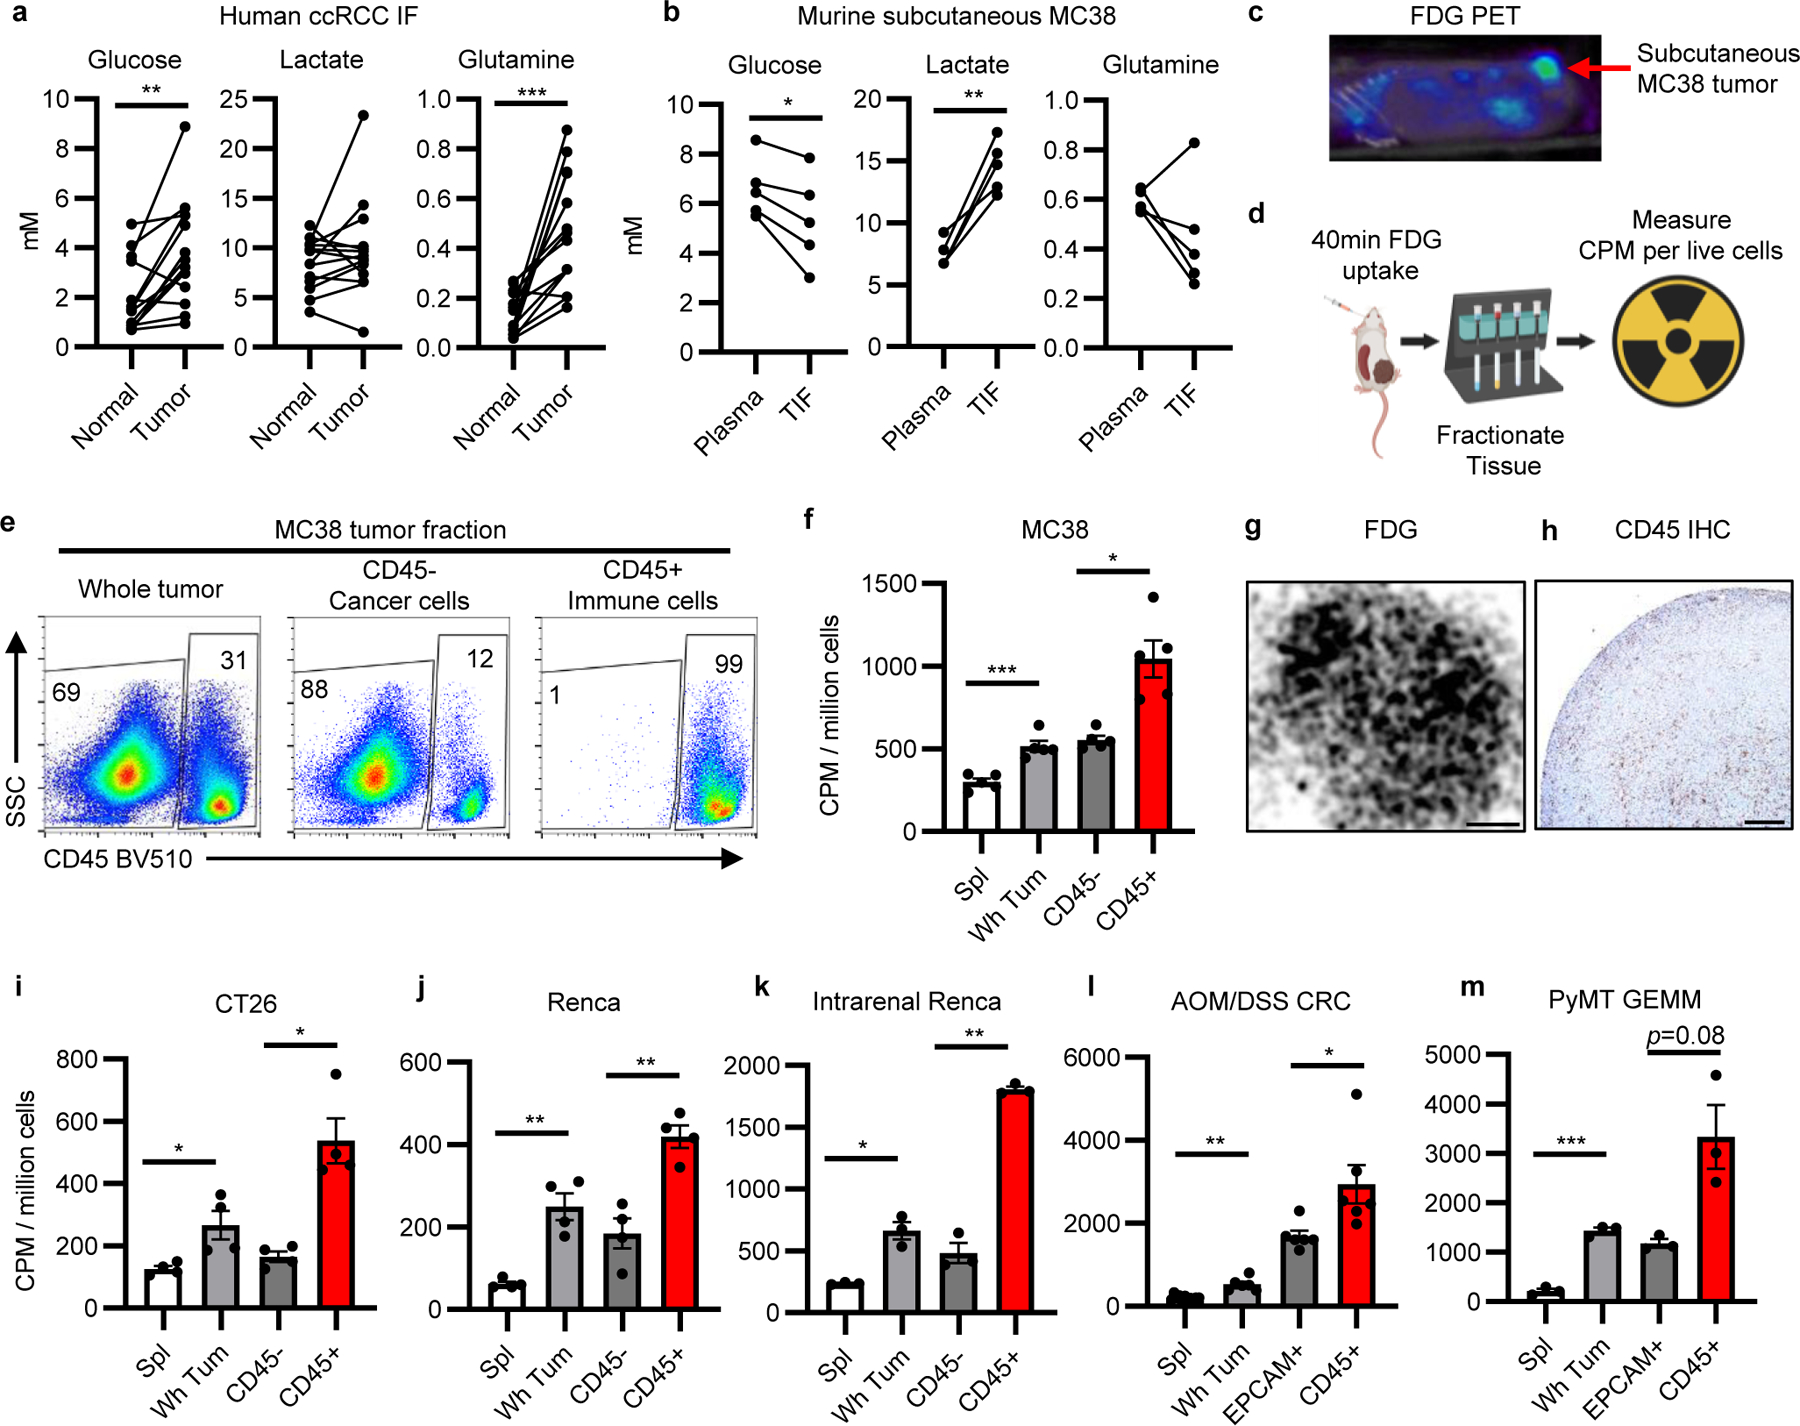
a,b Quantification of IF metabolites from (a) human ccRCC tumors and matched adjacent normal kidney (n=14 patients) and (b) murine MC38 subcutaneous tumor IF and matched plasma (n=5 mice). c, Representative (of n>20 mice) FDG PET image of MC38 tumor. d, Experimental schema. e, Representative flow cytometry analysis of MC38 whole tumor, CD45+, and CD45− cell fractions gated on live cells. f, FDG avidity in designated cell fractions from MC38 tumors (n=5 mice). g, Representative (of n=3 mice) tissue autoradiography of MC38 tumor (scale bar = 800μm). h, Representative (of n=5 mice) IHC for CD45 in MC38 tumor (scale bar = 200μm). i-m, FDG avidity in designated tumor cell fractions from subcutaneous CT26 (n=4 mice) (i) and Renca (n=4 mice) (j) tumors; intrarenal Renca tumors (n=3 mice) (k); AOM/DSS-induced CRC tumors (n=6 for tumor, n=11 mice for spleen) (l); and PyMT GEMM tumors (n=3 mice) (m). Each data point represents a biological replicate and graphs show mean and SEM. (b-c, e-m) are data from representative studies performed independently at least twice. P values were calculated using paired 2-tailed t-test for (a-b) and Welch’s 2-tailed t-test for (f, i-m). * p<0.05, ** p<0.01, *** p<0.001. Exact p-values are provided in source data. AOM/DSS CRC: azoxymethane/dextran sodium sulfate-induced colorectal cancer; ccRCC: clear cell renal cell carcinoma; CPM: counts per minute; FDG PET: 18-fluorodeoxyglucose positron emission tomography; GEMM: genetically engineered mouse model; IF: interstitial fluid; PyMT: Polyoma virus middle T antigen; TIF: tumor interstitial fluid; TME: tumor microenvironment
Multiple strategies validated that this approach accurately measures in vivo per cell glucose uptake. Immune cells isolated from MC38 tumors were confirmed as tumor-infiltrating based on minimal labeling following intravenous administration of fluorescent anti-CD45 antibody that efficiently labeled immune cells in blood and spleen (Extended Data Figure 2a). FDG uptake had a dynamic range with a multiple-log scale of linearity (Extended Data Figure 2b) and was independent of sample viability, cell yield, and tumor mass across biological replicates and tumor models (Extended Data Figure 2c). To confirm that FDG uptake did not occur during tumor processing, unlabeled MC38 tumor single cell suspensions were incubated with supernatants from FDG-labeled tumors. Ex vivo FDG uptake did not substantially contribute to the final FDG signal (Extended Data Figure 2d–e). Finally, to specifically examine cancer cells apart from other CD45− cells, Thy1.1+ MC38 cells were implanted in Thy1.1− hosts and isolated using Thy1.1 positive selection microbeads. Negatively selected Thy1.1− immune cells demonstrated higher FDG avidity than Thy1.1+ cancer cells (Extended Data Figure 2f–h). This approach thus specifically and quantitatively measures in vivo glucose uptake of cancer and immune cells in the TME. We also tested the fluorescent glucose analog 2NBDG (N-(7-Nitrobenz-2-oxa-1,3-diazol-4-yl)Amino)-2-Deoxyglucose). Consistent with other in vitro findings14, 2NBDG was not specific for glucose uptake in vivo and comparative measures of radioactive FDG and 2NBDG uptake in T cells from mice co-injected with both tracers showed no correlation of FDG radioactivity with 2NBDG (Extended Data Figure 3, Supplementary Information Figure 5).
Myeloid cells uptake the most glucose
Effector T cells and inflammatory myeloid cells both use glycolysis and are subjects for immunotherapeutic strategies in the TME. CD3+ T cells, CD11b+ myeloid cells, and F4/80+ macrophages were abundant in MC38 tumors without clear differences in spatial distribution or proximity to CD31+ endothelial cells that would suggest differential nutrient access (Extended Data Figure 4). Characterization of immune infiltrates across various tumor models demonstrated diversity in immune cell composition (Extended Data Figure 5). We next sought to compare the FDG uptake between tumor T cells, myeloid cells, and cancer cells in the MC38 model using microbeads to isolate each population. T cells in the TME had greater in vivo FDG avidity than resting splenic T cells and similar FDG avidity to cancer cells (Figure 2a–b, Extended Data Figure 6a), suggesting that these cells are not glucose deprived. T cell glucose uptake was significantly lower, however, than that of the remaining CD45+ non-T cells.
Fig. 2 |. TME myeloid cells uptake more glucose than cancer cells.
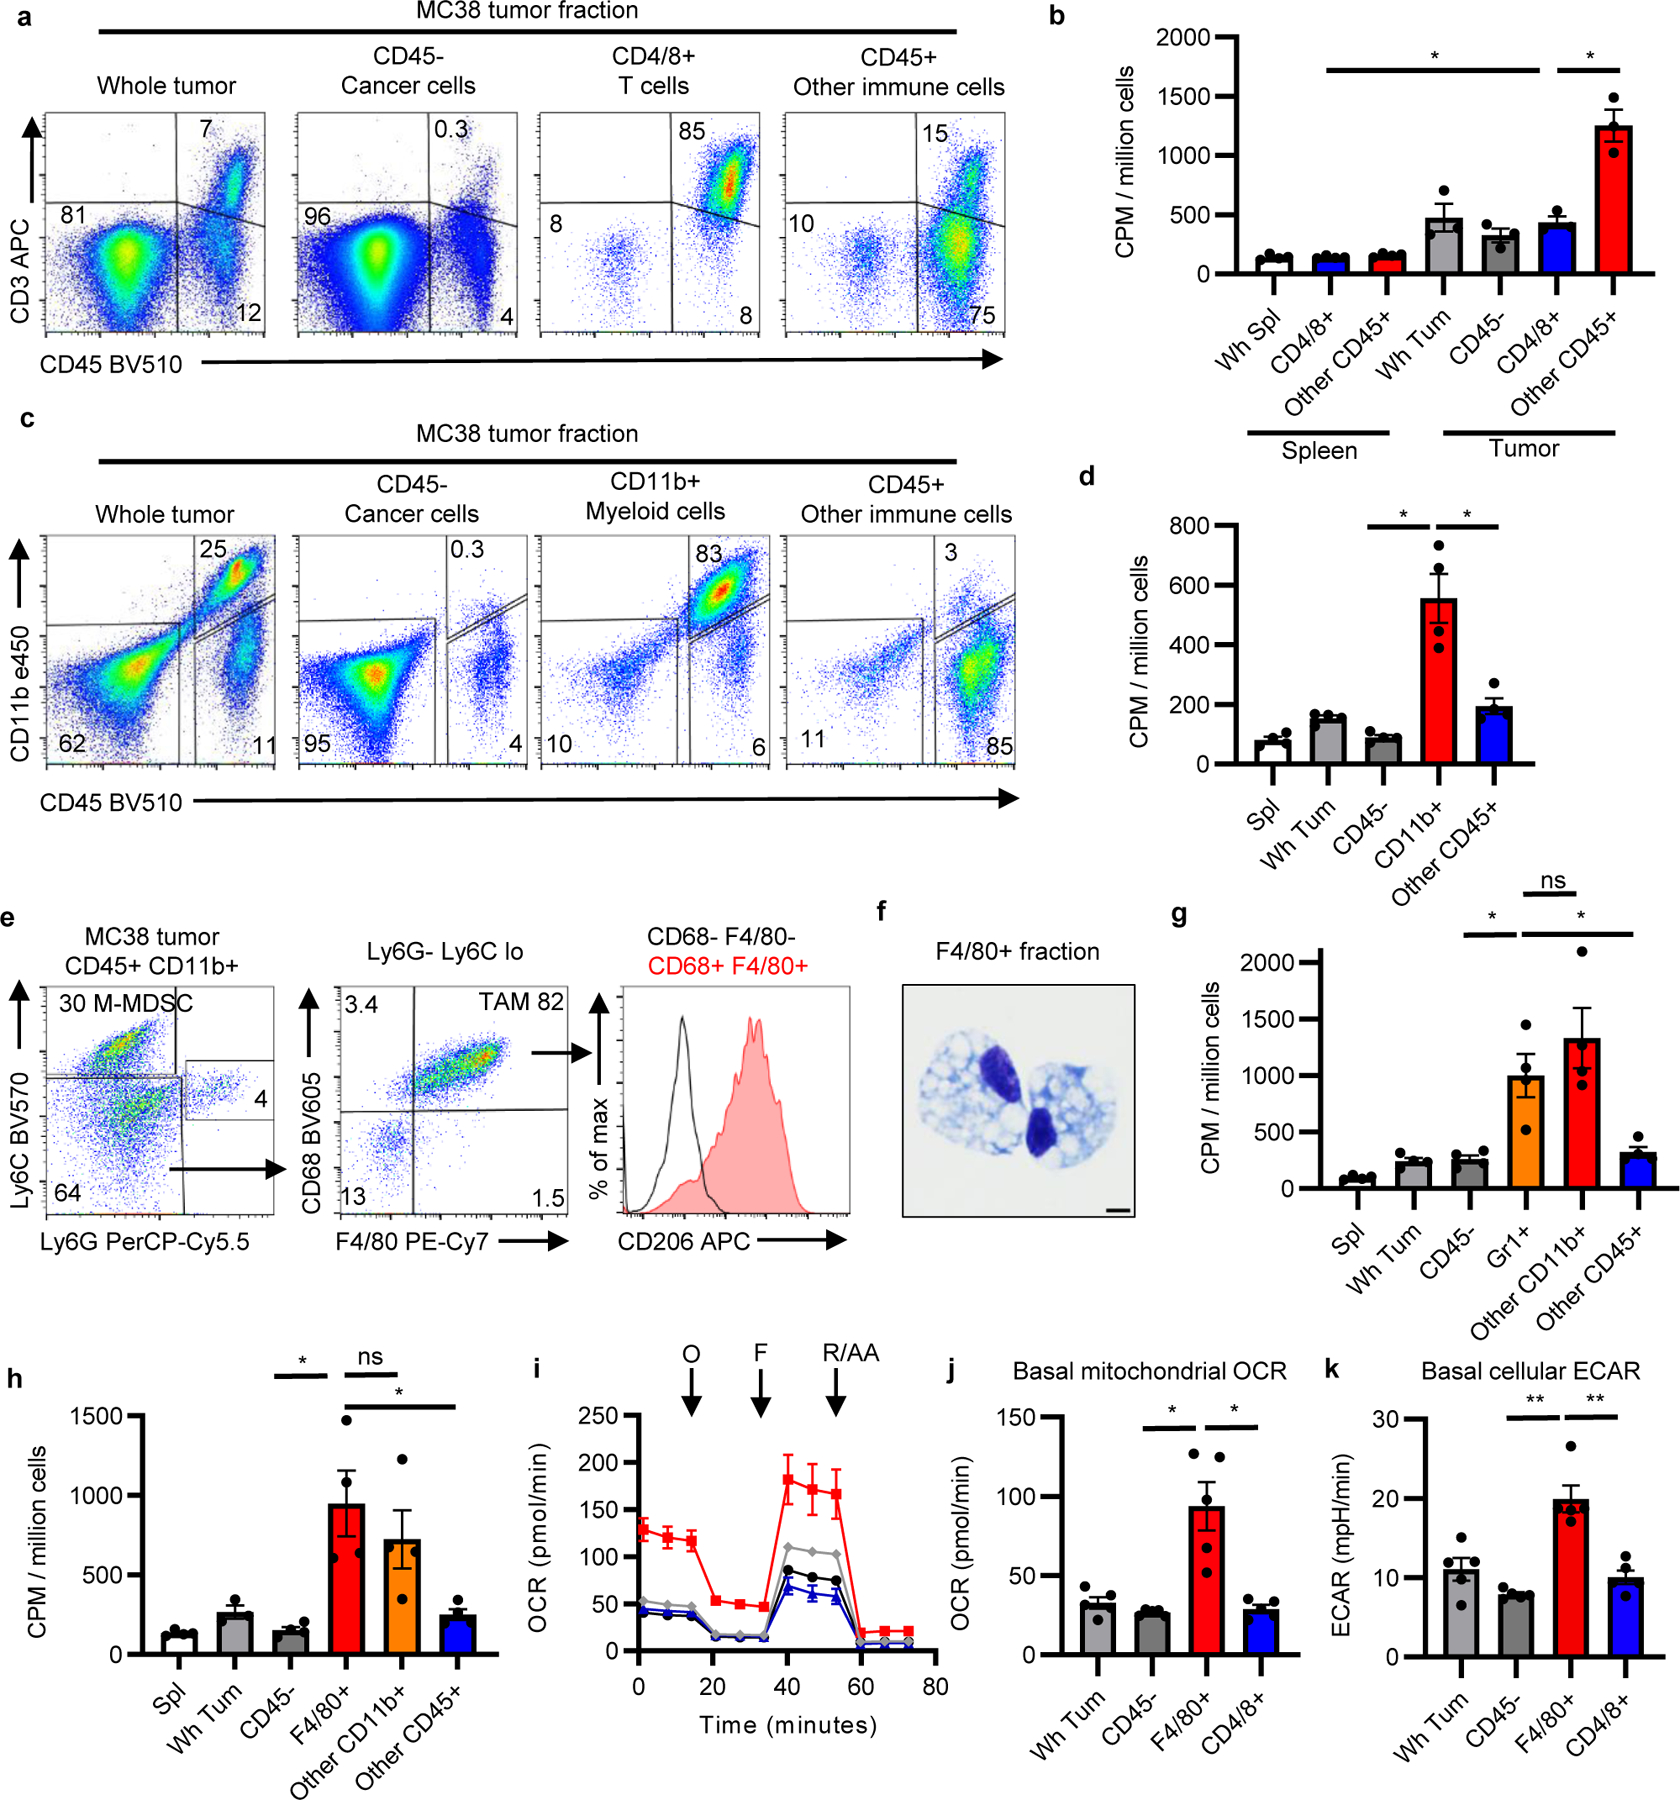
a, Representative flow cytometry from CD4/8 microbead fractionated MC38 tumors gated on live cells. b, FDG avidity in designated cell fractions (n=3 for tumor, n=4 mice for spleen). c, Representative flow from CD11b microbead fractionated MC38 tumor gated on live cells. d, FDG avidity in designated cell fractions (n=4 mice). e, Representative flow cytometry plots of MC38 tumor CD11b+ myeloid cells. f, Representative (of n=2 mice) H&E-stained micrograph of F4/80 microbead-isolated TAM (scale bar = 5μm). g-h, FDG avidity in designated MC38 tumor cell fractions using Gr1 (n=4 except Wh Tum n=3 mice) (g) or F4/80 microbeads (n=4 mice) (h). i, Representative (of n=5 mice) OCR tracings from MC38 tumor cell fractions with oligomycin (O), FCCP (F), and rotenone and antimycin A (R/AA). j-k, Basal mitochondrial OCR (j) and cellular ECAR (k) of MC38 tumor fractions (n=5 mice). Each data point represents a biological replicate except for (i) which shows technical replicates of a single biological replicate, and graphs show mean and SEM. Independent representative studies were performed at least twice. P values were calculated using Welch’s 2-tailed t-test. * p<0.05, ** p<0.01, *** p<0.001. Exact p-values are provided in source data. ECAR: extracellular acidification rate; M-MDSC: monocytic myeloid-derived suppressor cell; OCR: oxygen consumption rate; TAM: tumor-associated macrophage
To characterize the non-T cell CD45+ cells, myeloid cells were isolated using CD11b positive selection beads (Figure 2c–d, Extended Data Figure 6b). Notably, CD11b+ myeloid cells displayed higher FDG uptake per cell than cancer cells and other immune cells in MC38 tumors. Myeloid cells from CT26 tumors displayed a similar phenotype (Extended Data Figure 6c–d), consistent with recent reports15,16. Flow cytometry analysis of CD45+ CD11b+ cells from MC38 tumors demonstrated two dominant cell populations: Ly6G−Ly6Chi cells consistent with monocytic myeloid-derived suppressor cells (M-MDSC), and Ly6G−Ly6CloF4/80hiCD68+CD206hi cells consistent with tumor associated macrophages (TAM) (Figure 2e). Isolated F4/80hi cells had histiocytic morphology (Figure 2f), concordant with TAM classification. Both M-MDSC isolated using Gr1 positive selection beads and TAM isolated using F4/80 positive selection beads demonstrated high FDG avidity (Figure 2g–h, Extended Data Figure 6e–f). CD11b+ cells demonstrated high glucose uptake even in B- and T cell-deficient Rag1−/− (Extended Data Figure 5g), showing that high glucose uptake in myeloid cells is independent of adaptive immunity (Extended Data Figure 6g). Conventional type 1 dendritic cells (cDC1) are critical to support anti-tumor CD8 T cell activity17. CD11b−CD11c+ cDC, displaying a MHCII+CD103+Ly6C− phenotype consistent with cDC1, had lower glucose uptake than CD11b+ myeloid cells but greater glucose uptake than cancer cells and non-myeloid immune cells in the TME (Extended Data Figure 6h–j).
We conducted extracellular flux assays on microbead-fractionated MC38 tumors to validate metabolic activity of cells in the TME. Isolated F4/80+ TAM maintained higher basal cellular extracellular acidification rate (ECAR) and mitochondrial oxygen consumption rate (OCR) than tumor infiltrating T cells and cancer cells (Figure 2i–k). These studies show TAM and M-MDSC consume the most per cell glucose in the TME and maintain active glucose metabolism. Consistently, myeloid infiltration has been correlated with FDG avidity in non-tumor bearing lymph nodes in human and mouse gynecological malignancies18. Our data extend these findings directly to the TME and reveal the relative metabolic phenotypes of heterogeneous cells in the TME.
mTORC1 programs metabolism in the TME
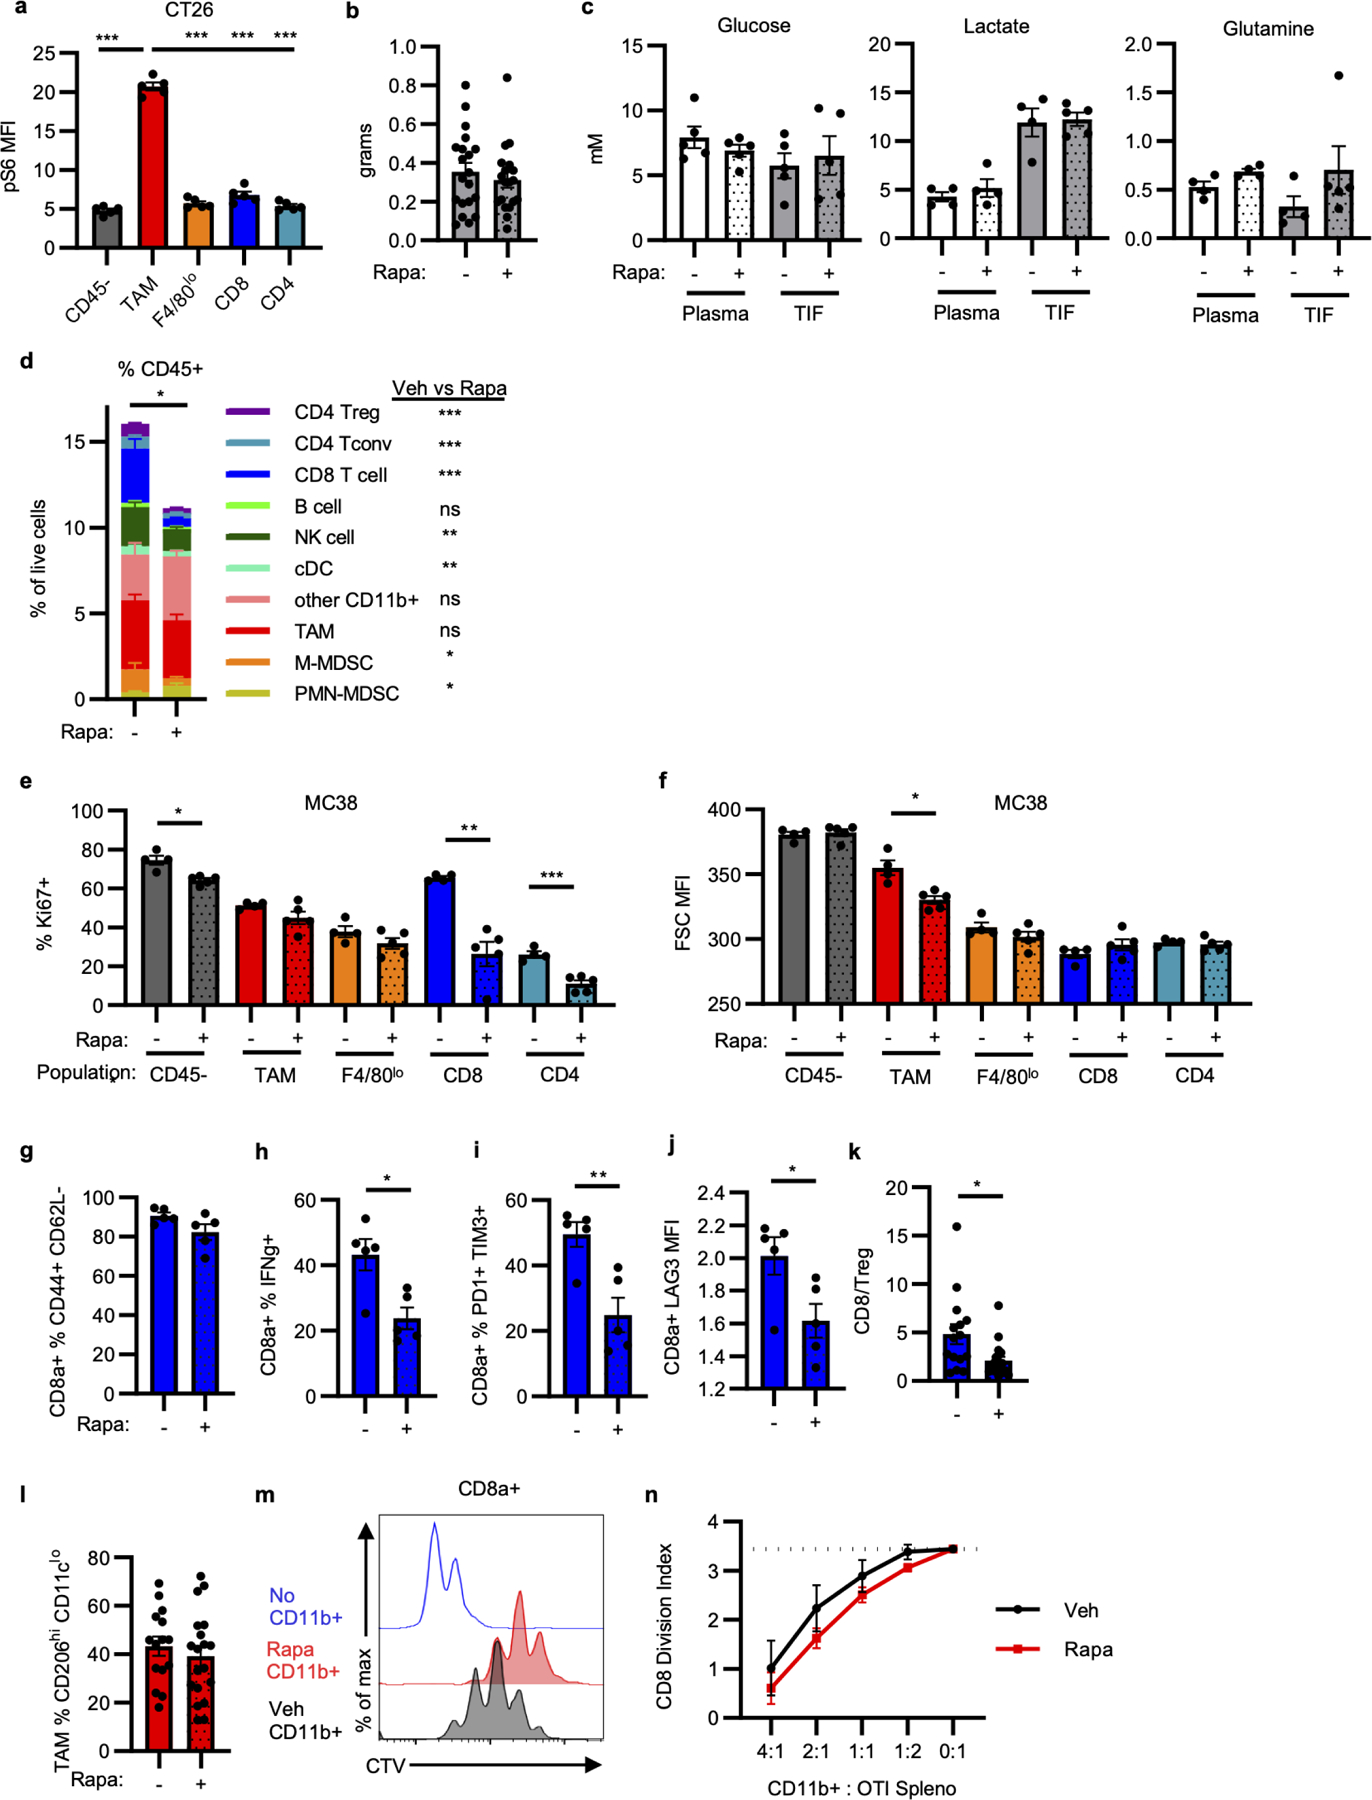
Mechanistic target of rapamycin complex 1 (mTORC1) supports anabolic metabolism and nutrient uptake19. We observed mTORC1 pathway activity by higher levels of phosphorylated ribosomal protein S6 (pS6) in tumor myeloid cells compared to other tumor cell subsets in human ccRCC, murine MC38, and murine CT26 tumors (Figure 3a–c, Extended Data Figure 7a, Supplementary Information Table 1, Supplementary Information Figure 5). To determine whether mTORC1 supports glucose uptake in the TME, we treated MC38 tumor-bearing mice with rapamycin for four days and measured FDG uptake in tumor cell populations. Rapamycin did not affect tumor weights, glucose, glutamine, or lactate concentration in the TME, but significantly decreased pS6 levels, T cell infiltration, Ki67 levels in cancer cells and T cells, and TAM cell size (Figure 3d, Extended Data Figure 7b–f). Rapamycin treatment led to significant decreases in myeloid and cancer cell FDG uptake (Figure 3e). Extracellular flux demonstrated that in vivo rapamycin treatment decreased myeloid cell metabolism ex vivo, while cancer cells and T cells remained unchanged (Figure 3f–h). Tumor CD8 T cells and TAM retained phenotypic markers after rapamycin treatment, but CD8 T cells displayed a functionally less activated phenotype (Extended Data Figure 7g–n, Supplementary Information Figure 5).
Fig. 3 |. mTORC1 supports glucose uptake and metabolism in the TME.
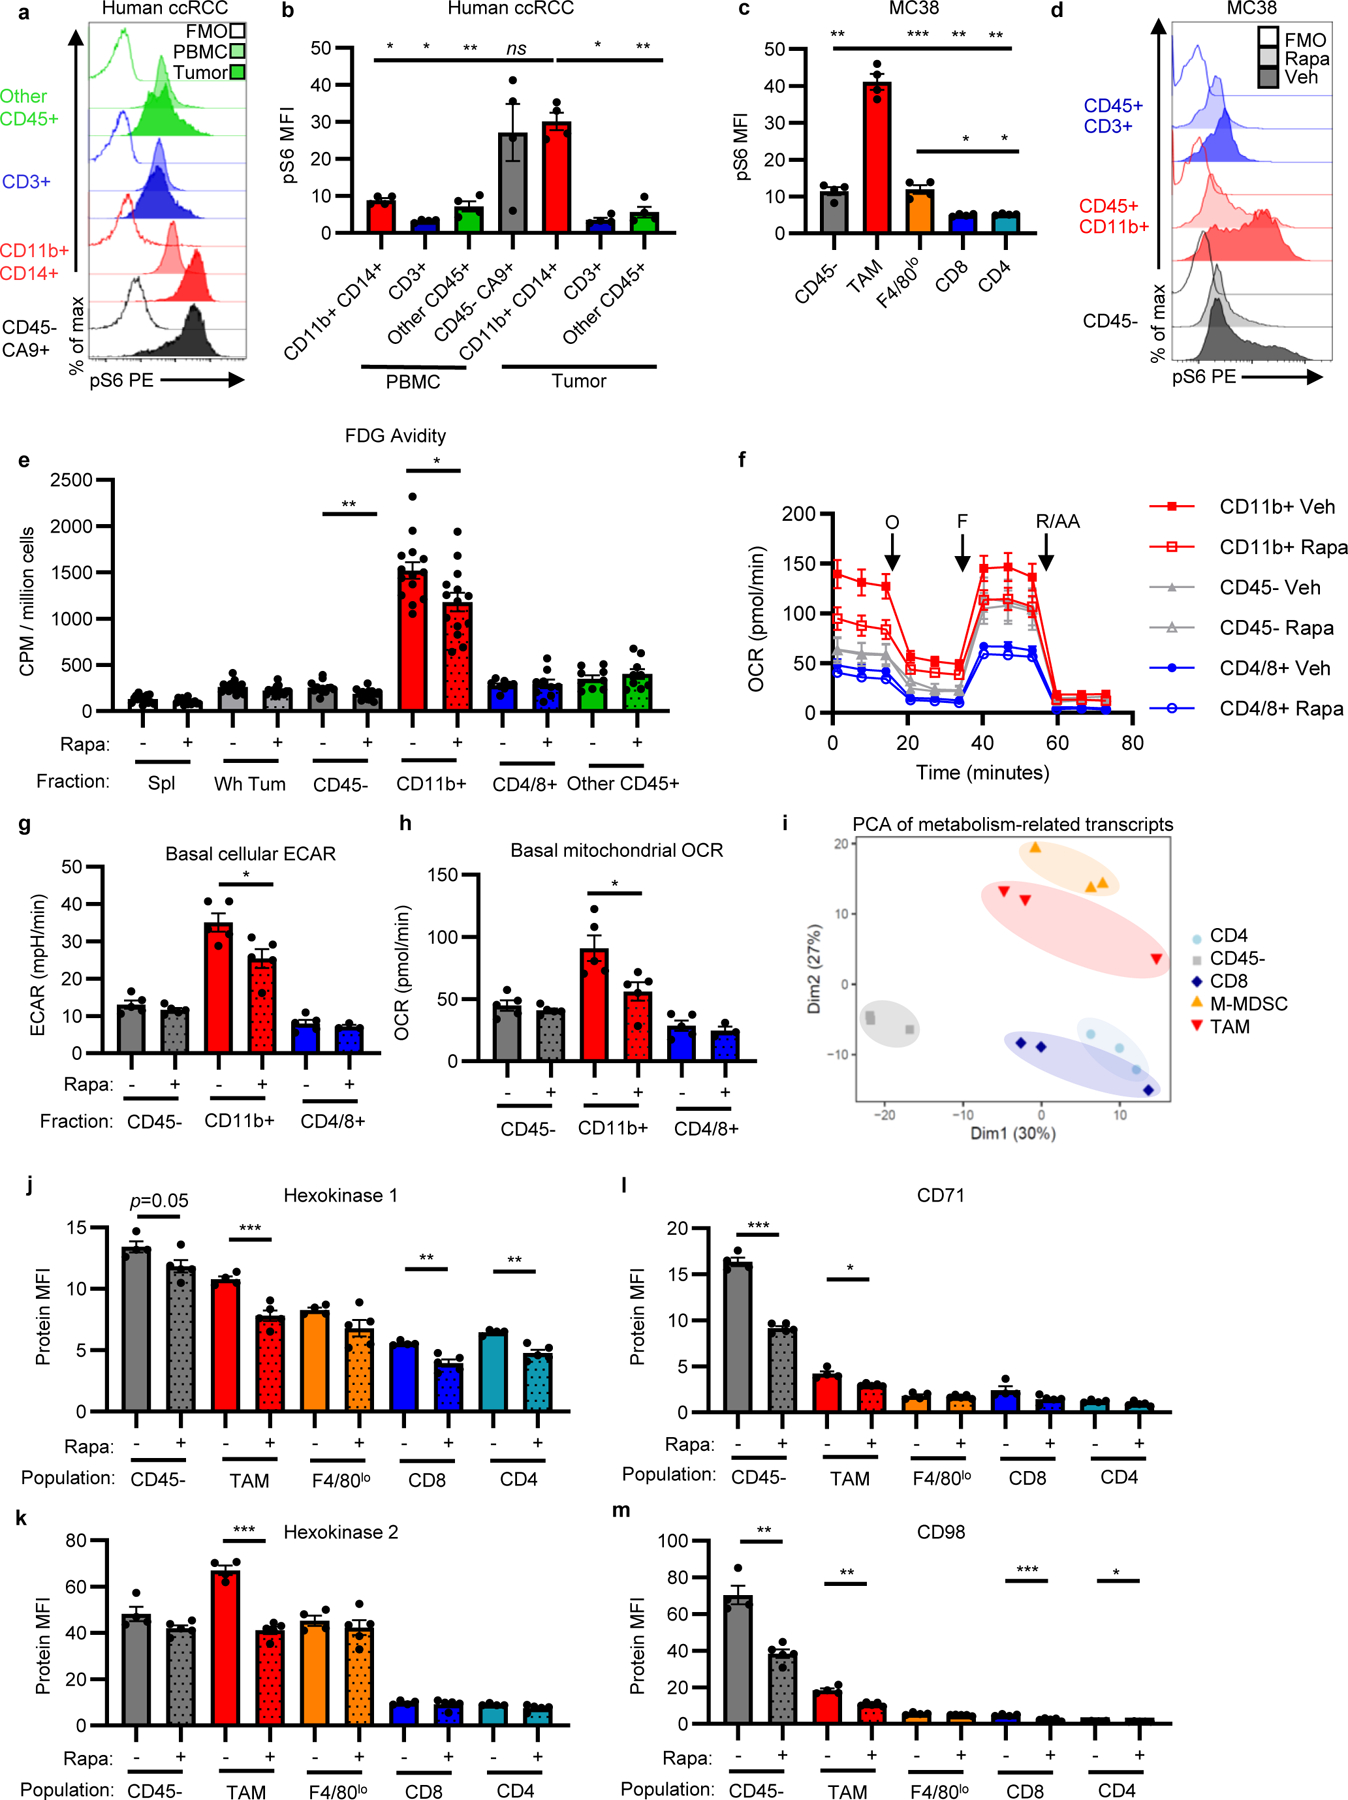
a-c, Phosphorylated S6 (pS6) levels in indicated cell populations by flow cytometry in human peripheral blood mononuclear cells (PBMC) and matched ccRCC (representative histograms a, quantification b) (n=4 patients) and MC38 tumors (c) (n=4 mice). d, Representative histograms of pS6 levels in MC38 tumor cells from mice treated with rapamycin or vehicle. e, FDG avidity in designated MC38 tumor cell fractions with rapamycin treatment (n=15 for Spl Veh, n=8 for CD4/8+ veh, n=9 for CD4/8+ rapa and other CD45+, and n=14 mice for all other groups). f, Representative (of n=5 mice/group) OCR tracings from fractionated MC38 tumors from mice treated with rapamycin or vehicle with indicated injections of oligomycin (O), FCCP (F), and rotenone and antimycin A (R/AA). g-h, Basal cellular ECAR (g) and mitochondrial OCR (h) of MC38 tumor fractions from mice treated with rapamycin or vehicle (n=5 except for CD4/8+ rapa n=3 mice/group). i, PCA plot of metabolism-related mRNA transcripts from CD45−, TAM, M-MDSC, CD8 T cell, and CD4 T cell flow-sorted populations from MC38 tumors (n=3 mice). j-m, Flow cytometry quantification of HK1 (j), HK2 (k), CD71 (l), and CD98 (m) in MC38 tumor cell populations from mice treated with rapamycin or vehicle (n=4 for veh, n=5 mice for rapa). c-d, i-m are representative of at least two independent experiments. (e) is the combined data of three independent experiments. Each data point represents a biological replicate except for (f) which shows technical replicates of a single biological replicate, and graphs show mean and SEM. P values were calculated using Brown-Forsythe and Welch ANOVA with Dunnett’s T3 for multiple comparison tests for (b-c) and Welch’s 2-tailed t-test for (e-m). * p<0.05, ** p<0.01, *** p<0.001. Exact p-values are provided in source data. FMO: fluorescence minus one; MFI: median fluorescence intensity; M-MDSC, monocytic myeloid derived suppressor cell; PBMC: peripheral blood mononuclear cell; pS6: phosphorylated ribosomal protein S6 (Ser235/236); Rapa: rapamycin
Flow-sorted CD45− cancer cells, TAM, M-MDSC, CD8 T cells, and CD4 T cells from MC38 tumors were transcriptionally profiled (Extended Data Figure 8a). In untreated tumors, principal component analysis and unbiased clustering based on only metabolism-related transcripts grouped samples by cell identity (Figure 3i, Extended Data Figure 8b, Supplementary Information Table 2). Corresponding with increased glucose uptake in myeloid cells, gene set enrichment analysis revealed relative enrichment of glucose-related pathways in M-MDSC and TAM (Extended Data Figure 8c, Supplementary Information Table 3). Glucose transporters demonstrated population-specific expression, with cancer cells and myeloid cells expressing high transcript levels of Slc2a1 (GLUT1) and T cells expressing high levels of Slc2a3 (GLUT3). Hexokinase isoforms Hk2 and Hk3, which catalyze glucose phosphorylation in cells as the rate-limiting initial phosphorylation of glucose in glycolysis, were most highly expressed in myeloid cells in contrast to broadly expressed Hk1. CD45− cancer cells displayed amino acid, lipid, and signaling-related transcripts, and CD8 T cells were enriched in nucleotide-related transcripts. Rapamycin increased glycolysis-related transcript levels, particularly in CD45− cancer cells, while other metabolic gene transcripts decreased, including amino acid-related transcripts (Extended Data Figure 9a–e, Supplementary Information Table 4). Gene expression levels and changes after rapamycin treatment were confirmed at protein levels by flow cytometry. Rapamycin treatment reduced HK1 across tumor cell populations and HK2 specifically in TAM, potentially underlying differences in glucose uptake (Figure 3j–k). GLUT1 levels remained unchanged (Extended Data Figure 9f), yet iron transporter CD71 and amino acid transporter CD98 protein levels decreased with rapamycin treatment (Figure 3l–m).
Cancer cells uptake glutamine and lipids
Having shown that systemic glucose is preferentially consumed by tumor-infiltrating myeloid cells, we hypothesized that other nutrients also have distinct patterns of uptake in the TME. Ex vivo uptake of fluorescently labelled palmitate (C16 BODIPY) was highest in CD45− cancer cells, corroborating transcript enrichment data and showing that other nutrients may partition differently than glucose in the TME (Extended Data Figure 10a–c). We postulated based on transcript data that glutamine uptake would also be greatest in CD45− cancer cells. TME glutamine metabolism has been shown to promote cancer cell growth while impairing anti-tumor immunity9. MYCN and ATF4 drive glutamine utilization20, and Mycn and Atf4 were more highly expressed in MC38 cancer cells than immune cells (Figure 4a–b). Glutamine metabolism enzymes Aspa, Asns, and Gls2 were also specifically expressed in the MC38 cancer cells, as well as other amino acid-related transcripts Pycr1 and Slc7a5 (Extended Data Figure 8b). Tumor-bearing mice were injected with 18F-(2S,4R)4-Fluoroglutamine (18F-Gln)21 to measure glutamine pool size and uptake in the TME. Subcutaneous MC38 tumors were 18F-Gln avid (Figure 4c, d). In contrast to FDG, however, CD45− cancer cells demonstrated greater 18F-Gln avidity than CD45+ immune cells in MC38 (Figure 4e), CT26, Renca, and spontaneous AOM/DSS tumor models (Extended Data Figure 10d–f).
Fig. 4 |. Glutamine partitions into cancer cells in the TME.

a-b, Glutamine-related transcription factor mRNA transcript levels of flow-sorted MC38 tumor cell populations (n=3 mice). c, Representative 18F-Gln image of subcutaneous MC38 tumor. d, 18F-Gln autoradiography image of subcutaneous MC38 tumor (scale bar = 800μm). e, Cellular 18F-Gln avidity in designated MC38 tumor cell fractions (n=4 mice). f-g, Cellular 18F-Gln avidity in MC38 tumor cell fractions from mice treated with vehicle or rapamycin (f) or V9302 (g) (n=5 mice/group). h, FDG avidity in MC38 tumor cell fractions from mice treated with V9302 or DMSO (n=4 for Wh Tum, CD4/8+, and other CD45+; n=8 mice for all others). i-j Contribution of cell populations to total MC38 tumor FDG (i) (n=10 mice) and 18F-Gln signal (n=5 mice) (j). k, Model for nutrient partitioning in the TME. Each data point represents a biological replicate and graphs show mean and SEM. Data are representative of at least two independent experiments. (h) shows combined data of two independent experiments. P values were calculated using Welch’s 2-tailed t-test for (e-h) and Brown-Forsythe and Welch ANOVA with Dunnett’s T3 for multiple comparison tests for (a-b, i-j). * p<0.05, ** p<0.01, *** p<0.001. Exact p-values are provided in source data. 18F-Gln: 18F-4-fluoroglutamine; DMSO: Dimethyl sulfoxide; V9302: ASCT2 inhibitor.
Rapamycin reduced amino acid-related transcripts and CD98 protein levels. Correspondingly, rapamycin treatment sharply decreased 18F-Gln uptake in CD45− and myeloid cells (Figure 4f). To assess the relationship between glutamine and glucose uptake, tumor-bearing mice were treated with V9302, a small molecule inhibitor of the glutamine transporter ASCT222. V9302 broadly decreased glutamine uptake by cells in the TME (Figure 4g), but increased glucose uptake in all tumor cell populations in the TME (Figure 4h). V9302 also decreased MC38 tumor mass and T cell infiltration (Extended Data Figure 10g, h) and increased the frequency of tumor M2-like macrophages (Extended Data Figure 10i, j). Together these data demonstrate that glutamine uptake and metabolism actively restrain glucose metabolism in vivo and that tumor infiltrating cells can access and increase glucose uptake beyond basal levels when glutamine is restricted. Cell-intrinsic programs of distinct tumor cell subsets thus dictate glucose and glutamine uptake in the TME.
Selective Nutrient Partitioning
Our findings demonstrate discrete metabolic selections regulate glucose and glutamine uptake within the TME. In the context of the whole tumor, multiplying the per cell glucose uptake by the abundance of each cell type showed that cancer cells accounted overall for approximately 2/3 of glucose uptake, with myeloid cells accounting for another 1/3 and other immune cells contributing negligibly (Figure 4i). In contrast, glutamine and lipid per-cell and total tumor uptake were dominated by cancer cells (Figure 4j, Extended Data Figure 10c). These results support the notion that glucose is not grossly limiting in the TME and utilization is instead modulated by cell intrinsic programs and glutamine uptake (Figure 4k).
This work reveals that diverse cell populations preferentially acquire distinct metabolites from a common pool of metabolites available in the TME11,23. Our work demonstrates that tumor myeloid cells consume significantly more glucose than tumor infiltrating T cells or cancer cells on a per-cell basis, which each remain more active than in unrelated tissues. This has implications for metabolism-targeting agents as well as myeloid targeting therapies, with the potential to either enhance or impair tumor-related inflammation. These data also support targeting glutamine metabolism as a specific strategy to hamper cancer cell growth while also increasing glucose consumption and altering immunophenotype in the TME as a result.
Previous studies have suggested competition for glucose in the TME between cancer cells and T cells contributes to immunosuppression3,4,24. Our data, however, show that glucose is not broadly limiting, and TME resident cells have the capacity to increase glucose uptake in vivo when glutamine uptake is restricted. This cell-intrinsic programming provides a new level of insight into the innerworkings of the TME. Here, a program of mTORC1-driven glutamine uptake may suppress glycolytic gene expression and glucose metabolism in cancer cells. There is also growing evidence that glycolytic cancer cell transcriptional programs are associated with immunosuppressive TMEs and directly recruit suppressive myeloid cells25,26 while TAM glycolysis may drive hypoxia via endothelial dysfunction27 and cytokine production28. Our work supports a model where glycolytic tumors are immunoinhibitory not directly due to nutrient deficiencies but rather because of large scale microenvironmental changes which alter intrinsic cellular programming and that different nutrients may follow distinct, but cell and tumor-type specific patterns.
Myeloid cells directly consume FDG out of proportion to the cancer cells and thus account for a significant fraction (30%) of measured tumor glucose uptake in PET imaging. These findings also help explain intratumoral regional variability in FDG avidity observed on PET imaging as well as the PET avid nature of Hodgkin’s lymphoma, a disease entity with far more inflammatory cells than transformed tumor cells. Understanding the biology of distinct cell types in the complex TME has contributed substantially to shaping models of tumorigenesis. Our studies extend these approaches to evaluate in vivo metabolic features of tumor cell types and show that individual cell populations have distinct nutrient uptake programs that may play an important role in therapy response or resistance.
Methods
Patient samples
Fresh histology-confirmed clear cell renal cell carcinoma (ccRCC) tumors and matched normal tissue were surgically removed from 14 patients. Supplementary Information Table 1 contains relevant patient and tumor information. Tumor and matched normal kidney were processed by mechanical dissociation (human tumor setting two on Miltenyi gentleMACS™) in HBSS with calcium chloride and magnesium chloride. Mechanical dissociation was followed by enzymatic digestion in 435U/mL deoxyribonuclease I (Sigma-Aldrich, D5025) and 218U/mL collagenase (Sigma-Aldrich, C2674) in RPMI supplemented with 10% FBS, 1% glutamine, 1% pen/strep, 1% Hepes, and 0.1% 2-Mercaptoethanol for 30–45min, depending on tissue toughness, at room temperature with 17 rpm agitation. Tissue digests were washed with HBSS without calcium chloride, magnesium chloride, or magnesium sulfate and then incubated in 5mM EDTA for 20min at room temperature with 17rpm agitation. Tumor and matched normal kidney digests were washed with HBSS with calcium chloride and magnesium chloride. Then they were passed through a 70μm filter and ACK-lysed. Patient peripheral blood mononuclear cells (PBMC) were isolated by density gradient centrifugation using Ficoll-Paque (GE Healthcare, 17144002) in SepMate-50 tubes (Stemcell Technologies, 85450) and subsequently ACK-lysed. Single cell suspensions were frozen in 90% FBS 10% DMSO. Batched tumor and matched PBMC were thawed, rested for 10min at 37°C, counted, stained, and analyzed for flow cytometry. All studies were conducted in accordance with the Declaration of Helsinki principles under a protocol approved by the Vanderbilt University Medical Center (VUMC) Institutional Review Board (protocol #151549). Informed consent was received from all patients prior to inclusion in the study by the Cooperative Human Tissue Network at VUMC.
Interstitial Fluid Collection & LC/MS metabolite analysis
Tissue interstitial fluid (TIF) was collected from freshly resected ccRCC tumor and matched normal kidney tissue. Specimens were centrifuged against a 0.22μm nylon filter (Corning CLS8169) at 4°C for 5 minutes at 300g. Flow-through TIF was flash-frozen and stored at −80°C prior to batch analysis. Mouse blood was collected via submandibular vein, aliquoted immediately into EDTA, and centrifuged for 10min at 850g at 4°C. Plasma supernatant was collected and then cleared by centrifugation for 20min at 3000g at 4°C. Liquid chromatography/mass spectrometry (LC/MS) quantitation of metabolites was performed as described previously29.
Mice
C57BL/6J (000664), BALB/cJ (000651), Rag1 KO (002216) and OTI transgenic (003831) mice were obtained from the Jackson Laboratory. All mouse procedures were performed under Institutional Animal Care and Use Committee (IACUC)-approved protocols from Vanderbilt University Medical Center and conformed to all relevant regulatory standards. Mice were housed in ventilated cages with at most 5 animals per cage and provided ad libitum food and water. Mice were on 12 hour light/dark cycles which coincided with daylight in Nashville, TN. The mouse housing facility was maintained at 68–76°F and 30–70% humidity. For injectable tumor models, 8–20 week old male and female mice were used. Mice were euthanized if humane endpoint was reached (2cm dimension, ulceration, weight loss >10%). V9302 treatments were administered intraperitoneally twice daily for five days at 25mg/kg for FDG uptake or once at 75mg/kg 3hr prior to 18F-Gln injection. Rapamycin treatments were administered intraperitoneally daily for four days at 2mg/kg dissolved in 2% DMSO 30% Polyethylene Glycol 300 (Sigma Aldrich 202371), and 5% Tween 80 (sigma Aldrich P1754). Mice were randomized at first day of treatment to control or drug in an unblinded manner, with mice from the same cage receiving different treatments. Sample sizes were chosen based on prior experiments.
Cell lines
The MC38 and CT26 cell lines were provided by Barbara Fingleton and grown in DMEM supplemented with 10% FBS. The Renca cell line was obtained through ATCC and grown in RPMI 1640 supplemented with 10% FBS, 4mM glutamine, 25mM HEPES, essential amino acids, and sodium pyruvate. Cells were trypsinized, washed twice in PBS, and 1×10⁶ cells were injected subcutaneously in 100–200μL of PBS on mouse flanks. Subcutaneous tumors grew for 14 days prior to analysis. The MC38-EL-Thy1.1 cells were generated using a transposon based engineering approach with plasmids that were described previously30. MC38 cells were electroporated using the NEON transfection system (ThermoFisher) according to manufacturer’s recommendations for adherent cell lines. 5 million MC38 cells were suspended in electroporation buffer containing 5μg of the plasmid pCMV-M7PB and 15μg of the plasmid pT-EL-thy1.1, which is a bicistronic transposon vector driving expression of an enhanced firefly luciferase as well as Thy1.1 antigen. Cells were magnetically sorted based on expression of Thy1.1 using magnetic beads (Miltenyi 130-121-273). Cell lines were regularly tested for mycoplasma via PCR and all cells used in downstream assays were confirmed negative.
Orthotopic renal implantation
For intrarenal Renca injections, survival mouse surgery was performed according to a method previously described31. Briefly, mice were anesthetized by isoflurane inhalation at 2–3% and placed on a warming recirculating water pad set at 37°C to maintain body temperature. Using sterile surgical techniques, a 1-cm incision was made in the skin running parallel to the spine, slightly below the ribcage on the right flank. Next, a 1-cm incision was made in the muscle layer in the same location. Using gentle pressure on the mouse abdomen, the right kidney was exteriorized. 5×10⁴ Renca cells resuspended in 100μL of PBS were injected using a 29-gauge needle inserted through the renal capsule into the cortical space. The injection site was swabbed using sterile gauze and the kidney was returned to the body cavity. The abdominal wall was closed using 6–0 monofilament absorbable sutures (AD Surgical; S-D618R13), and the skin was closed using wound clips. Analgesic was provided pre-surgery and 24 hours post-surgery in the form of ketoprofen injections at 5 mg/kg. Wound clips were removed 7 days following the surgery. Tumors were analyzed 28 days after cancer cell injection.
Spontaneous Tumor Models
PyMT GEMM mice were bred by crossing male transgenic mice expressing the polyoma virus middle T antigen (PyMT) oncoprotein under the MMTV-LTR (Jackson Laboratory 022974) with wildtype females on a similar B6/FVB mixed background. The GEMM mice were from a colony in which all mice expressed two Vhl alleles in which exon 1 is flanked by loxP sites (Jackson Laboratory 012933) but did not express a Cre transgene and were thus effectively wildtype. Once weaned, female mice were palpated twice a week and tumors were measured in three dimensions with digital calipers. Mice were collected when any tumor had grown to a size of 1 cm in diameter in any dimension, around 5 months of age. Virgin female littermates were used in these studies.
The AOM/DSS inflammatory colorectal cancer model was used as previously described32,33. In brief, bedding was mixed to normalize microbiome two weeks prior to experimental initiation. 8–12 week-old C57BL/6J mice were intraperitoneally injected with 12.5 mg/kg AOM and exposed to three 4-day cycles of 3% to 4% DSS (TdB Labs 9011-18-1). Each DSS cycle was followed by a 16-day recovery period. Prior to sacrifice, colonoscopy was performed to confirm tumor development. Mice were weighed every other day throughout the experiment. Mice were euthanized 6–8wk after completing the last cycle of DSS. Colons were dissected and tumor tissue was isolated from the mucosa.
PET-CT Imaging
For individual studies, a group of MC38 tumor-bearing mice were food-restricted overnight. Then the mice received a retro-orbital injection of ~ 37 MBq/0.1 mL of 18F-FDG and were returned to plate-warmed cages. Forty minutes later, the mice were anesthetized under 2% isofluorane and imaged an Inveon microPET (Siemens Preclinical, Knoxville TN) for 20 min. Data from all possible lines of response (LOR) were saved in the list mode raw data format. The raw data was then binned into 3D sinograms with a span of 3 and ring difference of 47. The images were reconstructed into transaxial slices (128 × 128 × 159) with voxel sizes of 0.0815 × 0.0815 × 0.0796 cm3, using the MAP algorithm with 16 subsets, 4 iterations, and a beta of 0.0468. For anatomical co-registration, immediately following the PET scans, the mice received a CT scan in a NanoSPECT/CT (Mediso, Washington DC) at an x-ray beam intensity of 90 mAs and x-ray peak voltage of 45 kVp. The CT images were reconstructed into 170 × 170 × 186 voxels at a voxel size of 0.4 × 0.4 × 0.4 mm3. The PET-CT images were uploaded into Amide (www.sourceforge.com) and volumetric regions-of-interest were drawn around the tumors. The PET images were normalized to the injected dose and the mean radiotracer concentration within the ROIs were determined.
18F autoradiography
Mice were handled and injected similarly to previously described for the PET-CT imaging, but without overnight fasting. Tumors were harvested, embedded in optimal cutting temperature compound (OCT, Fisher 23-730-571), and frozen on dry ice. Tumors were cut into 10μm sections and imaged in a Beta Imager (Biospacelabs, France) for 1 hr. Regions-of-interest (ROIs) were drawn around the resulting tumor and spleen images and the counts in each ROI were compared.
18F-FDG and 18F-Gln nutrient uptake assay
Tumor-bearing mice were retro-orbitally injected with 1mCi of FDG or 18F-Gln synthesized at VUMC34. During radiotracer uptake, mice were conscious and had access to food and water. Mice were euthanized and spleen and tumors were harvested 40min after radiotracer administration. Single cell suspensions of splenocytes were prepared by physical dissociation followed by ACK-lysis. Tumors were chopped, mechanically dissociated on the Miltenyi gentleMACS™ Octo Dissociator with Heaters (setting implant tumor one) and digested in 435U/mL deoxyribonuclease I (Sigma-Aldrich, D5025) and 218U/mL collagenase (Sigma-Alrich, C2674) at 37°C for 30min. After enzyme treatment, tumors were passed through a 70μm filter and ACK-lysed. Cells were resuspended in MACS buffer (PBS +2% FBS +2mM EDTA) and counted using trypan blue with the TC20™ Automated Cell Counter (Bio-Rad). In some cases, tumors from different mice were pooled to achieve higher tumor cell number prior to fractionation to ensure sufficient 18F signal and were ultimately analyzed as biological replicates. Next, tumor cell suspensions were fractionated using serial magnetic bead positive selection according to the manufacturer’s instructions (all Miltenyi mouse kits: CD45 TIL 130-110-618, EPCAM 130-105-958, Thy1.1 130-121-273, CD4/8 TIL 130-116-480, CD11b 130-049-601, F4/80 130-110-443, Gr1 130-094-538, CD11c 130-125-835). Briefly, cells were resuspended at 10 million total cells/90μL MACS buffer and 10μL microbeads for 15min. Then, cell suspensions were applied to LS columns (Miltenyi 130-042-401) in Miltenyi QuadroMACS™ Separators, washed, and eluted according to manufacturer’s instructions. Fractions were resuspended in 1mL of media; 10μL were used for trypan blue staining and TC20 cell count, ~50μL were stained for flow cytometry determination of fraction cellular composition, and 900μL were transferred into 5mL tubes to measure radioactivity. 900μL of 2mL splenocyte suspensions and 5 million total cells from the unfractionated whole tumor were also assayed for radioactivity. The Hidex Automatic Gamma Counter was used with 1min read times to measure time-normalized 18F counts per minute (CPM) for each sample. To determine per cell 18F-nutrient avidity, time-normalized CPM was divided by the number of viable cells as determined by trypan count. Harvested tissues and cell fractions were kept on ice or at 4°C in RPMI 1640 supplemented with 10% FBS except when noted.
Flow Cytometry
Single cell suspensions obtained from tumors and spleens were incubated in Fc block (1:50, BD 553142) for 10min at room temp, stained for surface markers for 15min at room temp, washed with FACS buffer (PBS +2% FBS) once, and resuspended in FACS buffer for analysis on a Miltenyi MACSQuant Analyzer 10 or 16. For intracellular staining, the eBioscience™ Foxp3/transcription factor staining buffer kit (Fisher 00-5523-00) was used. For intracellular cytokine staining, tumor single cell suspensions were incubated for 4hr at 37°C 5% CO2 in supplemented RPMI with PMA (50ng/mL, Sigma Aldrich P8139–1MG), ionomycin (750ng/mL, Sigma Aldrich I0634–1MG), and GolgiPlug (1:1000, BD 555029), and processed using the BD Cytofix/Cytoperm™ Fixation and Permeabilization Solution (ThermoFisher BDB554722). Surface staining was performed as described above, cells were fix/permed for 20min at 4°C, and then stained for intracellular markers for at least 30min at 4°C. Ghost Dye Red 780 viability dye (1:4000, Cell Signaling 18452S) was used identically to surface antibodies. The anti-mouse and cross-reactive antibodies used were: CD45 BV510 (1:1600, 30-F11, Biolegend 103138), B220 e450 (1:400, RA3-6B2, ThermoFisher 48-0452-82), CD11b e450 (1:1600, M1/70, ThermoFisher 48-0112-82), CD11b FITC (1:1600, M1/70, Biolegend 101206), CD8a AF488 (1:1600, 53-6.7, Biolegend 100723), CD8a BV510 (1:600, 53-6.7, BD 563068), Ly6C FITC (1:4000, HK1.4, Biolegend 128006), CD11c PE (1:1000, N418, BioLegend 117308), FOXP3 PE (1:125, FJK-16s, ThermoFisher 12-5773-82), pS6 Ser235/236 PE (1:100, D57.2.2E, Cell Signaling 5316S), CD4 PerCP-Cy5.5 (1:600, RM4-5, BioLegend 100540), Ly6G PerCP-Cy5.5 (1:800, 1A8, BioLegend 127616), F4/80 PE-Cy7 (1:800, BM8, BioLegend 123114), NKp46 PE-Cy7 (1:200, 29A1.4, BioLegend 137618), CD3 PE-Cy7 (1:200, 17A2, BioLegend 100220), CD3 FITC (1:200, 17A2, BioLegend 100204), CD3 APC (1:200 17A2, BioLegend 100236), CD206 APC (1:500, C068C2, BioLegend 141708), GLUT1 AF647 (1:500, EPR3915, Abcam ab195020), EPCAM PE (1:1500, G8.8, BioLegend 118206), Thy1.1 PerCP-Cy5.5 (1:2000, HIS51, ThermoFisher 45-0900-82), CD45 PE (1:1600, 30-F11, ThermoFisher 12-0451-83), Ly6C BV570 (1:400, HK1.4, BioLegend 128030), CD68 BV605 (1:200, FA-11, BioLegend 137021), HK1 AF647 (1:100, EPR10134(B), Abcam ab197864), HK2 AF647 (1:200, EPR20839, Abcam EPR20839), CD71 APC (1:100, RI7217, BioLegend 113820), CD98 PE (1:400, RL388, ThermoFisher 12-0981-81), MHCII I-A/I-E APC (1:4000, M5/114.15.2, BioLegend 107614), CD103 PE-Cy7 (1:200, 2E7, BioLegend 121425), LAG3 e450 (1:100, eBioC9B7W, ThermoFisher 48-2231-82), PD1 PE (1:100, 29F-1A12, BioLegend 135206), TIM3 APC (1:100, RMT3-23, BioLegend 119706), IFNγ APC (1:250, XMG1.2, BioLegend 505810), CD25 e450 (1:500, PD61.5, ThermoFisher 48-0251-82), CD44 PE-Cy7 (1:1000, IM7, BioLegend 103030), and CD62L APC (1:200, MEL-14, ThermoFisher 17-0621-82). The anti-human antibodies used were: CD45 BV421 (1:400, HI30, BioLegend 304032), CD3 APC (1:200, UCHT1, BioLegend 300439), CD11b PerCP-Cy5.5 (1:200, ICRF44, BioLegend 301328), CD14 BV510 (1:200, M5E2, BioLegend 301842), CA9 AF647 (1:200, 303123, R&D Systems FAB2188R-100UG), and Human Fc Block (1:50, BD 564220). For in vivo intravenous CD45 PE labelling, MC38 tumor-bearing mice were injected with 5μg anti-CD45 PE diluted to 150 μL in PBS via tail vein and euthanized 5min later. For ex vivo fluorescent palmitate uptake, tumor single cell suspensions were incubated for 1hr in Krebs buffer (125mM NaCl, 2.5mM KCl, 25mM NaHCO3, 1mM NaH3PO4, 1mM MgCl2, 2.5mM CaCl2, pH 7.2) at 37°C 5% CO2, incubated with BODIPY™ FL C16 (1μM in Krebs buffer, Thermo D3821) for 45min, washed twice with FACS, and then stained for surface markers. For the myeloid suppression assay, microbead-isolated CD11b+ myeloid cells were co-incubated with 100,000 CellTrace Violet-labelled (CTV, Thermo C34557) OT-I splenocytes per well in a 96-well plate in the presence of 1μg/mL SIINFEKL peptide for 3 days prior to analysis by flow cytometry. Flow cytometry data were analyzed using FlowJo v10.7.1.
In vivo 2NBDG and flow sorting
2NBDG (Cayman Chemical 11046) was dissolved in PBS at 5 mM (1.71 mg/mL) and 100μL (500ng) was injected retro-orbitally. Mice were sacrificed 40 minutes later and tumor cells and splenocytes were harvested as indicated above. Splenic T cells were isolated according to manufacturer’s instructions using the Pan T cell Isolation Kit (Miltenyi 130-095-130). 2NBDGhi/lo cells were collected on the Nanocellect (San Diego, USA) WOLF cell sorter and subsequently gamma counted as described in the 18F-FDG and 18F-Gln nutrient uptake assay.
Immunohistochemistry and light microscopy
MC38 tumors were fixed overnight in 10% formalin and then switched to 70% ethanol. Single color IHC was performed by Vanderbilt University Medical Center Translation Pathology Shared Resource. Staining was conducted on the Leica Bond Max IHC stainer. All steps besides dehydration, clearing and coverslipping are performed on the Bond Max. Slides were first deparaffinized. Antigen retrial and antibody dilution were altered for maximal staining with each antibody. For CD11b staining (Catalog # NB110–89474, Novus Biologicals, Centennial, CO) slides were placed in a Protein Block (Ref# x0909, DAKO, Carpinteria, CA) for 10min prior to staining. Then, the slides were incubated in epitope retrieval 2 solution for ten minutes, and subsequently stained (1:10,000 dilution). For CD3 staining (Ab16669, abcam, Cambridge, MA), epitope retrieval 2 solution for 10min prior to staining (1:250 dilution). For F4/80 staining (NB600–404, Novus Biologicals LLC, Littleton, CO), epitope retrieval was conducted in proteinase K for 5 minutes prior to primary antibody staining (1:300 dilution). Rabbit anti rat secondary (BA-4001, Vector Laboratories, Inc., Burlingame, CA) was used at a 1:2000 dilution for 15min for antigen detection. For CD31 staining (Cat.# DIA-310, Dianova, Hamburg, Germany,), epitope retrieval occurred in epitope retrieval 2 solution for 20min and then subsequently stained (1:75ul dilution). Staining with Biotinylated anti rat (Cat.# BA-4000, Vector Laboratories, Inc., Burlingame, CA) was used for antigen detection at a 1:2000 dilution for 15min. For CD45lca staining (cat# HS-427 017, SySy (Synaptic Systems), Goettingen, Germany) epitope retrieval occurred in epitope retrieval solution 2 for 20min, followed by primary antibody (1:500 dilution. Rabbit anti-rat secondary (BA-4001, Vector Laboratories, Inc., Burlingame, CA) was used at a 1:2000 dilution for 15min to detect the antigen. The Bond Refine (DS9800, Buffalo Grove, IL, USA) detection system was used for visualization. Images were captured using an Olympus BX53 microscope (Olympus Corporation, Center Valley, PA), an Olympus DP73 camera, and Olympus cellSens Standard imaging software version 1.17. Low-power images were captured with a 4X objective lens and high-power images were captured with a 40X objective lens.
MC38 anti-F4/80 microbead-fractionated TAM were mounted onto slides using Wescor Cytopro cytocentrifuge and stained with hematoxylin and eosin following manufacturer’s guidelines (Fisher 23–122952). Images were captured under oil immersion (100x objective) using an Olympus BX53 microscope (Olympus Corporation, Center Valley, PA), an Olympus DP73 camera, and Olympus cellSens Standard imaging software.
Extracellular flux assay
Tumor cell fractions were obtained as described above. Each fraction was plated at 200,000 live cells/well in technical quadruplicate on a Cell-Tak-coated plate (Corning 354240) in Agilent Seahorse RPMI 1640 supplemented with 10mM glucose, 1mM sodium pyruvate, and 2mM glutamine. Cells were analyzed on a Seahorse XFe 96 bioanalyzer using the Mitostress assay (Agilent 103015–100) with 1μM oligomycin, 2μM FCCP, and 0.5μM rotenone/antimycin A. Data were analyzed in Agilent Wave software version 2.6.
Cell sorting and mRNA transcript analysis
CD45+ and CD45− tumor cell fractions were obtained as described above. Cell fractions were stained for the indicated surface markers and viability dye and sorted on a BD FACSAria III cell sorter. RNA was isolated from tumor cell populations and unstained whole tumor single cell suspensions using the Quick-RNA™ Microprep Kit (Zymo R1050) according to manufacturer’s instructions. RNA transcripts were quantified using the NanoString nCounter Metabolic Pathways Gene Expression Panel (XT-CSO-MMP1–12) according to manufacturer’s instructions. Transcript counts of 768 genes enriched in cellular metabolic pathways were analyzed using NACHOv1.0.135, an R package for parsing, visualization, quality control, and normalization designed for NanoString nCounter data. While parsing raw transcript counts, manufacturer-designated housekeeping genes were used to normalize between samples: Abcf1, Agk, Cog7, Dhx16, Dnajc14, Edc3, Fcf1, G6Pdx, Mrps5, Nrde2, Oaz1, Polr2a, Sap130, Shda, Stk11ip, Tbc1d10b, Tbp, Tlk2, Ubb, Usp39. Sample quality was evaluated based on normal ranges provided by the manufacture for 1) binding density (0.1–2.25), 2) Field of View (<75), 3) Positive Control Linearity (<0.95), and 4) limit of detection (<2). Samples were excluded if they failed any of the four conditions. The third replicates of M-MDSC Rapa and CD4 Rapa were excluded as outliers for abnormal positive control linearity and limit of detection, respectively. Normalization was performed using geometric means based on housing genes, positive, and negative controls. The normalized data from this experiment has been deposited in Geo and can be accessed at GSE165223. Principal component analysis was performed using “FactoMineRv2.3”36 package in R. Differentially expressed metabolic genes were identified using a one-way ANOVA performed on transcript count across samples. P-values were adjusted for multiple testing using Benjamini & Hochberg false discovery rate using the “p.adjust” R function. For metabolic genes passing an adjusted p-value <0.01, we performed hierarchical clustering across samples and genes using default settings with the ‘seaborn’ package (version v0.11.0) in Python. Based on the hierarchical clustering, we grouped genes and performed gene set enrichment analyses using gProfiler37 with Reactome gene sets compared to all genes. “Metabolism” was the most highly enriched pathway for each cell type and was excluded from bar graphs for space. Differentially expressed genes between the rapamycin and vehicle treated samples for each cell type were identified using “edgeR”38 (version 3.28.1). First, the dispersion (variance of transcript counts) was estimated using the function “estimateDisp”. Next, the differential expression between conditions was evaluated using a likelihood ratio test for a negative binomial generalized log-linear model. We considered transcripts with a false discovery rate < 10% and/or a 2-tailed t-test p-value <0.01 as being differentially expressed. All analyses were performed using the R (version 4.0.2).
Quantification and Statistical Analysis
Graphs and statistical tests were generated using GraphPad Prism 9 unless otherwise noted. Sample sizes were chosen based on previous studies.
Extended Data
Extended Data Fig. 1 |. Supporting data for Fig. 1.
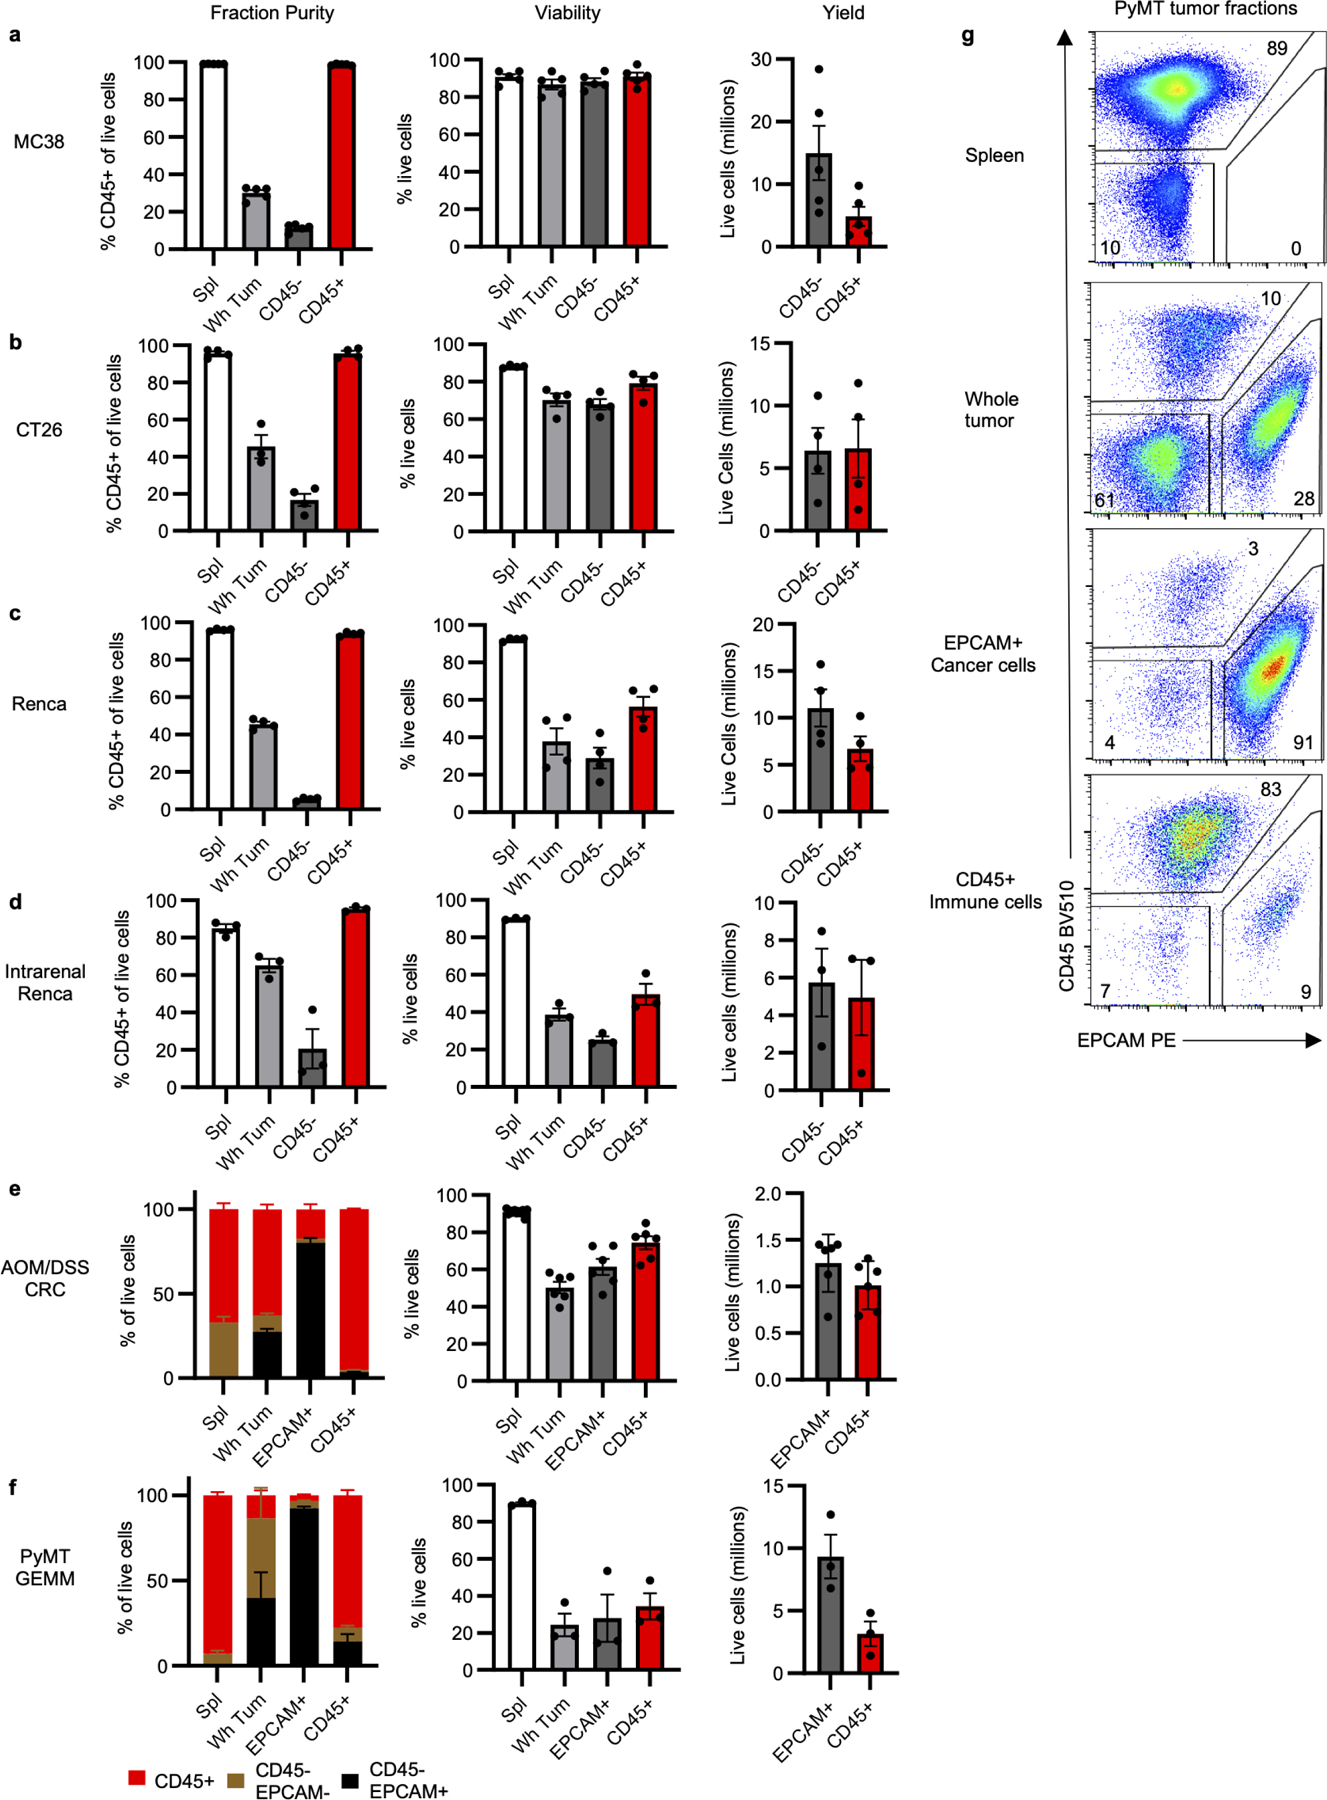
a-f, Fraction purity, viability, and yield for (a) MC38 (n=5 mice), (b) CT26 (n=4 mice), and (c) Renca (n=4 mice) subcutaneous tumors; (d) intrarenal Renca tumors (n=3 mice); (e) AOM/DSS-induced CRC tumors (n=6 for tumors, n=11 mice for spleens); and (f) spontaneous PyMT GEMM (n=3 mice) tumors. g, Representative flow cytometry analysis of PyMT and AOM/DSS CRC whole tumor, CD45+ immune cell, and EPCAM+ cancer cell fractions gated on live cells. Each data point represents a biological replicate and graphs show mean and SEM. Data are representative studies performed independently at least twice. AOM/DSS CRC: azoxymethane/dextran sodium sulfate-induced colorectal cancer; GEMM: genetically engineered mouse model; PyMT: polyoma virus middle T antigen.
Extended Data Fig. 2 |. Validation of in vivo cellular FDG uptake assay.

a, Intravenous (IV) anti-CD45 PE staining of leukocytes from designated tissues gated on live CD45+ cells. b, Demonstration of dynamic range of 18F quantification using serially diluted in vivo FDG-labelled splenocytes. c, Correlation plots of CPM/live cell versus cell viability, cells counted, and tumor mass across multiple tumor cell populations. Only “CD45−” and “Other CD45+” simple linear regressions had slopes significantly different than 0 for tumor mass (n=10 mice). d, FDG-labelled digest supernatant from in vivo labelled MC38 tumors was applied to FDG-naïve MC38 tumor single cell suspensions to determine ex vivo background FDG uptake contribution to final signal. e, Cellular FDG avidity in designated ex vivo and in vivo labelled MC38 tumor cell populations (n=4 mice/group). f, Cellular FDG avidity in designated tumor cell fractions from MC38-Thy1.1 tumors (n=2 mice). g, Proportion of CD45+ and Thy1.1+ cells, cell viability, and live cell yield from MC38-Thy1.1 tumors (n=2 for tumors, n=5 mice for spleens). h, Representative flow cytometry analysis of MC38-Thy1.1 tumor fractions. Each data point represents a biological replicate and graphs show mean and SEM. (b, d-h) are data from a representative study performed independently at least twice. * p<0.05, ** p<0.01, *** p<0.001. Statistics are provided in source data. CPM: counts per minute.
Extended Data Fig. 3 |. In vivo 2NBDG uptake does not mirror FDG uptake.

a, Representative histograms of in vivo 2NBDG uptake in splenic and MC38 tumor cell subsets. b, MFI of in vivo 2NBDG uptake across spleen and MC38 tumor cells (n=3 mice). c-d, Representative histograms of in vivo splenic CD4 (c) and CD8 (d) T cell 2NBDG uptake. e, 2NBDG staining in splenic CD4+ and CD8+ subsets (n=3 mice). f, Schema for 2NBDG/FDG co-injection experiment. g, Representative histogram of 2NBDG hi and 2NBDG lo populations collected via flow sorting. h, Per cell FDG avidity of flow-sorted 2NBDGlo versus 2NBDGho splenic T cells (n=3 mice). Each data point represents a biological replicate and graphs show mean and SEM. Data are from representative studies performed independently at least twice. P values were calculated using the Brown-Forsythe and Welch ANOVA with Dunnett’s T3 for multiple comparison tests for (b,e), 2-tailed Welch’s t test for CD4 comparisons in (e), and a paired t-test for (h). * p<0.05, ** p<0.01, *** p<0.001. Exact p-values are provided in source data. 2NBDG: 2-(N-(7-Nitrobenz-2-oxa-1,3-diazol-4-yl)Amino)-2-Deoxyglucose); CM: central memory; CPM: counts per million; EM: effector memory; FDG: fluorodeoxyglucose; Tconv; conventional CD4 T cell; Treg: regulatory CD4 T cell
Extended Data Fig. 4 |. Spatial organization of immune cells in subcutaneous MC38 tumors.

Representative micrographs of H&E and indicated immunohistochemistry (IHC) stains of subcutaneous MC38 tumors. Arrows indicate positive cells on faint CD11b stain. Center column is low power overview (scale bar = 200μm). Insets demonstrate high power images from central (left) and peripheral (right) tumor locations (scale bar = 20μm). Images are representative from 5 biological replicates.
Extended Data Fig. 5 |. Tumor model characterizations by flow cytometry.
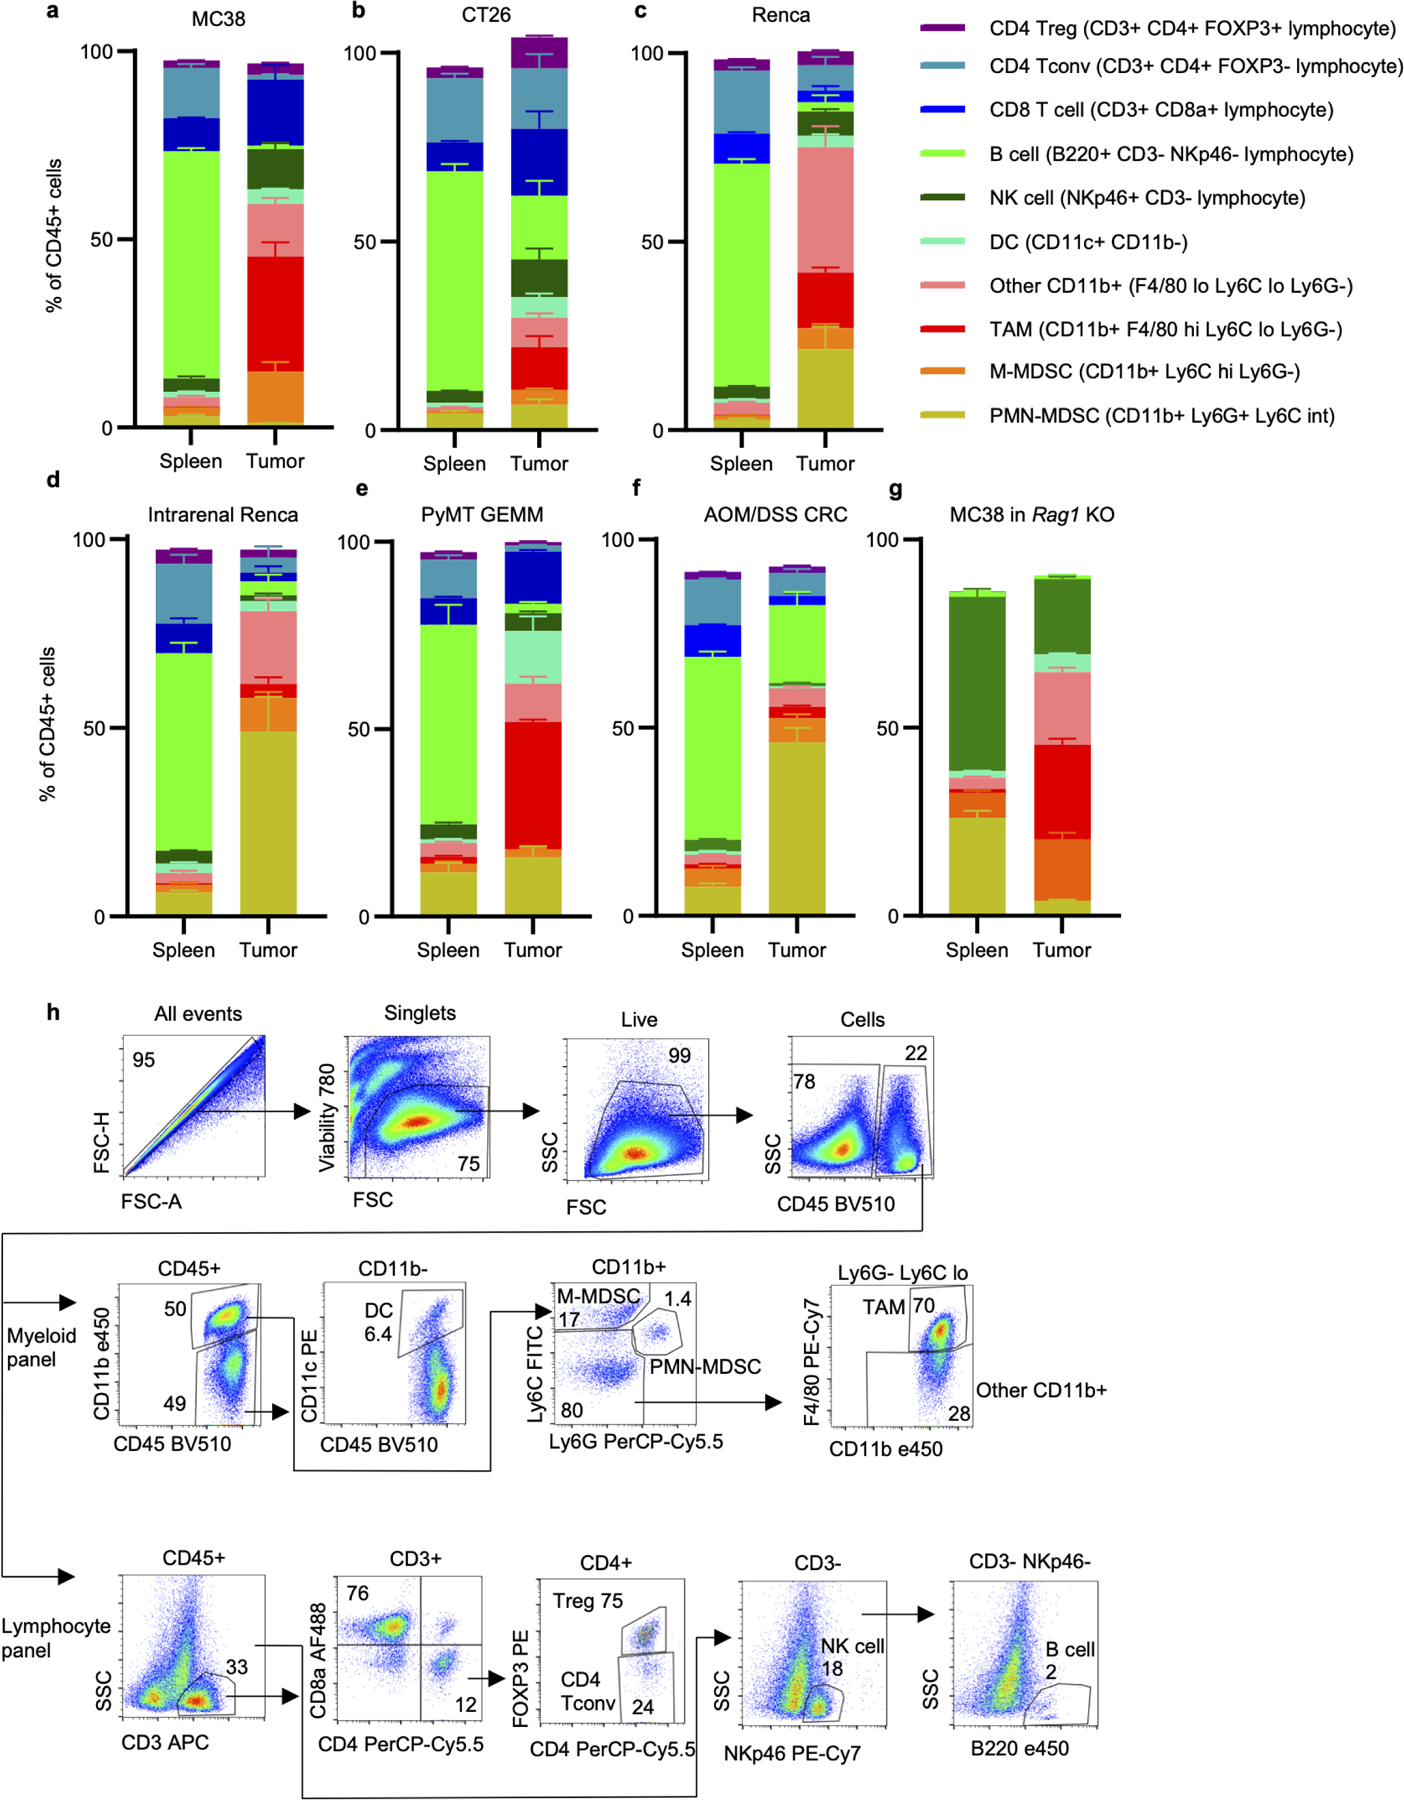
a-g, Spleen and tumor CD45+ immune cell populations from MC38 (a) (n=3 mice), CT26 (b) (n=4 mice), and Renca (c) (n=4 mice) subcutaneous tumors; intrarenal Renca tumors (d) (n=3 mice); spontaneous PyMT GEMM tumors (e) (n=3 mice); AOM/DSS CRC tumors (f) (n=6 for tumors, n=11 mice for spleens); and MC38 subcutaneous tumors grown in Rag1−/− mice (g) (n=6 mice). h, Gating strategy for immune cell identification using lymphocyte and myeloid-focused antibody panels. Each data point represents a biological replicate and graphs show mean and SEM. Data from a-f are representative of independent experiments performed at least twice. DC: dendritic cell; M-MDSC: monocytic myeloid-derived suppressor cell; NK cell: natural killer cell; PMN-MDSC: polymorphonuclear myeloid-derived suppressor cell; PyMT: polyoma virus middle T antigen; TAM: tumor-associated macrophage.
Extended Data Fig. 6 |. Supporting data for Fig. 2.
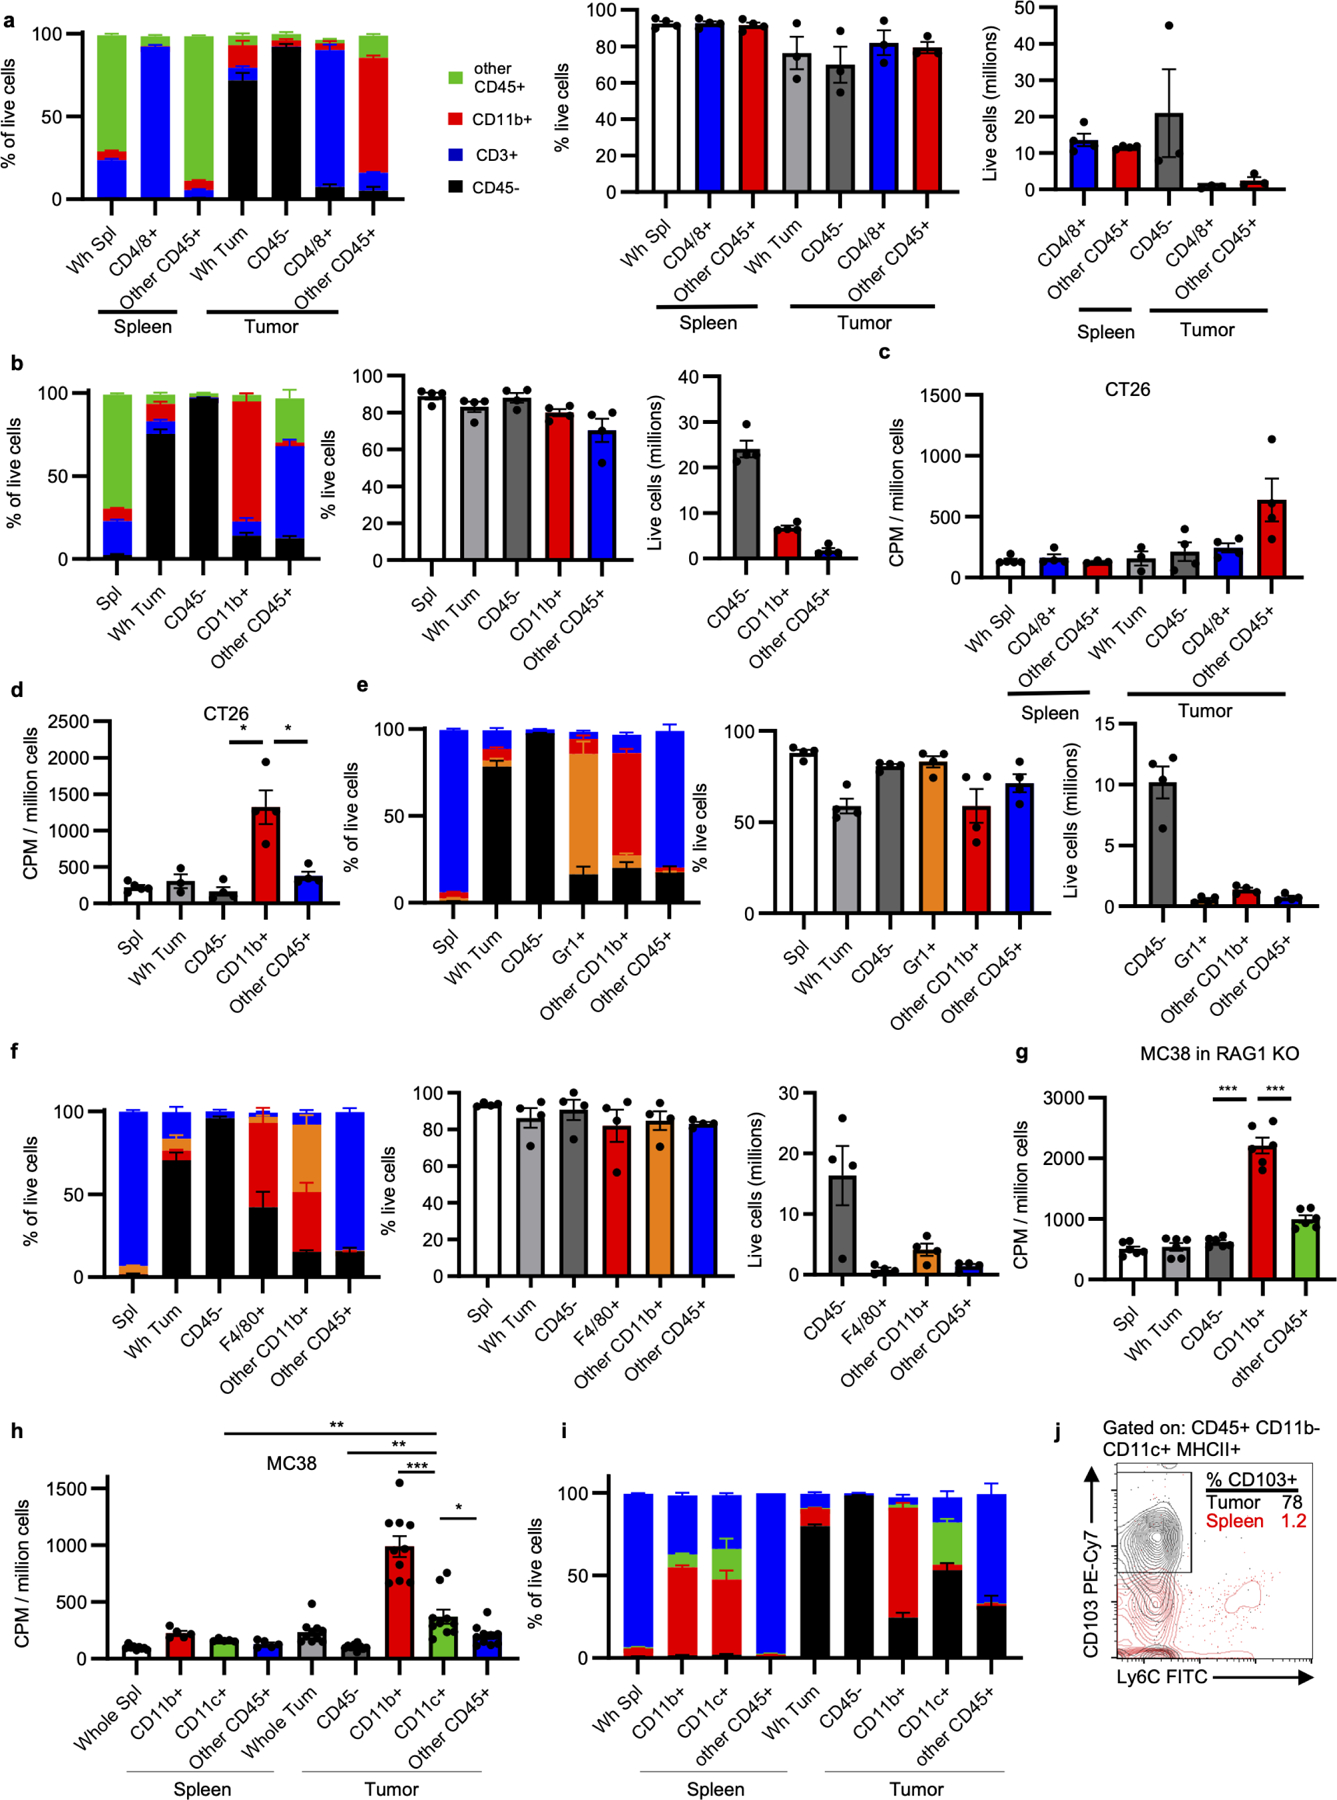
a-b, Fraction composition, viability, and live cell yield from MC38 tumor fractions isolated using CD4/8 microbeads (n=3 for tumors, n=4 mice for spleens) (a) and CD11b microbeads (n=4 mice) (b). c-d, Cellular FDG avidity in designated CT26 tumor cell fractions using CD4/8 microbeads (n=5 for Wh Spl, n=3 for Spl other CD45+ and Wh Tum, n=4 mice for all others) (c) and CD11b microbeads (n=5 for spleens, n=3 for Wh Tum, and n=4 mice for all others) (d). c-f, Fraction composition, viability, and live cell yield from MC38 tumor fractions isolated using Gr1 microbeads (e) and F4/80 microbeads (f) (n=4 mice). g, Cellular FDG avidity in designated MC38 tumor cell fractions from Rag1 KO mice (n=6 mice). h, Cellular FDG avidity in MC38 tumor cell fractions using CD11b and CD11c microbeads (n= 9 for Wh Spl, n=5 for spleen fraction, n=10 mice for all others). i, Fraction composition of CD11c purification (n= 9 for Wh Spl, n=5 for spleen fraction, n=10 mice for all others). j, Representative flow cytometry illustrating CD103 and Ly6C staining of cDC (CD45+ CD11b− CD11c+ MHCII+ cells) from MC38 tumor and spleen. Each data point represents a biological replicate and graphs show mean and SEM. Data are representative of independent experiments performed at least twice. (h) includes data from two independent experiments. P values were calculated using Welch’s 2-tailed t-test. Exact p-values are provided in source data. * p<0.05. ** p<0.01, *** p<0.001. cDC1: type 1 conventional dendritic cell
Extended Data Fig. 7 |. Supporting data for Fig. 3.
a, pS6 levels in CT26 tumor populations (n=5 mice). b, MC38 tumor mass at study endpoint with rapamycin (n=20 for veh, n=19 mice for rapa). c, Metabolite concentrations in tumor interstitial fluid (TIF) and matched plasma from MC38 tumor-bearing mice treated with rapamycin or vehicle (n=5, except for lactate and glutamine plasma and TIF veh n=4 mice). d, Immune cell infiltration of MC38 tumors from mice treated with rapamycin or vehicle (n=15 for veh, n=19 mice for rapa). Significance between rapamycin and vehicle treatment for individual populations indicated in legend. Significant decrease in total CD45+ cell infiltration is noted. e-f, Flow cytometry quantification of Ki67 positivity (e) and cell size (forward scatter, FSC) (f) from MC38 tumor populations in mice treated with rapamycin or vehicle (n=4 for veh, n=5 mice for rapa). g-k MC38 tumor CD3+CD8a+ T cell phenotypes from rapamycin or vehicle treated mice for effector memory phenotype (g), ex vivo IFNγ production (h), PD1 and TIM3 expression (i), LAG3 expression (j) (n=5 mice/group), and ratio of CD8 T cells to CD4+FOXP3+ Treg (k) (n=15 for veh, n=19 mice for rapa). l, % M2-like TAM (CD11cloCD206hi) in MC38 tumors from mice treated with rapamycin or vehicle (n=15 for veh, n=19 mice for rapa). m-n, Myeloid suppression assay representative histogram of CD8a+ OT-I T cell dilution of CellTrace Violet (CTV) indicative of proliferation (m) and quantification of division index (n) for MC38 tumor myeloid cells isolated using CD11b microbeads from rapamycin and vehicle-treated mice (n=5 mice/group). Each data point represents a biological replicate and graphs show mean and SEM. Data in (a, e-j) are representative of independent experiments performed at least twice. (b, d, k-l) display data merged from 4 independent experiments. P values were calculated using the Brown-Forsythe and Welch ANOVA with Dunnett’s T3 for multiple comparison tests (a) and Welch’s 2-tailed t-test (b-l, n). * p<0.05. ** p<0.01, *** p<0.001. Exact p-values are provided in source data. pS6: phosphorylated ribosomal protein S6 (Ser235/236); Rapa: rapamycin; TIF: tumor interstitial fluid.
Extended Data Fig. 8 |. Metabolic transcriptional signatures of MC38 tumor cell populations.
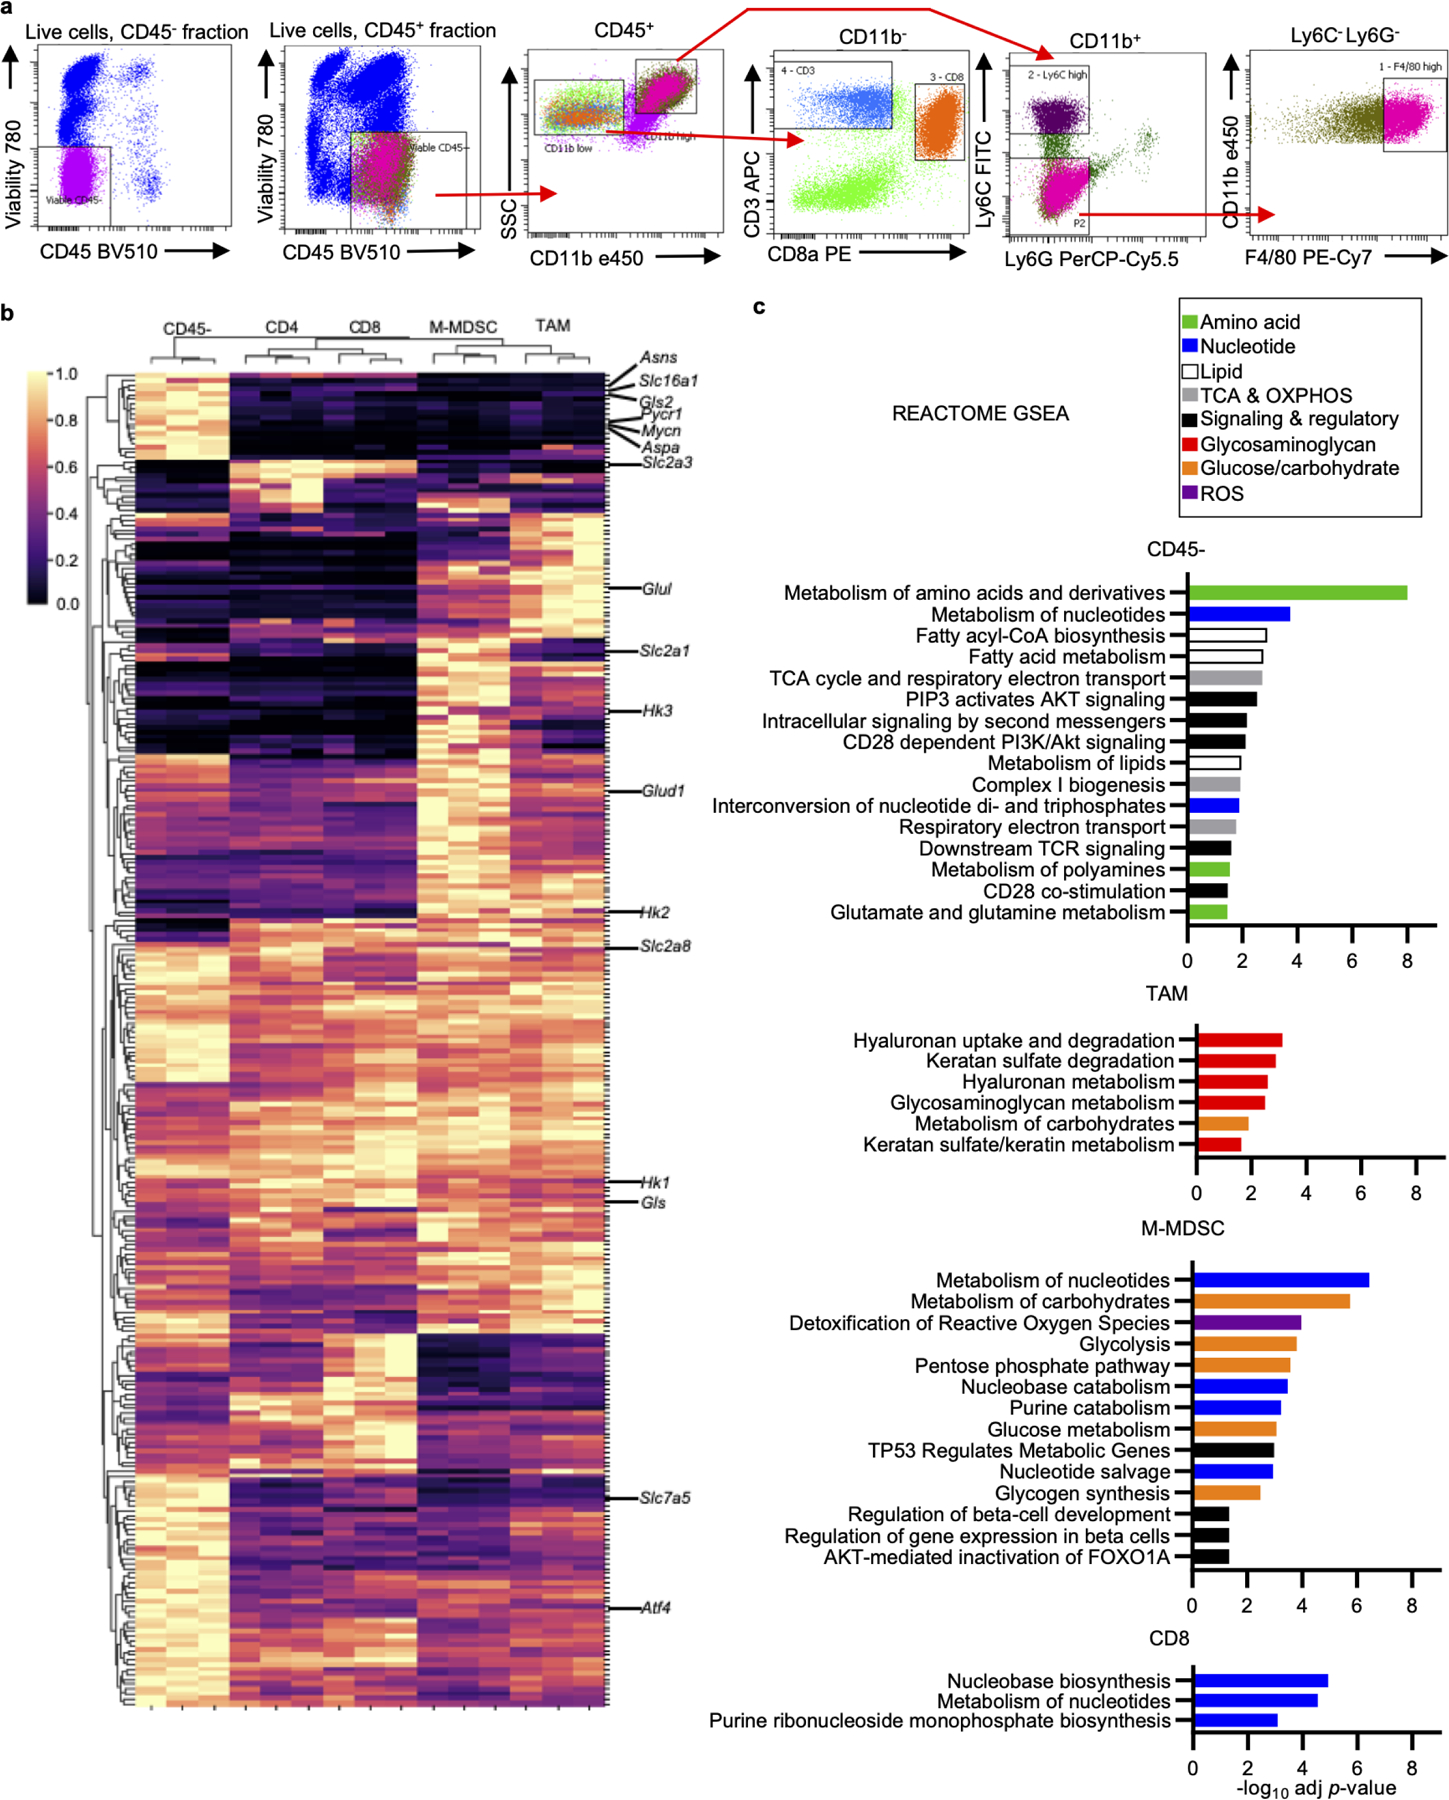
a, Cell sorting scheme of MC38 tumor cell populations used for mRNA transcript analyses. b, Clustering analysis heatmap of differentially expressed metabolic genes from MC38 tumor cell populations. Select genes annotated. c, Reactome gene set enrichment analysis for genes most highly expressed in each MC38 tumor population. Significantly enriched gene sets are shown and colored according to metabolic pathway. OXPHOS; oxidative phosphorylation; TCA; tricarboxylic acid cycle
Extended Data Fig. 9 |. Effect of rapamycin on MC38 tumor population metabolic markers.
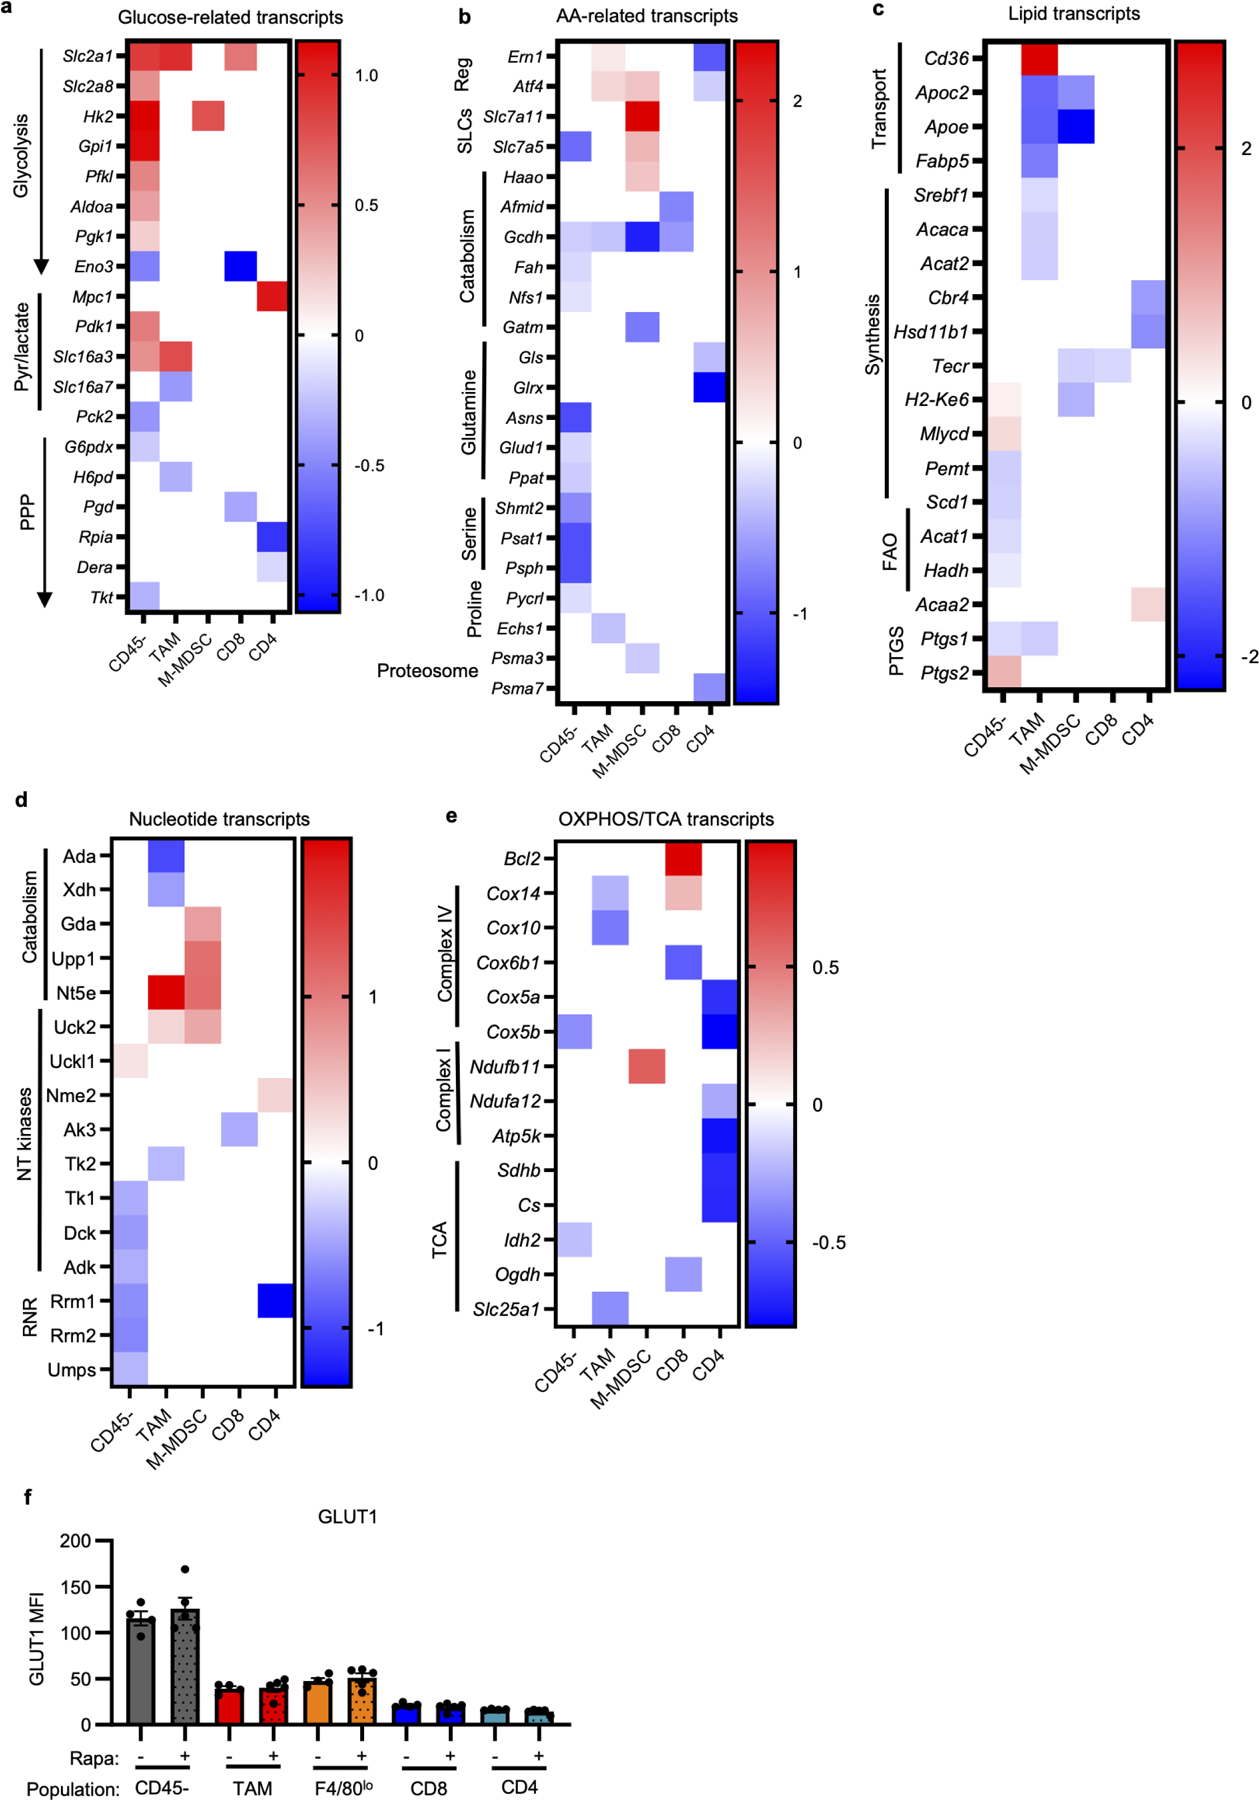
a-e, Heatmaps of significantly altered metabolic genes between rapamycin and vehicle-treated MC38 tumor cell populations for indicated metabolic pathways. White spaces indicate non-significant changes with rapamycin treatment for that gene and tumor cell population. Genes were grouped and classified manually. (n=3/group, except n=2 for rapamycin treated M-MDSC and CD4) f, Flow cytometry quantification of GLUT1 expression in MC38 tumor populations from mice treated with rapamycin or vehicle (n=4 for veh, n=5 mice for rapa). Each data point represents a biological replicate and graphs show mean and SEM. Exact p-values are provided in source data. AA: amino acid; FAO: fatty acid oxidation; NT: nucleotide; OXPHOS: oxidative phosphorylation; PPP: pentose phosphate pathway; PTGS: prostaglandin synthases; Reg: regulatory genes; RNR: ribonucleotide reductase; SLCs: solute carrier proteins; TCA tricarboxylic acid cycle
Extended Data Fig. 10 |. Supporting data for Fig. 4.
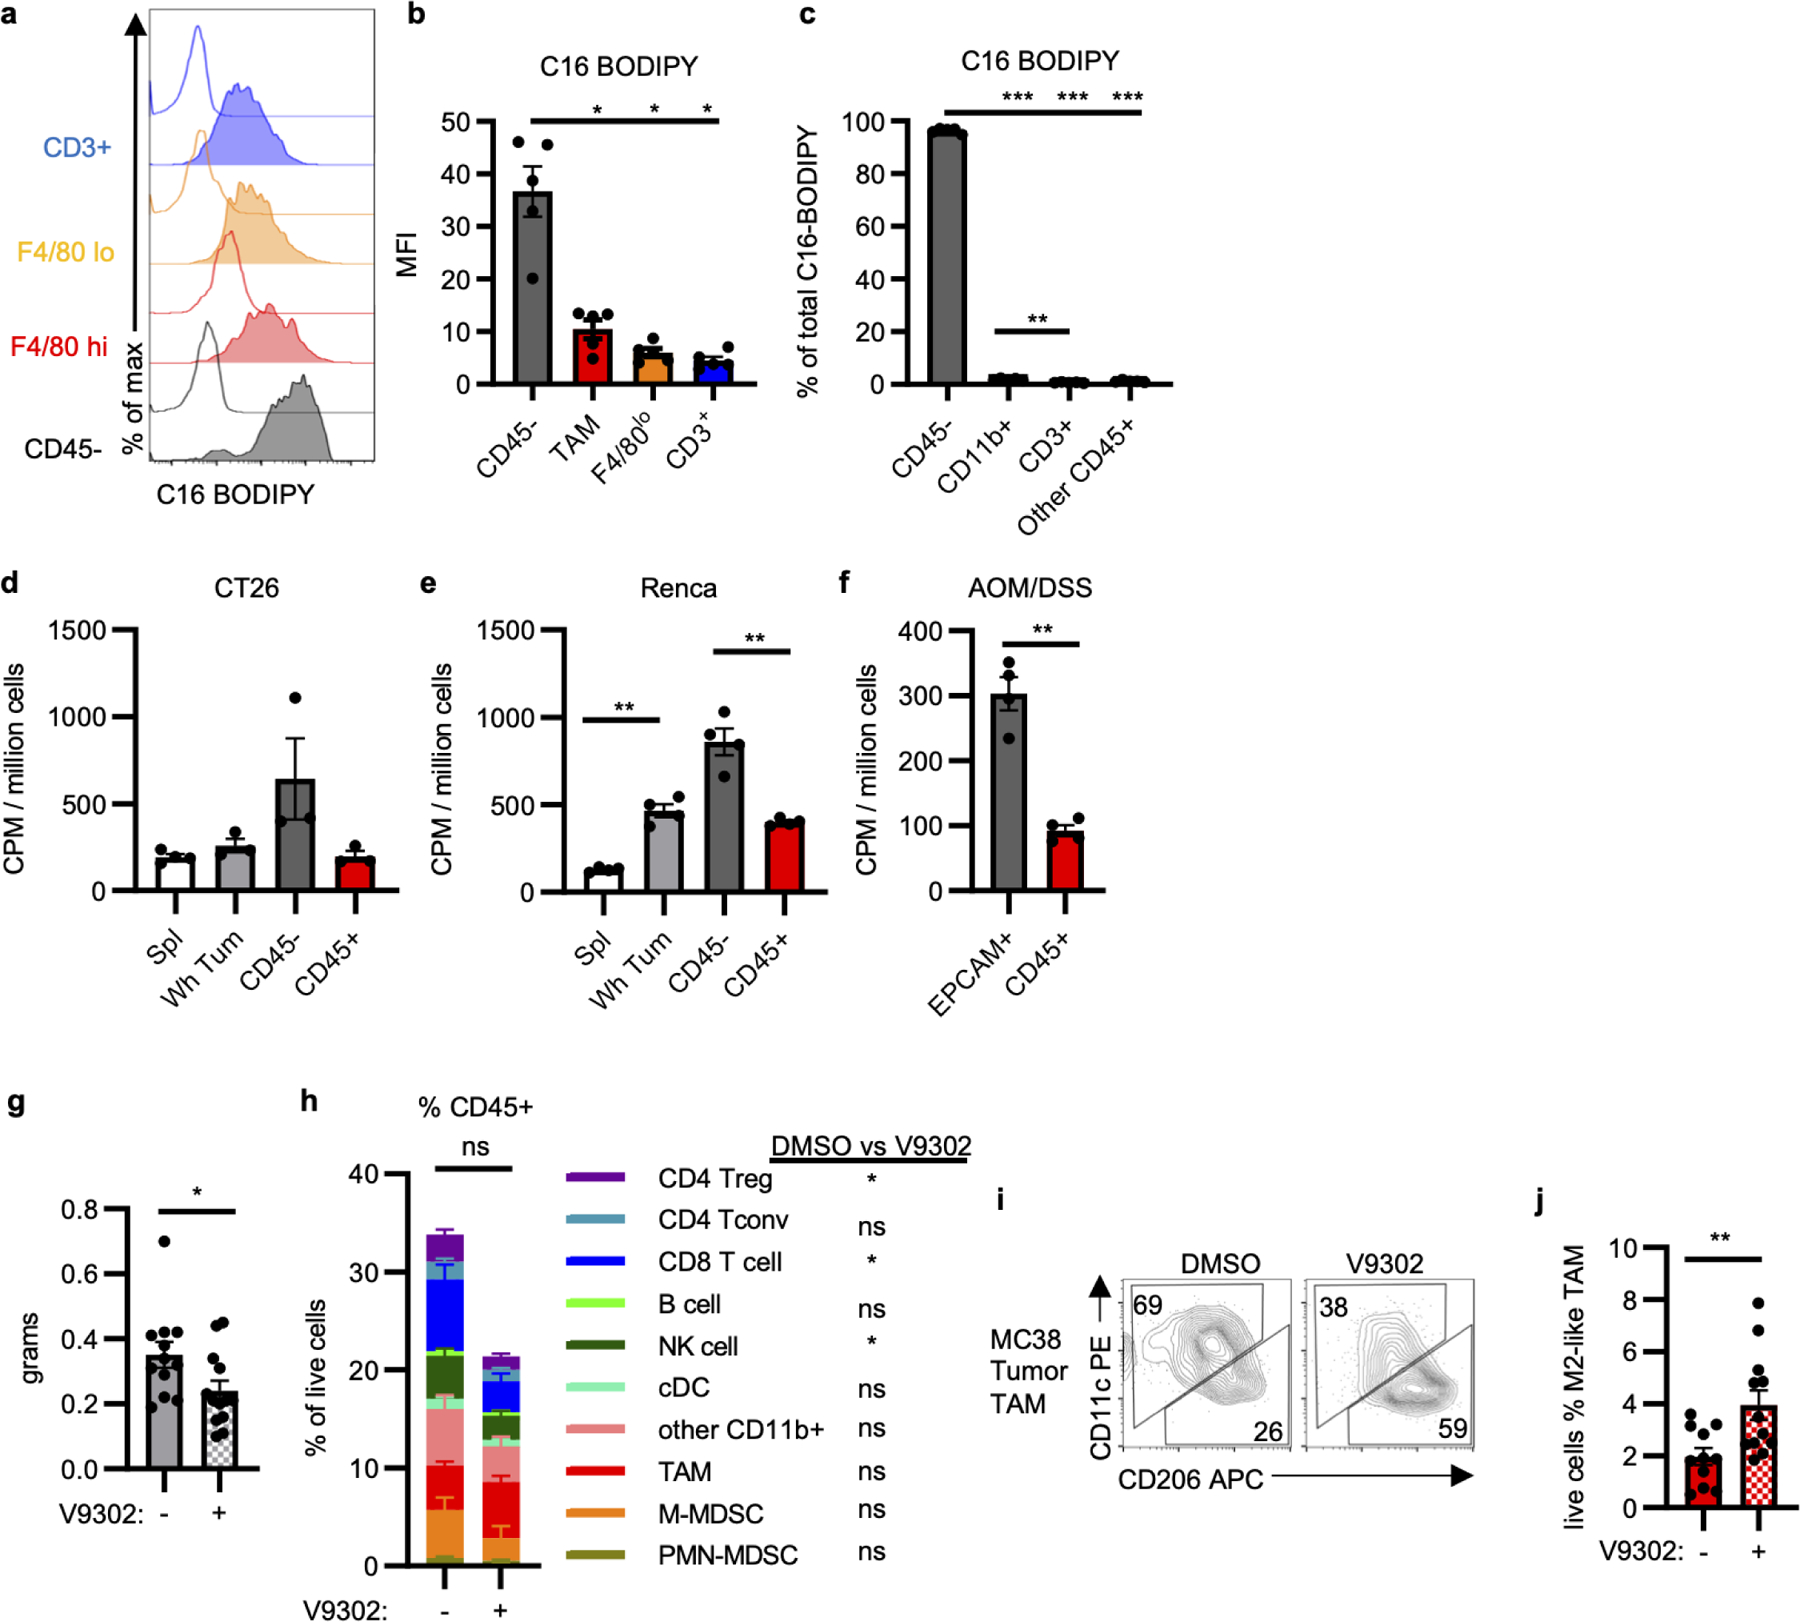
a-b, Representative histograms (a) and quantification (b) for ex vivo staining of C16 BODIPY by indicated MC38 tumor cell populations from tumor single cell suspensions (n=5 mice). c, Percent contribution to total tumor C16 BODIPY signal from indicated tumor cell populations (n=5 mice). d-f, Cellular 18F-Gln avidity in designated tumor cell fractions in CT26 (n=4 for spleen, n=3 mice for tumor) (d) and Renca (n=5 mice) (e) subcutaneous tumors and AOM/DSS spontaneous tumors (n=4 mice) (f). g, MC38 tumor mass from mice treated with V9302 or DMSO (n=13 for V9302, n=12 mice for DMSO). h, Immune cell infiltration of MC38 tumors from mice treated with V9302 or DMSO (n=13 for V9302, n=12 mice for DMSO). Significance between V9302 and DMSO treatment in distinct populations is indicated in legend. There is no significant change in total CD45+ cell infiltration (n=13 for V9302, n=12 mice for DMSO). i-j, Representative plot (i) and abundance (j) of MC38 M2-like TAM from mice treated with V9302 or DMSO (n=13 for V9302, n=12 mice for DMSO). Each data point represents a biological replicate and graphs show mean and SEM. Data are representative of at least two independent experiments. (g-j) are data combined from two experiments. P values were calculated using the Brown-Forsythe and Welch ANOVA with Dunnett’s T3 for multiple comparison tests (b,c) or Welch’s 2-tailed t-test (d-j). * p<0.05, ** p<0.01, *** p<0.001. Exact p-values are provided in source data. C16 BODIPY: C16 (4,4-Difluoro-5,7-Dimethyl-4-Bora-3a,4a-Diaza-s-Indacene-3-Hexadecanoic Acid) (fluorescent analog of palmitate); V9302: glutamine uptake inhibitor
Supplementary Material
Acknowledgements
We thank members of the Rathmell labs for their constructive input. We thank the Justin Balko, Young Kim, and Paula Hurley labs for the use of their tumor dissociators, the Center for Small Animal Imaging at the VUIIS for PET-CT imaging support, and the VUMC Radiochemistry core for synthesis and handling of radioactive material. This work was supported by F30 CA239367 (MZM), F30 CA247202 (BIR), F30 DK120149 (REB), R01 CA217987 (JCR), NIH T32 GM007753 (BTD), R01 DK105550 (JCR), AHA 20PRE35080073 (AA), VA Merit 1I01BX001426 (CSW), Crohn’s and Colitis Foundation 623541 (CSW), American Association for Cancer Research (BIR, WKR), T32 GM007347 (MZM, BIR, REB, AA, AS, CSW), K12 CA090625 (KEB, WKR), K00 CA234920 (JEB), and the Vanderbilt-Incyte Alliance (JCR, WKR). The Vanderbilt VANTAGE Core, including Paxton Baker, provided technical assistance for this work. VANTAGE is supported in part by CTSA Grant (5UL1 RR024975-03), the Vanderbilt Ingram Cancer Center (P30 CA68485), the Vanderbilt Vision Center (P30 EY08126), and NIH/NCRR (G20 RR030956). For the MC38-Thy1.1 cells, we thank the cell and genome engineering core of the Vanderbilt O’Brien Kidney Center (P30 DK114809). Flow sorting experiments were performed in the VMC Flow Cytometry Shared Resource by David K. Flaherty and Brittany K. Matlock and was supported by the Vanderbilt Ingram Cancer Center (P30 CA68485) and the Vanderbilt Digestive Disease Research Center (P30 DK058404). This work was supported by grant 1S10OD019963-01A1 for the GE TRACERlab FX2 N and Comecer Hotcell, housed in the Vanderbilt University Institute of Imaging Science - Radiochemistry Core to synthesize 18F-Gln. The Inveon microPET was funded by NIH 1S10 OD016245. We acknowledge the Translational Pathology Shared Resource supported by NCI/NIH Cancer Center Support Grant 5P30 CA68485-19 and the Vanderbilt Mouse Metabolic Phenotyping Center Grant 2 U24 DK059637-16. The Shared Instrumentation Grant S10 OD023475-01A1 for the Leica Bond RX MicroArrayer, and also the VA shared equipment grant for the LCM: IS1BX003154. Figure 1D, Figure 4K, and Extended Data Figures 2D and 3F were created with Biorender.com.
Competing Interest Declaration
JCR has held stock equity in Sitryx and within the past two years has received unrelated research support, travel, and honorarium from Sitryx, Caribou, Nirogy, Kadmon, Calithera, Tempest, Merck, Mitobridge, and Pfizer. Within the past two years WKR has received unrelated clinical research support from Bristol-Meyers Squib, Merck, Pfizer, Peloton, Calithera, and Incyte. HCM holds a patent for V9302 (WO 2018/107173 Al). MGVH is a founder of Auron Therapeutics and is a member of the SAB for Agios Pharmaceuticals, Aeglea Biotherapeutics, and iTeos Therapeutics.
Footnotes
Data Availability Statement (DAS)
All data will be made available upon reasonable request to JCR/WKR. Tumor mRNA transcript data that support the findings of this study have been deposited in Gene Expression Omnibus (GEO) under accession GSE165223. These data are also found in Supplementary Information Table 4.
Code Availability Statement (CAS)
The code used to support tumor mRNA transcript analysis has been previously published (see methods references) and will be made available upon request to JCR/WKR.
References
- 1.Vander Heiden MG & DeBerardinis RJ Understanding the Intersections between Metabolism and Cancer Biology. Cell 168, 657–669, doi: 10.1016/j.cell.2016.12.039 (2017). [DOI] [PMC free article] [PubMed] [Google Scholar]
- 2.Siska PJ et al. Mitochondrial dysregulation and glycolytic insufficiency functionally impair CD8 T cells infiltrating human renal cell carcinoma. JCI Insight 2, doi: 10.1172/jci.insight.93411 (2017). [DOI] [PMC free article] [PubMed] [Google Scholar]
- 3.Ho PC et al. Phosphoenolpyruvate Is a Metabolic Checkpoint of Anti-tumor T Cell Responses. Cell 162, 1217–1228, doi: 10.1016/j.cell.2015.08.012 (2015). [DOI] [PMC free article] [PubMed] [Google Scholar]
- 4.Chang CH et al. Metabolic Competition in the Tumor Microenvironment Is a Driver of Cancer Progression. Cell 162, 1229–1241, doi: 10.1016/j.cell.2015.08.016 (2015). [DOI] [PMC free article] [PubMed] [Google Scholar]
- 5.Faubert B et al. Lactate Metabolism in Human Lung Tumors. Cell 171, 358–371 e359, doi: 10.1016/j.cell.2017.09.019 (2017). [DOI] [PMC free article] [PubMed] [Google Scholar]
- 6.Ma EH et al. Metabolic Profiling Using Stable Isotope Tracing Reveals Distinct Patterns of Glucose Utilization by Physiologically Activated CD8(+) T Cells. Immunity 51, 856–870 e855, doi: 10.1016/j.immuni.2019.09.003 (2019). [DOI] [PubMed] [Google Scholar]
- 7.Liu PS et al. alpha-ketoglutarate orchestrates macrophage activation through metabolic and epigenetic reprogramming. Nat Immunol 18, 985–994, doi: 10.1038/ni.3796 (2017). [DOI] [PubMed] [Google Scholar]
- 8.Johnson MO et al. Distinct Regulation of Th17 and Th1 Cell Differentiation by Glutaminase-Dependent Metabolism. Cell 175, 1780–1795 e1719, doi: 10.1016/j.cell.2018.10.001 (2018). [DOI] [PMC free article] [PubMed] [Google Scholar]
- 9.Leone RD et al. Glutamine blockade induces divergent metabolic programs to overcome tumor immune evasion. Science 366, 1013–1021, doi: 10.1126/science.aav2588 (2019). [DOI] [PMC free article] [PubMed] [Google Scholar]
- 10.Scharping NE et al. Mitochondrial stress induced by continuous stimulation under hypoxia rapidly drives T cell exhaustion. Nat Immunol, doi: 10.1038/s41590-020-00834-9 (2021). [DOI] [PMC free article] [PubMed] [Google Scholar]
- 11.Sullivan MR et al. Quantification of microenvironmental metabolites in murine cancers reveals determinants of tumor nutrient availability. Elife 8, doi: 10.7554/eLife.44235 (2019). [DOI] [PMC free article] [PubMed] [Google Scholar]
- 12.Cortese N et al. Metabolome of Pancreatic Juice Delineates Distinct Clinical Profiles of Pancreatic Cancer and Reveals a Link between Glucose Metabolism and PD-1(+) Cells. Cancer Immunol Res 8, 493–505, doi: 10.1158/2326-6066.CIR-19-0403 (2020). [DOI] [PubMed] [Google Scholar]
- 13.Gemta LF et al. Impaired enolase 1 glycolytic activity restrains effector functions of tumor-infiltrating CD8(+) T cells. Sci Immunol 4, doi: 10.1126/sciimmunol.aap9520 (2019). [DOI] [PMC free article] [PubMed] [Google Scholar]
- 14.Sinclair LV, Barthelemy C & Cantrell DA Single Cell Glucose Uptake Assays: A Cautionary Tale. Immunometabolism 2, e200029, doi: 10.20900/immunometab20200029 (2020). [DOI] [PMC free article] [PubMed] [Google Scholar]
- 15.Nair-Gill E et al. PET probes for distinct metabolic pathways have different cell specificities during immune responses in mice. J Clin Invest 120, 2005–2015, doi: 10.1172/JCI41250 (2010). [DOI] [PMC free article] [PubMed] [Google Scholar]
- 16.Hesketh RL et al. Magnetic Resonance Imaging Is More Sensitive Than PET for Detecting Treatment-Induced Cell Death-Dependent Changes in Glycolysis. Cancer Res 79, 3557–3569, doi: 10.1158/0008-5472.CAN-19-0182 (2019). [DOI] [PMC free article] [PubMed] [Google Scholar]
- 17.Spranger S, Dai D, Horton B & Gajewski TF Tumor-Residing Batf3 Dendritic Cells Are Required for Effector T Cell Trafficking and Adoptive T Cell Therapy. Cancer Cell 31, 711–723 e714, doi: 10.1016/j.ccell.2017.04.003 (2017). [DOI] [PMC free article] [PubMed] [Google Scholar]
- 18.Mabuchi S et al. Pretreatment tumor-related leukocytosis misleads positron emission tomography-computed tomography during lymph node staging in gynecological malignancies. Nat Commun 11, 1364, doi: 10.1038/s41467-020-15186-z (2020). [DOI] [PMC free article] [PubMed] [Google Scholar]
- 19.Saxton RA & Sabatini DM mTOR Signaling in Growth, Metabolism, and Disease. Cell 168, 960–976, doi: 10.1016/j.cell.2017.02.004 (2017). [DOI] [PMC free article] [PubMed] [Google Scholar]
- 20.Yoshida GJ Beyond the Warburg Effect: N-Myc Contributes to Metabolic Reprogramming in Cancer Cells. Front Oncol 10, 791, doi: 10.3389/fonc.2020.00791 (2020). [DOI] [PMC free article] [PubMed] [Google Scholar]
- 21.Zhou R et al. [(18)F](2S,4R)4-Fluoroglutamine PET Detects Glutamine Pool Size Changes in Triple-Negative Breast Cancer in Response to Glutaminase Inhibition. Cancer Res 77, 1476–1484, doi: 10.1158/0008-5472.CAN-16-1945 (2017). [DOI] [PMC free article] [PubMed] [Google Scholar]
- 22.Schulte ML et al. Pharmacological blockade of ASCT2-dependent glutamine transport leads to antitumor efficacy in preclinical models. Nat Med 24, 194–202, doi: 10.1038/nm.4464 (2018). [DOI] [PMC free article] [PubMed] [Google Scholar]
- 23.Kilgour MK et al. 1-Methylnicotinamide is an immune regulatory metabolite in human ovarian cancer. Sci Adv 7, doi: 10.1126/sciadv.abe1174 (2021). [DOI] [PMC free article] [PubMed] [Google Scholar]
- 24.Cascone T et al. Increased Tumor Glycolysis Characterizes Immune Resistance to Adoptive T Cell Therapy. Cell Metab 27, 977–987 e974, doi: 10.1016/j.cmet.2018.02.024 (2018). [DOI] [PMC free article] [PubMed] [Google Scholar]
- 25.Li W et al. Aerobic Glycolysis Controls Myeloid-Derived Suppressor Cells and Tumor Immunity via a Specific CEBPB Isoform in Triple-Negative Breast Cancer. Cell Metab 28, 87–103 e106, doi: 10.1016/j.cmet.2018.04.022 (2018). [DOI] [PMC free article] [PubMed] [Google Scholar]
- 26.Chafe SC et al. Targeting Hypoxia-Induced Carbonic Anhydrase IX Enhances Immune-Checkpoint Blockade Locally and Systemically. Cancer Immunol Res 7, 1064–1078, doi: 10.1158/2326-6066.CIR-18-0657 (2019). [DOI] [PubMed] [Google Scholar]
- 27.Wenes M et al. Macrophage Metabolism Controls Tumor Blood Vessel Morphogenesis and Metastasis. Cell Metab 24, 701–715, doi: 10.1016/j.cmet.2016.09.008 (2016). [DOI] [PubMed] [Google Scholar]
- 28.Jeong H et al. Tumor-Associated Macrophages Enhance Tumor Hypoxia and Aerobic Glycolysis. Cancer Res 79, 795–806, doi: 10.1158/0008-5472.CAN-18-2545 (2019). [DOI] [PubMed] [Google Scholar]
- 29.Sullivan MR et al. Quantification of microenvironmental metabolites in murine cancers reveals determinants of tumor nutrient availability. Elife 8, e44235 (2019). [DOI] [PMC free article] [PubMed] [Google Scholar]
- 30.O’Neil RT et al. Transposon-modified antigen-specific T lymphocytes for sustained therapeutic protein delivery in vivo. Nat. Commun 9, 1325 (2018). [DOI] [PMC free article] [PubMed] [Google Scholar]
- 31.Tracz A Mastri M Lee CR Pili R & Ebos JML Modeling spontaneous metastatic renal cell carcinoma (mRCC) in mice following nephrectomy. J. Vis. Exp 86, 51485 (2014). [DOI] [PMC free article] [PubMed] [Google Scholar]
- 32.Parang B, Barrett CW & Williams CS AOM/DSS model of colitis-associated cancer. Methods Mol. Biol 1422, 297–307 (2016). [DOI] [PMC free article] [PubMed] [Google Scholar]
- 33.Becker C et al. In vivo imaging of colitis and colon cancer development in mice using high resolution chromoendoscopy. Gut 54, 950–954 (2005). [DOI] [PMC free article] [PubMed] [Google Scholar]
- 34.Hassanein M et al. Preclinical Evaluation of 4-[18F] Fluoroglutamine PET to Assess ASCT2 Expression in Lung Cancer. Mol. Imaging Biol 18, 18–23 (2016). [DOI] [PMC free article] [PubMed] [Google Scholar]
- 35.Canouil M, et al. NACHO: an R package for quality control of NanoString nCounter data. Bioinformatics 36, 970–971 (2020). [DOI] [PMC free article] [PubMed] [Google Scholar]
- 36.Lê S Josse, J. Husson, & F. FactoMineR: A Package for Multivariate Analysis. Journal of Statistical Software 25, 1–18 (2008). [Google Scholar]
- 37.Raudvere U et al. g:Profiler: a web server for functional enrichment analysis and conversions of gene lists (2019 update). Nucleic Acids Research 47, W191–W198 (2019). [DOI] [PMC free article] [PubMed] [Google Scholar]
- 38.Robinson MD McCarthy DJ & Smyth GK edgeR: a Bioconductor package for differential expression analysis of digital gene expression data. Bioinformatics 26,139–140 (2010). [DOI] [PMC free article] [PubMed] [Google Scholar]
Associated Data
This section collects any data citations, data availability statements, or supplementary materials included in this article.