Abstract
MHC-I presents tumor antigens to CD8+ T cells and triggers anti-tumor immunity. Humans may have 30,000-60,000 long noncoding RNAs (lncRNAs). However, it remains poorly understood whether lncRNAs may affect tumor immunity. Here, we identify a LncRNA, capable of Inducing MHC-I and Immunogenicity of Tumor (LIMIT) in humans and mice. We found IFNγ stimulated LIMIT, LIMIT cis-activated guanylate binding protein (GBP) gene cluster, and GBPs disrupted the association between HSP90 and heat shock factor-1 (HSF1) - thereby resulting in HSF1 activation and transcription of MHC-I machinery, but not PD-L1. RNA-guided CRISPR activation of LIMIT boosted GBPs and MHC-I, and potentiated tumor immunogenicity and checkpoint therapy. Silencing LIMIT, GBPs, and/or HSF1 diminished MHC-I, impaired antitumor immunity, and blunted immunotherapy efficacy. Clinically, LIMIT, GBPs- and HSF1-signaling transcripts and proteins correlated with MHC-I, tumor infiltrating T cells, and checkpoint blockade response in cancer patients. Altogether, we demonstrate LIMIT is a previously unknown cancer immunogenic lncRNA and the LIMIT-GBP-HSF1 axis may be targetable for cancer immunotherapy.
Keywords: Long noncoding RNA, LIMIT, MHC-I, IFNγ, GBP, HSF1, HSP90, PD-L1, PD-1, T cell immunity, cancer immunotherapy
Introduction
Checkpoint blockade unleashes CD8+ T cell-mediated immune power against cancer1. Major histocompatibility complex-I (MHC-I) plays a key role in CD8+ T cell priming and activation2. However, MHC-I is frequently downregulated in cancer cells, resulting in tumor immune evasion and immunotherapy resistance3,4. It is important to understand how to recover tumor MHC-I expression and revitalize antitumor immune response5.
LncRNAs are emerging rapidly along with the advance in deep RNA sequencing, covering much more loci in human genome than protein-coding genes6. LncRNAs regulate protein-coding genes at multiple levels7-9 and play pivotal roles in genomic imprinting10, cell differentiation11, and cancer progression12. However, the identity, mode of action, function, and clinical relevance of specific lncRNAs in cancer immunity and immunotherapy remain unknown.
Here, we identify LIMIT as a previously unknown, cancer immunogenic lncRNA. LIMIT affects MHC-I machinery and antitumor immunity. We have found that LIMIT locally targets GBPs, thereby forming a molecular cascade of LIMIT-GBP-HSF1-MHC to alter antitumor immunity and tumor immunotherapy efficacy. Our work not only reveals previously unknown biology of an immunogenic lncRNA, LIMIT, but also suggests that the LIMIT-GBP-HSF1 axis may be targetable for cancer immunotherapy.
LIMIT is an immunogenic lncRNA
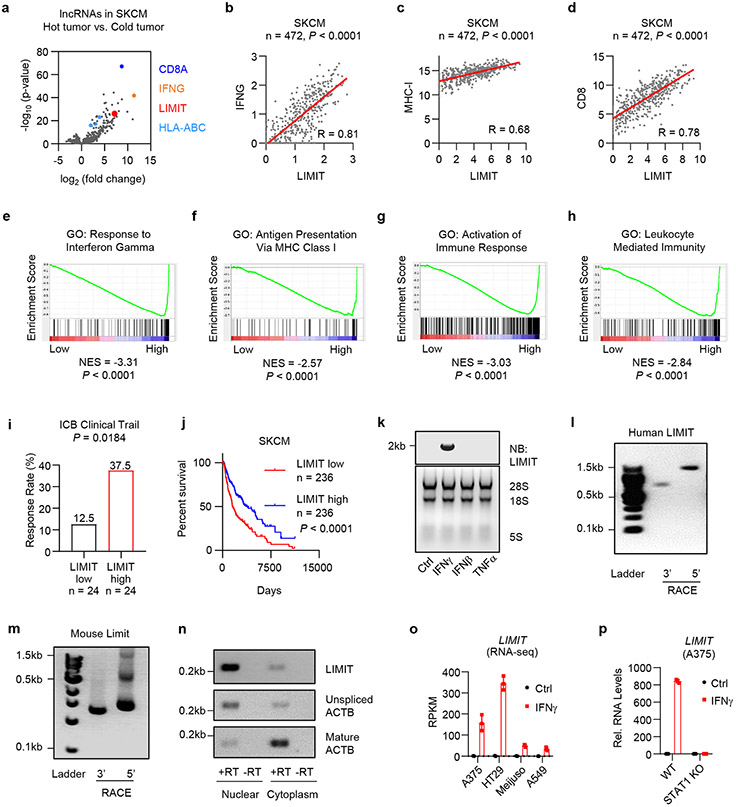
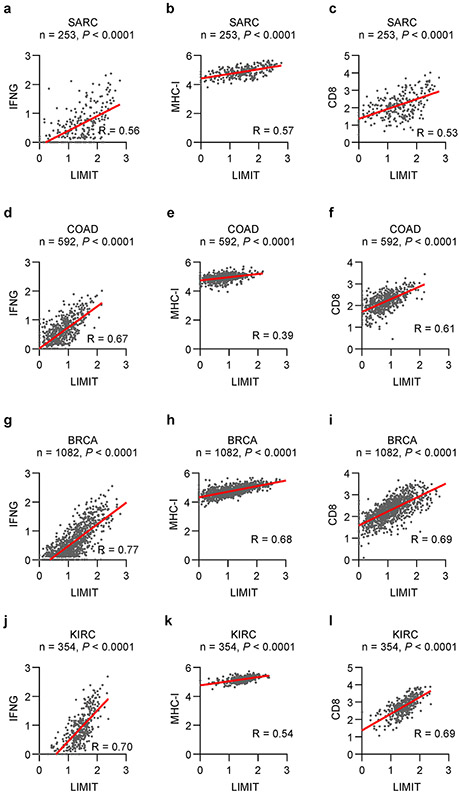
To explore unknown regulatory genes in tumor immunity, based on tumor CD8+ T cell infiltration, we divided human melanoma (TCGA, SKCM) into hot and cold tumor types and analyzed immunogenic gene correlations. In addition to CD8A, IFNγ, and MHC-I (HLA-ABC) transcripts, we found that a lncRNA candidate was enriched in hot tumor, among 3926 lncRNA candidates annotated by GENCODE13 (Fig. 1a; Supplementary Table 1). Based on functional studies in the following experiments, we designated this lncRNA candidate as LIMIT: LncRNA Inducing MHC-I and Immunogenicity of Tumor (LIMIT). In human melanoma dataset, the levels of LIMIT positively correlated with that of IFNγ, MHC-I, and CD8 (Fig. 1b-d). In line with this, Gene Set Enrichment Analysis (GSEA) revealed that LIMIT expression correlated with IFNγ response genes, antigen presentation via MHC-I, and immune activation (Fig. 1e-h). Moreover, the levels of LIMIT correlated with enhanced checkpoint immunotherapy response rates 14-17 (Fig. 1i) and were associated with survival in patients with melanoma (Fig. 1j). Additionally, the expression of LIMIT correlated with IFNγ, MHC-I, and CD8 across multiple cancer types (Extended Data Fig. 1a-l). Thus, LIMIT is a potential immunogenic lncRNA.
Fig. 1: LIMIT is an immunogenic lncRNA.
a. Human melanoma samples (TCGA data set, SKCM, n = 472 patients) were divided into hot and cold tumors on the basis of CD8A transcripts. The volcano plots showed the fold change and p-value of 3926 lncRNA candidates in hot tumor (CD8A, top 10%) vs. cold tumor (CD8A, bottom 10%). P value by 2-sided t-test.
b-d. Correlation of LIMIT with IFNG (b), MHC-I (c), or CD8 (d) in human melanoma patients (TCGA, SKCM). P value by 2-sided linear regression.
e-h. Human melanoma samples (TCGA, SKCM) were divided into high (n = 236 patients) and low (n = 236 patients) LIMIT tumors. Gene set enrichment analysis showed the indicated gene signatures. P value by GSEA analysis.
i. Cancer patients having received immune checkpoint blockade (ICB) therapy were divided into low and high LIMIT groups (bottom 15% vs top 15%). The response rates to ICB were calculated as the percentages of partial response (PR) plus complete response (CR). P value by Chi-square test. Patients were from 4 cohorts.
j. Survival plot of melanoma patients (TCGA, SKCM). Patients were divided into high (n = 236 patients) and low (n = 236 patients) LIMIT groups. P value by 2-sided log-rank test.
k. A375 cells were treated with indicated cytokines (5 ng/ml) for 24 hours. LIMIT was detected by Northern blotting. The 28S rRNA, 18S rRNA, and 5S rRNA are shown as loading controls.1 of 2 experiments is shown.
l-m. 5’RACE and 3’RACE of human LIMIT (l) or murine Limit (m). 1 of 2 experiments is shown.
n. A375 cells were treated with IFNγ for 24 hours. LIMIT was detected by RT-PCR in nuclear or cytoplasmic RNAs. The unspliced and mature ACTB were served as controls for nuclear and cytoplasmic RNAs, respectively. 1 of 2 experiments is shown.
o. RPKM of LIMIT in different cancer cells in response to IFNγ.
p. Wild type (WT) or STAT1 knockout (KO) A375 cells were treated with 5 ng/ml IFNγ for 24 hours. RNA levels of LIMIT were quantified by qRT-PCR.
All Data are mean ± SD.
n = 3 biological independent samples in (o, p).
Source data are provided in Soure_data_Fig1.xlsx and Unmodified_blots_Fig1.pdf.
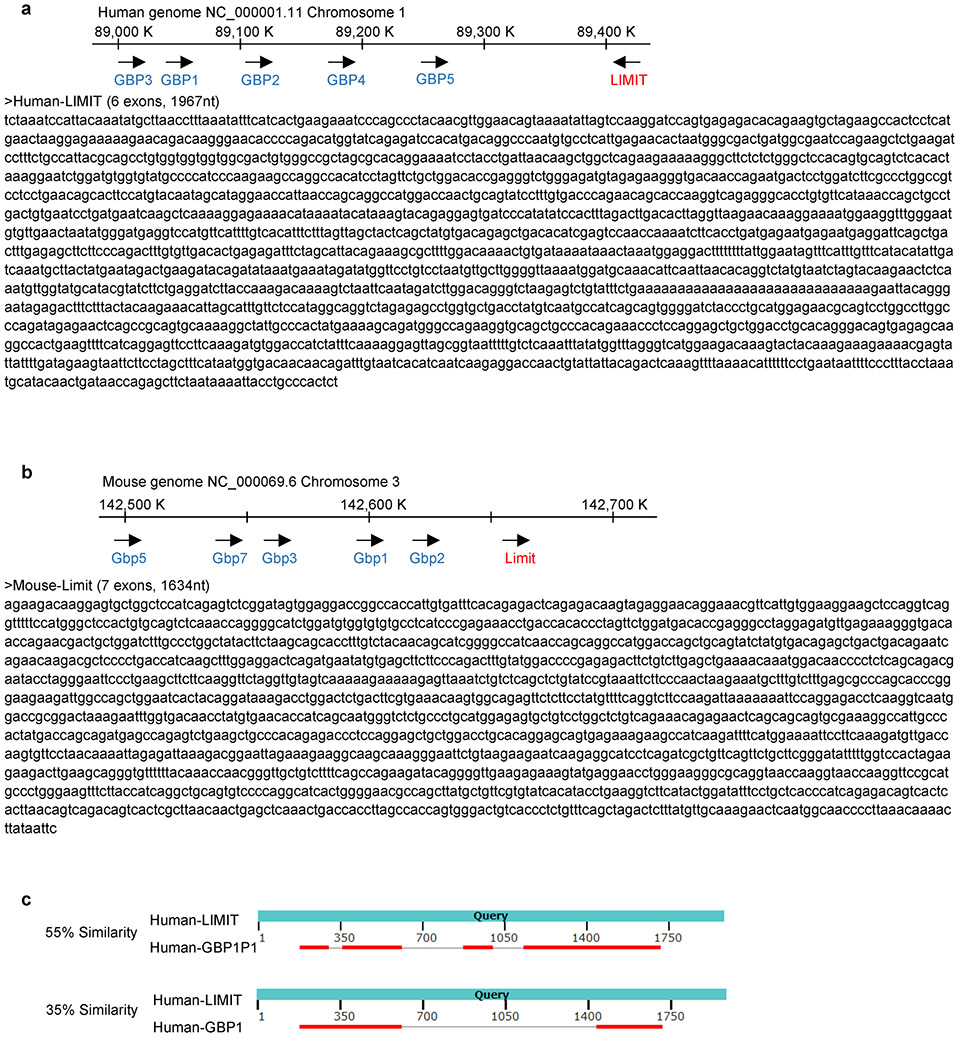
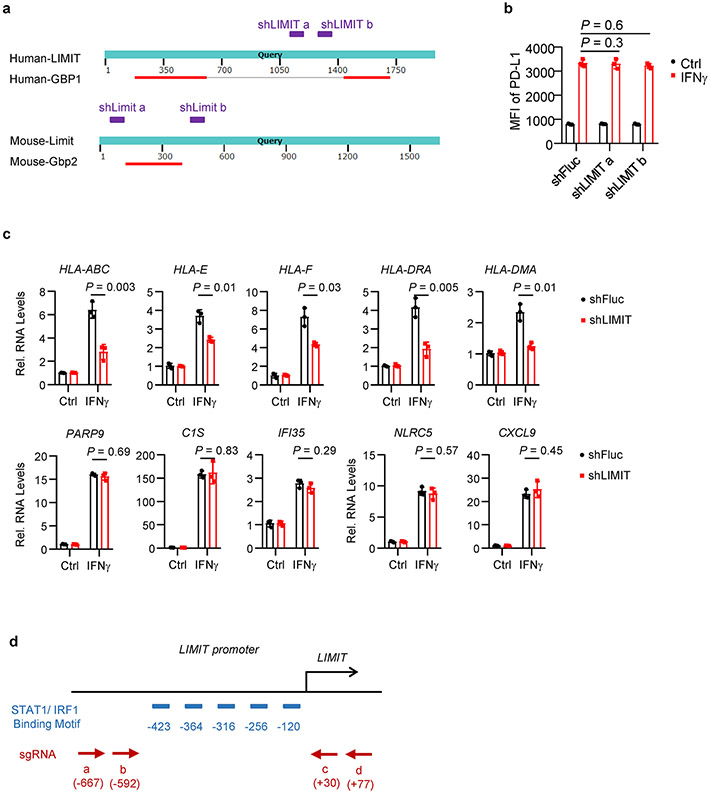
We validated if LIMIT is a lncRNA. Northern blotting showed that LIMIT was approximately 2 kb in length in human A375 melanoma cells (Fig. 1k). We applied rapid amplification of cDNA ends (RACE) and characterized the cDNA ends of LIMIT in both human (A375) and mouse (B16) melanoma cells (Fig. 1l, m). Next, we cloned the full-length of LIMIT in both human and mouse, and aligned with corresponding genome sequences (Extended Data Fig. 2a, b). Human LIMIT was located in chromosome 1, with 1967 nucleotides and 6 exons (Extended Data Fig. 2a), while the mouse Limit was located in chromosome 3, with 1634 nucleotides and 7 exons (Extended Data Fig. 2b). LIMIT did not contain a valid Kozak sequence. When we prepared RNA from nuclear and cytoplasmic fractions of A375 cells, LIMIT was mainly detected in the nuclear fraction (Fig. 1n). Thus, LIMIT has no protein-coding potential. Collectively, LIMIT meets all criteria to be defined as a lncRNA. Notably, in the LIMIT locus, a lncRNA candidate, pseudogene of GBP1 (GBP1P1) was found in hepatocellular carcinoma (HCC)18. However, LIMIT exhibited low similarities with GBP1P1 or GBP1 (Extended Data Fig. 2c, Supplementary Table 2). Thus, LIMIT is not GBP1P1.
High correlation between LIMIT and IFNγ responsive gene signature (Fig. 1e) suggests that IFNγ may stimulate LIMIT expression. Indeed, treatment with IFNγ induced the expression of LIMIT, as shown by Northern blotting (Fig. 1k) and RNA-seq in A375, HT29, Meijuso, and A549 cells (Fig. 1o). However, treatment with other cytokines, such as IFNβ and TNFα, failed to induce LIMIT expression (Fig. 1k). Moreover, IFNγ failed to induce LIMIT in STAT1 knockout (KO) A375 cells (Fig. 1p). Hence, LIMIT is a previously unknown IFNγ-responsive lncRNA in both human and mouse cells.
LIMIT augments MHC-I expression
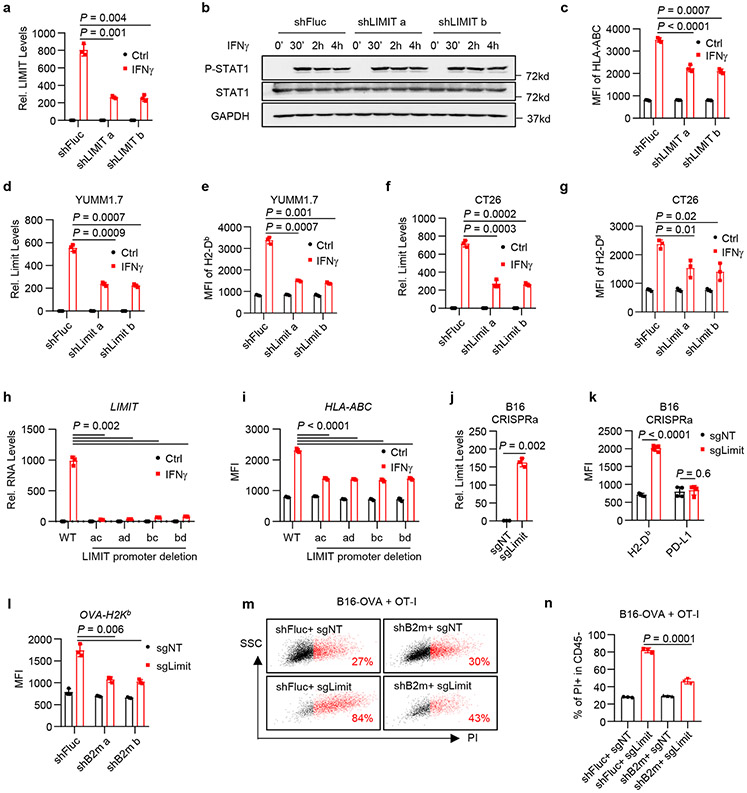
To study the function of LIMIT in tumor cells, we first knocked down LIMIT with small hairpin RNAs (shLIMIT). We employed Blast tool to select LIMIT shRNAs that have no off-target candidates (Supplementary Tables 3-6). ShLIMIT did not target GBP coding genes (Extended Data Fig. 3a). In A375 cells, shLIMIT suppressed LIMIT expression (Fig. 2a), but had no effect on the phosphorylation of STAT1 (Fig. 2b) in response to IFNγ - suggesting that LIMIT did not affect the global IFNγ gene signaling. MHC-I and PD-L1 are IFNγ target genes19-21. ShLIMIT led to a decrease in the expression of MHC-I (Fig. 2c), but not PD-L1 (Extended Data Fig. 3b), in response to IFNγ stimulation. In line with this human data, silencing Limit in murine melanoma cell YUMM1.7 or colon cancer cell CT26 resulted in reduced MHC-I expression in response to IFNγ (Fig. 2d-g). In A375 cells, shLIMIT affected not only MHC-I expression (HLA-ABC, HLA-E, and HLA-F), but also MHC-II expression (HLA-DRA and HLA-DMA); whereas LIMIT did not alter other IFNγ signaling gene expression (Extended Data Fig. 3c). Thus, LIMIT participates in the regulation of IFNγ-induced MHC-I and MHC-II expression without altering global IFNγ signaling pathway.
Fig. 2: LIMIT augments MHC-I expression.
a. A375 shFluc or shLIMIT cells were treated with IFNγ for 24 hours. RNA levels of LIMIT were determined by qRT-PCR. P value by 2-sided t-test.
b. A375 shFluc or shLIMIT cells were treated with IFNγ for the indicated time. Protein levels of phospho-STAT1 (p-Y701), STAT1, and GAPDH were determined by Western blotting. 1 of 2 experiments is shown.
c. A375 shFluc or shLIMIT cells were treated with IFNγ for 48 hours. Surface expression of HLA-ABC were determined by flow cytometry (FACS). P value by 2-sided t-test.
d-g. YUMM1.7 (d, e) or CT26 (f, g) cells carrying shFluc or shLimit were treated with IFNγ. RNA levels of Limit were determined 24 hours after treatment (d, f). Surface staining of MHC-I (H2-Db) was detected 48 hours after treatment (e, g). P value by 2-sided t-test.
h-i. A375 WT or LIMIT promoter deletion cells were treated with IFNγ. RNA levels of LIMIT were determined 24 hours after treatment (h). Surface expression of HLA-ABC were determined 48 hours after treatment (i). P value by 2-sided t-test.
j-k. B16 cells were transfected with dCas9-VPR, together with non-targeting sgRNA (sgNT) or sgRNA targeting the promoter of Limit (sgLimit). RNA levels of Limit were determined 24 hours after treatment (j). Surface expression of MHC-I (H2-Db) or PD-L1 were determined 48 hours after treatment (k). P value by 2-sided t-test.
l. B16-OVA cells carrying shFluc or shB2m were manipulated with Limit CRISPRa (sgLimit) for 48 hours. Surface expression of OVA-H2Kb were determined by FACS. P value by 2-sided t-test.
m-n. B16-OVA cells were manipulated with B2m knocking down (shB2m) or Limit CRISPRa (sgLimit), and co-cultured with OT-I cell at the ratio of 1:4. Cell death was measured by PI staining in CD45− tumor cells. Dot plots (m) and statistical results (n) are shown. P value by 2-sided t-test.
All data are mean ± SD.
n = 3 biological independent samples in (a, c, d, e, f, g, h, i, j, k, l, n).
Source data are provided in Soure_data_Fig2.xlsx and Unmodified_blots_Fig2.pdf.
LIMIT is an interrupted gene with large introns, occupying around 17 kb in the genome. We failed to knock out LIMIT locus with paired sgRNAs and Cas9. Given that there are 5 predicted STAT1/IRF1 binding sites in the LIMIT promoter, we designed 4 paired sgRNAs to delete these binding sites in the LIMIT promoter (Extended Data Fig. 3d). We generated A375 cells with the LIMIT promoter deletion in all 4 combinations of sgRNAs. We found IFNγ was no longer efficient to induce the expression of LIMIT and MHC-I in tumor cells with LIMIT promoter deletion when compared to wild type cells (Fig. 2h, i).
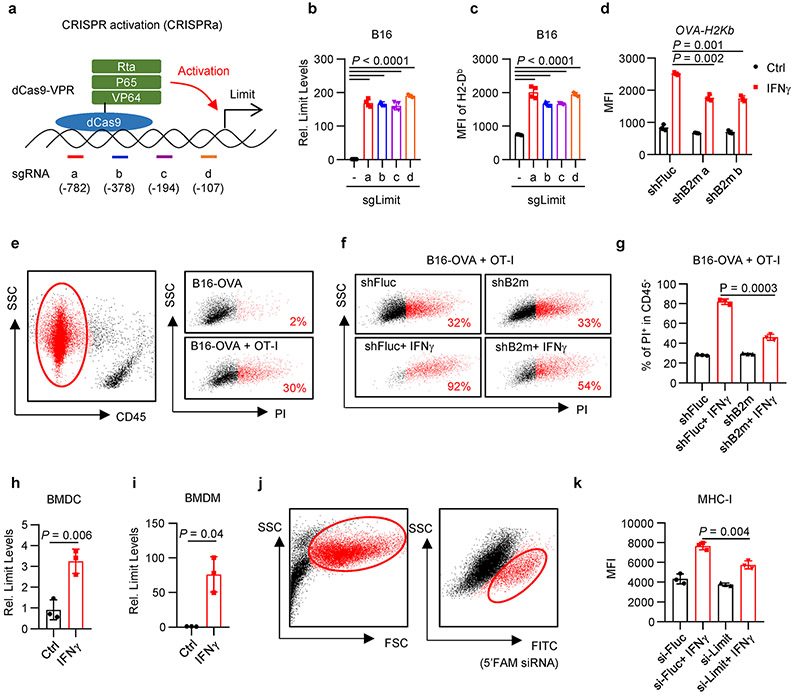
We additionally employed an RNA-guided CRISPR activation system to activate Limit expression in tumor cells22. We established 4 guide RNAs targeting the promoter region of Limit (sgLimit), and co-expressed with dCas9-VPR, a tripartite transcriptional activator fused with nuclease-null Cas9, into B16 cells (Extended Data Fig. 4a). All 4 sgLimit enhanced the expression of Limit, as well as MHC-I (Extended Data Fig. 4b, c). When we transfected B16 cells with pooled sgLimit and non-targeting sgRNAs (sgNT), sgLimit induced the expression of Limit and MHC-I, but not PD-L1 (Fig. 2j, k). Hence, Limit selectively targets MHC-I, but not PD-L1. Altogether, the loss- and gain-of function experiments demonstrate that LIMIT can alter 1.5-3 fold-MHC-I expression in multiple cancer cells across mouse and human.
We next investigated whether LIMIT-altered MHC-I expression impacts TAA-specific CD8+ T cell-mediated tumor killing in vitro. To this end, we first genetically knocked down B2M with specific shRNAs in ovalbumin (OVA)-expressing B16 cells. shRNA-B2M resulted in 1.5-fold reduction in OVA-H2Kb expression (Extended Data Fig. 4d). When B16-OVA cells carrying shFluc and shB2M were incubated with OT-I cells, we observed a decrease in OT-I-mediated shB2M-B16-OVA cell killing when compared to shFluc-B16-OVA cells (Extended Data Fig. 4e-g). The data suggest that 1.5-3-fold changes in MHC-I expression controlled by LIMIT could be functionally relevant in affecting TAA-specific CTL activities. To validate this, we activated LIMIT in B16-OVA cells expressing shFluc and shB2M. As expected, CRISPR activation of LIMIT induced minimal MHC-I expression in shB2M cells, as compared to control cells (Fig. 2l). Accordingly, OT-I cells mediated minimal tumor killing in shB2M-OVA-B16 cells when compared to control cells (Fig. 2m, n). The data suggest that LIMIT-induced MHC-I expression is important in TAA-specific T cell activation and function.
Antigen presenting cells (APCs), including macrophages and dendritic cells (DCs), express MHC-I, present antigens to, and activate TAA-specific T cells. We extended our studies from tumor cells to APCs. IFNγ potently stimulated Limit expression in bone marrow derived DCs and macrophages (Extended Data Fig. 4h, i). We transfected macrophages with 5’FAM-labeled siRNA targeting Limit (siLIMIT). Knocking down LIMIT resulted in lower MHC-I expression in response to IFNγ stimulation, as compared to control (Extended Data Fig. 4j, k). Thus, LIMIT is an IFNγ responsive lncRNA and can promote MHC-I expression in both tumor cells and APCs.
LIMIT enhances anti-tumor immunity
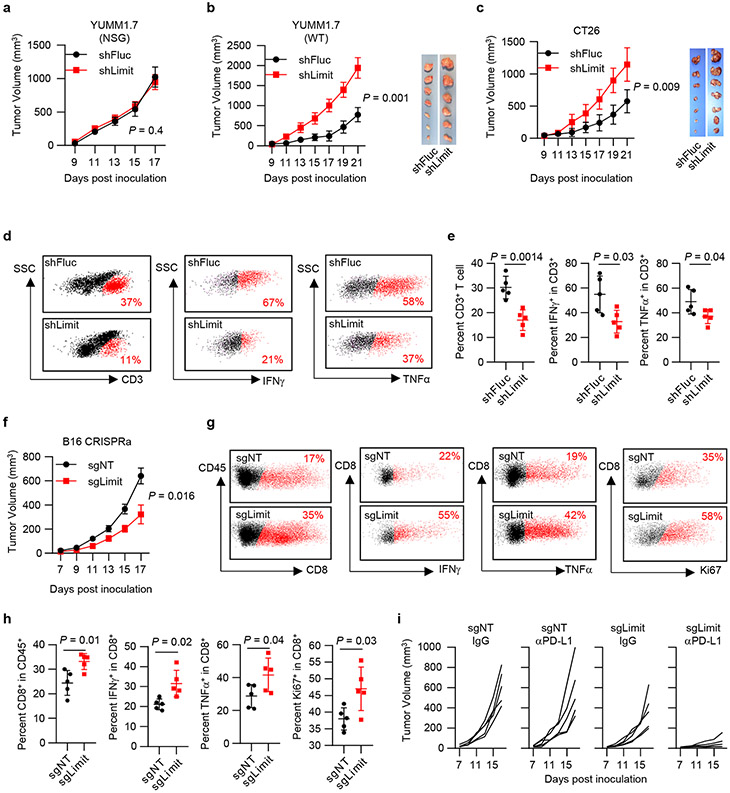
Insufficient MHC-I expression confers tumor immune evasion and immunotherapy resistance3. To understand a role of Limit in antitumor immune responses in vivo, we inoculated control (shFluc) and Limit-silencing (shLimit) YUMM1.7 tumor cells into NOD scid γc-deficient (NSG, immune deficient) and wild type C57BL/6 (immune competent) mice. Compared with control tumors, shLimit YUMM1.7 tumors grew comparably in NSG mice (Fig. 3a), whereas progressed faster in wild type mice (Fig. 3b). In addition, we inoculated shLimit CT26 tumors into wild type BALB/c mice. Again, silencing Limit resulted in enhanced CT26 tumor growth in the immune competent model (Fig. 3c). The data suggest that silencing Limit may impair anti-tumor immunity and facilitate tumor growth in an immune-dependent manner. In support of this, we detected a reduction of CD3+, IFNγ+, and TNFα+ T cells in the shLimit YUMM1.7 tumors (Fig. 3d, e). Together, silencing Limit impairs anti-tumor immunity.
Fig. 3: LIMIT enhances anti-tumor immunity.
a. Tumor growth curve of YUMM1.7 shFluc or YUMM1.7 shLimit cells in NSG mice. n = 5 animals, P value by 2-sided t-test for tumor volume at end point.
b. Tumor growth curve and tumor size of YUMM1.7 shFluc or YUMM1.7 shLimit cells inoculated in wild type C57BL/6 mice. n = 6 (shFluc) or 7 (shLimit) animals, P value by 2-sided t-test for tumor volume at end point.
c. Tumor growth curve of CT26 shFluc or CT26 shLimit cells in wild type BALB/c mice. n = 7 animals, P value by 2-sided t-test for tumor volume at end point.
d. Dot plots of intratumoral CD3+ T cells, IFNγ+ T cells, and TNFα+ T cells in YUMM1.7 shFluc or YUMM1.7 shLimit tumors.
e. The percentages of intra-tumoral CD3+ T cells (of CD45+), IFNγ+ T cells, and TNFα+ T cells in YUMM1.7 shFluc or YUMM1.7 shLimit tumors. P value by 2-sided t-test.
f. Tumor growth curve of B16 sgNT or B16 sgLimit (CRISPRa) cells in wild type C57BL/6 mice. n = 5 animals. P value by 2-sided t-test.
g. Dot plots of intral-tumoral T cell population and activation in B16 sgNT or B16 sgLimit tumors.
h. Intral-tumoral T cell population or activation in B16 sgNT or B16 sgLimit tumors. P value by 2-sided t-test.
i. Tumor growth curve of B16 sgNT cells and B16 sgLimit cells in response to IgG or anti-PD-L1 antibody. n = 5 animals.
All data are mean ± SD.
n = 5 biological independent samples in (e, h).
Source data are provided in Soure_data_Fig3.xlsx.
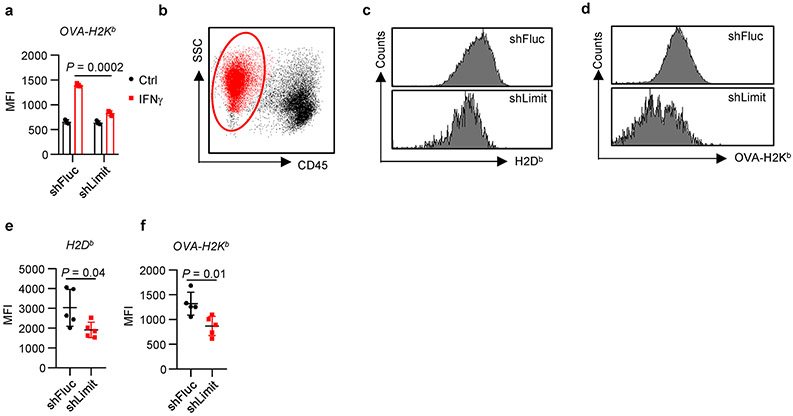
To determine the expression of MHC-I and MHC-I: SIINFEKL in vivo, we established YUMM1.7 cells stably expressing OVA (YUMM1.7-OVA), and transduced with shRNA targeting Limit or Fluc. After IFNγ treatment, we detected reduced surface expression of OVA-H2Kb in shLimit-YUMM1.7 cells (Extended Data Fig. 5a). We inoculated shLimit-YUMM1.7-OVA cells and shFluc-YUMM1.7-OVA cells into C57BL/6 mice. Then, we dissected tumor tissues and detected expression of H2Db and OVA-H2Kb in tumor cells. We observed a reduction of H2Db and OVA-H2Kb in shLimit-YUMM1.7-OVA cells when compared with control cells (Extended Data Fig. 5b-f). The data indicate that Limit may affect MHC-I and MHC-I: antigen expression in vivo.
We additionally inoculated control (sgNT) and Limit-activating (sgLimit) B16 cells into wild type C57/BL6 mice. As expected, sgLimit (Limit activation) dramatically reduced tumor growth (Fig. 3f). This was accompanied with increased tumor infiltrating T cell numbers and activation (Fig. 3g, h). B16 melanoma is a relatively insensitive tumor model to PD-L1 blockade23. Consistent with this, PD-L1 blockade failed to control sgNT B16 tumor growth in mice. Interestingly, Limit activation in B16 tumor with sgLimit sensitized tumor response to PD-L1 blockade, as shown by reduced tumor progression (Fig. 3i). Altogether, Limit potentiates tumor immunity and sensitizes tumor immunotherapy response.
LIMIT cis-activates GBPs to boost MHC-I and tumor immunity
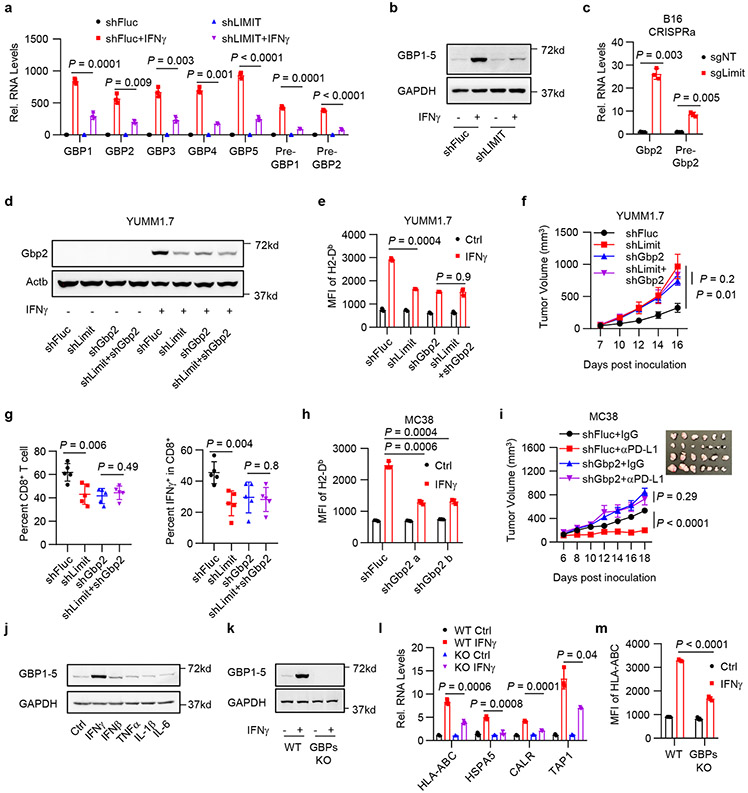
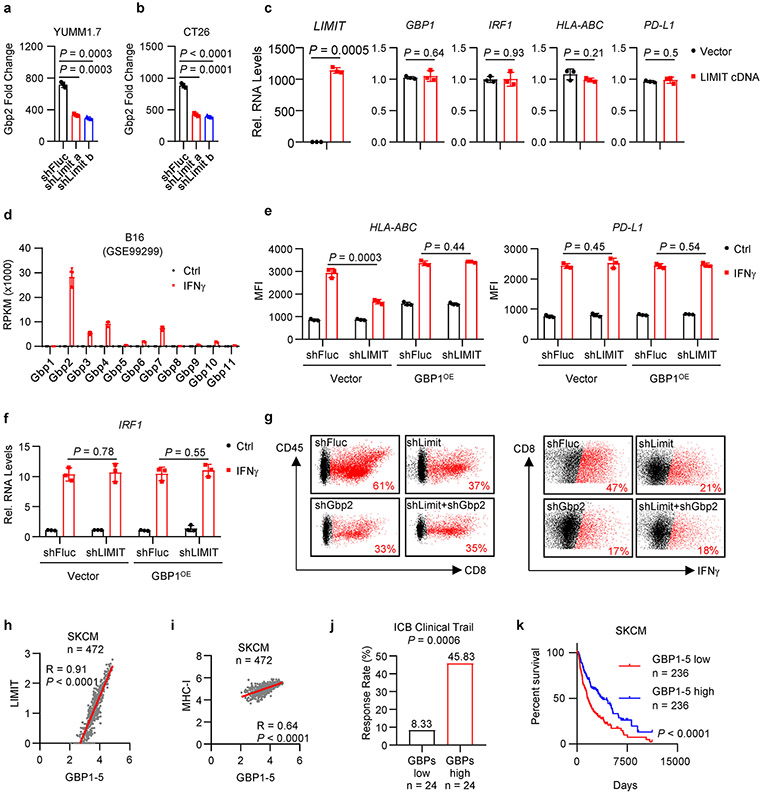
We next explored how LIMIT affects MHC-I and tumor immunity. LncRNAs can locally regulate expression of neighboring genes24. LIMIT is localized closely to a gene cluster, guanylate binding proteins (GBPs), in both human and mouse genomes (Extended Data Fig. 2a, b). We asked whether LIMIT might regulate the expression of GBPs. Silencing LIMIT reduced the levels of precursor and mature GBP mRNAs (Fig. 4a), and GBP1-5 proteins (Fig. 4b) in human A375 cells in response to IFNγ treatment. The data suggest that LIMIT may promote the transcription of GBPs in cis. In support of this possibility, silencing Limit also diminished Gbp2 expression in mouse YUMM1.7 and CT26 cells (Extended Data Fig. 6a, b). Furthermore, CRISPR activation of Limit induced the expression of Gbp2 in B16 cells (Fig. 4c). To test whether LIMIT could trans-regulate GBPs, we forced expression of LIMIT cDNA into A375 cells. We found GBP1 and multiple immune factors (including IRF1, HLA-ABC, and PD-L1) were unaltered by LIMIT overexpression (Extended Data Fig. 6c). Thus, LIMIT is a cis-acting lncRNA capable of inducing GBP expression.
Fig. 4: LIMIT cis-activates GBPs to boost MHC-I and tumor immunity.
a. A375 shFluc or shLIMIT cells were treated with IFNγ for 24 hours. RNA (a) or protein (b) levels of GBPs were determined. P value by 2-sided t-test. 1 of 3 blots is shown.
c. B16 cells were manipulated with Limit CRISPRa for 24 hours. Gbp2 precursor and mature RNAs were determined. P value by 2-sided t-test.
d-e. YUMM1.7 shFluc, shLimit, shGbp2 or shLimit+shGbp2 cells were treated with IFNγ. Gbp2 protein was detected 24 hours after treatment (d). Surface expression of MHC-I (H2-Db) was measured 48 hours after treatment (e). 1 of 2 blots is shown. P value by 2-sided t-test.
f. Tumor growth curves of YUMM1.7 shFluc, shLimit, shGbp2, or shLimit+shGbp2 cells inoculated in C57BL/6 mice. n = 5 animals, P value by 2-sided t-test for tumor volume at end point.
g. Percentages of intral-tumoral CD8+ T cells or IFNγ+CD8+ T cells in YUMM1.7 tumors carrying shFluc, shLimit, shGbp2, or shLimit+shGbp2. n = 5 animals, P value by 2-sided t-test.
h. MC38 shFluc or shGbp2 cells were treated with IFNγ . Surface staining of H2-Db were determined 48 hours after treatment. P value by 2-sided t-test.
i. Tumor growth curves of MC38 shFluc and MC38 shGbp2 cells. Tumor bearing mice were treated with IgG or anti-PD-L1 antibody. n = 6 (shFluc) or 7 (shGbp2) animals, P value by t-test for end point tumor volume.
j. A375 cells were treated with indicated cytokines for 24 hours. Protein levels of GBP1-5 were determined. 1 of 2 experiments is shown.
k-m. A375 WT or GBP1-5 KO cells were treated with IFNγ. GBP1-5 protein (k) and MHC-I-related gene transcripts (l) were determined 24 hours after treatment. MHC-I surface expression (m) were determined 48 hours after treatment. 1 of 3 blots is shown. P value by 2-sided t-test.
All data are mean ± SD.
n = 3 biological independent samples in (a, c, e, h, l, m).
Source data are provided in Soure_data_Fig4.xlsx and Unmodified_blots_Fig4.pdf.
Among Gbp family members, Gbp2 is a predominant Gbp family member in mouse cells (Extended Data Fig. 6d). To test whether LIMIT may regulate MHC-I via GBPs, we established stable YUMM1.7 cells carrying shFluc, shLimit, shGbp2, or shLimit plus shGbp2. We found that in response to IFNγ stimulation, shLimit and shGbp2 led to a comparable decrease in Gbp2 and MHC-I expression; simultaneously silencing Limit and Gbp2 failed to additionally alter Gbp2 and MHC-I expression (Fig. 4d, e). Moreover, we wondered whether GBP overexpression may rescue MHC-I downregulated-MHC-I expression in Limit knocking down tumor cells. We forced expression of GBP1 in shLIMIT A375 cells (GBP1OE) and treated these cells with IFNγ. We observed that shLIMIT resulted in reduced MHC-I expression in control cells, but not in GBP1OE cells (Extended Data Fig. 6e). Expression of PD-L1 and IRF1 was not affected by shLIMIT or GBP1OE (Extended Data Fig. 6e, f). Hence, Limit may regulate MHC-I expression in a GBP-dependent manner. We next inoculated YUMM1.7 cells with Limit and/or Gbp2-silencing into C57BL/6 mice. Silencing Limit and silencing GBPs similarly resulted in faster tumor growth compared to control group, whereas simultaneously silencing LIMIT and GBPs did not further affect tumor progression (Fig. 4f). Furthermore, we detected a decrease in tumor infiltrating T cell numbers and activation in shLimit tumors, shGbp2 tumors, and shLimit plus shGbp2 tumors (Fig. 4g and Extended Data Fig. 6g). Together, LIMIT augments MHC-I expression and tumor immunity in a GBP-dependent manner.
GBPs are IFNγ-responsive genes in fibroblasts25 and macrophages26 in the context of host defense against pathogens. However, a role of GBPs in cancer immunity is unknown. Given that silencing GBPs reduced MHC-I expression and CD8+ T cell activation (Fig. 4g and Extended Data Fig. 6g), we hypothesized that GBPs might affect cancer immunotherapy efficacy. To test this hypothesis, we silenced Gbp2 in MC38 cells, a tumor model sensitive to immunotherapy23. As expected, silencing Gbp2 in MC38 cells reduced MHC-I expression upon IFNγ treatment (Fig. 4h), and largely abrogated the efficacy of PD-L1 blockade (Fig. 4i). This, along with the aforementioned data, suggest an involvement of LIMIT and GBPs in controlling cancer immunotherapy efficacy. In support of this possibility, clinical data analysis revealed that high levels of GBP expression correlated with LIMIT, MHC-I expression, and immunotherapy response (Extended Data Fig. 6h-j) in patients with melanoma14-17. Furthermore, levels of GBP expression were positively associated with patient survival (Extended Data Fig. 6k). To validate if GBPs are IFNγ-responsive genes in cancer cells, we stimulated A375 cells with IFNγ and other cytokines. GBPs were induced by IFNγ, but minimally affected by other immune cytokines (Fig. 4j). Next, we used the CRISPR-Cas9 system to target the shared sequences among GBP1-5, and generated GBP1-5 knockout (KO) A375 cells (Fig. 4k). We observed that IFNγ poorly stimulated MHC-I gene machinery transcripts (Fig. 4l) and surface HLA-ABC proteins in GBP KO A375 cells (Fig. 4m). Therefore, LIMIT cis-activates GBPs to boost MHC-I machinery and tumor immunity.
GBPs activate HSF1 to stimulate MHC-I and tumor immunity
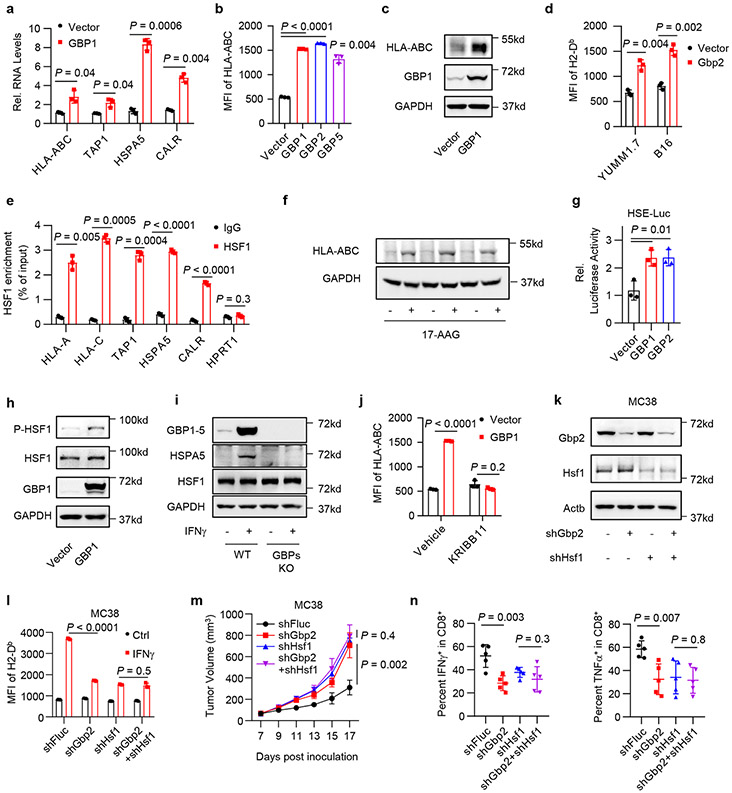
To demonstrate how GBPs may regulate MHC-I expression and tumor immunity, we forced expression of GBPs in A375 cells. Interestingly, overexpression of GBPs increased human MHC-I expression - as shown by qRT-PCR (Fig. 5a), membrane surface staining (Fig. 5b), and Western blotting (Fig. 5c). The data suggest that GBPs may activate MHC-I at the transcriptional level. Consistently, overexpression of Gbp2 increased the expression of mouse MHC-I in YUMM1.7 and B16 cells (Fig. 5d).
Fig. 5: GBPs activate HSF1 to stimulate MHC-I expression and tumor immunity.
a-c. A375 cells were forced expression of GBPs. MHC-I RNA (a), surface expression (b) or total protein (c) levels were determined 24 hours (a) or 48 hours (b, c) afterwards. P value by 2-sided t-test. 1 of 2 blots is shown.
d. MHC-I surface expression in YUMM1.7 or B16 cells upon Gbp2 overexpression. P value by 2-sided t-test.
e. HSF1 chromatin IP for indicated gene promoters were performed in IFNγ-pretreated A375 cells. P value by 2-sided t-test.
f. A375 cells were treated with 17-AAG to activate HSF1. Protein levels of HLA-ABC were determined 48 hours after treatment. 1 of 2 experiments is shown.
g. A375 HSE-luc cells were forced expression of GBPs. Luciferase activity were detected 48 hours afterwards. P value by 2-sided t-test.
h. A375 cells were forced expression of GBP1. Indicated proteins were determined 12 hours afterwards. 1 of 2 experiments is shown.
i. A375 WT or GBPs KO cells were treated with IFNγ. Indicated proteins were determined 24 hours afterwards. 1 of 2 experiments is shown.
j. A375 cells were forced expression of GBP1, and treated with KRIBB11. MHC-I surface expression was determined 48 hours afterwards. P value by 2-sided t-test.
k-l. MC38 shFluc, shGbp2, shHsf1, or shGbp2+shHsf1 cells were treated with IFNγ. Indicated proteins (k) or MHC-I surface expression (l) were determined 48 hours afterwards. 1 of 2 experiments is shown. P value by 2-sided t-test.
m. Tumor growth curves of MC38 shFluc, shGbp2, shHsf1, and shGbp2+shHsf1 cells in C57BL/6 mice. n = 5 animals, P value by 2-sided t-test for end point tumor volume.
n. Percentages of intral-tumoral IFNγ+CD8+ T cells or TNFα+CD8+ T cells in MC38 tumors carrying shFluc, shGbp2, shHsf1, or shGbp2+shHsf1. n = 5 biological independent samples, P value by 2-sided t-test.
All data are mean ± SD.
n = 3 biological independent samples in (a, b, d, e, g, j, l).
Source data are provided in Soure_data_Fig5.xlsx and Unmodified_blots_Fig5.pdf.
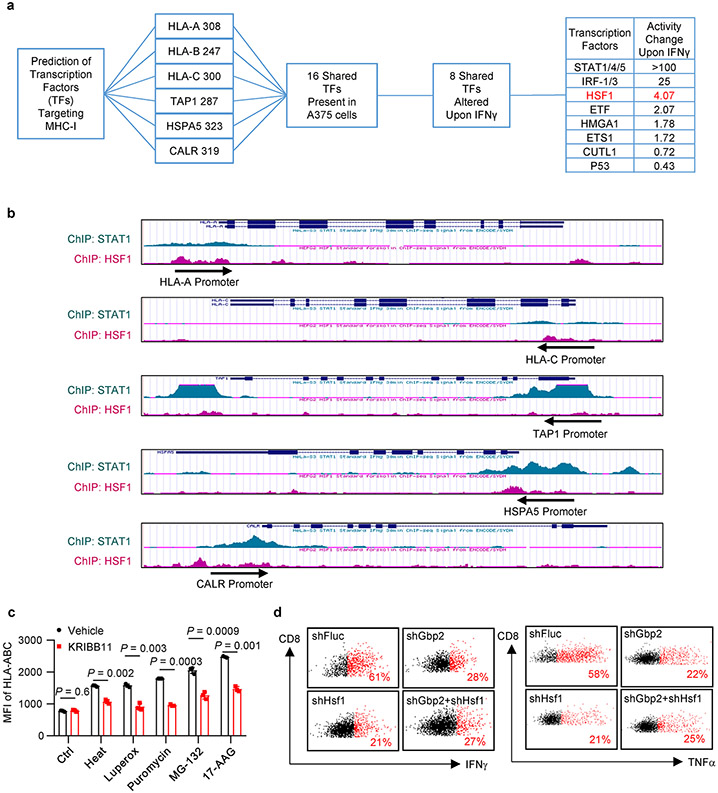
To identify transcription factor(s) that regulates MHC-I via GBPs in response to IFNγ, we performed bioinformatics prediction with PROMO27. We found 8 transcription factors altered by IFNγ in A375 cells, which may target HLA-ABC, HSPA5, CALR, and TAP1. Besides several well-known factors, HSF1 activity was highly induced by IFNγ (Extended Data Fig. 7a). By processing ChIP-seq datasets in ENCODE28, we found that both STAT1 and HSF1 were enriched in the promoters of MHC-I-associated genes with different binding patterns (Extended Data Fig. 7b). We performed ChIP assay with anti-HSF1 antibody in IFNγ-stimulated A375 cells. HSF1 was enriched in the promoters of HLA-ABC, HSPA5, CALR, and TAP1, but not HPRT1, a negative control (Fig. 5e). The results suggest that HSF1 is a transcription factor for MHC-I. HSF1 is usually activated by proteostasis interruption29. To test whether activation of HSF1 will enhance MHC-I expression, we treated A375 cells with a list of stressors30: heat shock, oxidative stress (Luperox), inhibitors of translation (puromycin), proteasome (MG-132), and chaperone (17-AAG). Interestingly, these stressors universally stimulated MHC-I expression - whereas KRIBB11, a HSF1 inhibitor, reduced this effect (Fig. 5f and Extended Data Fig.7c). Thus, activation of HSF1 generally induces MHC-I expression.
We next questioned whether GBPs could activate HSF1. Forced expression of GBPs induced the luciferase activity of HSF1 reporter HSE-Luc (Fig. 5g), as well as the phosphorylation of HSF1 (Fig. 5h). This suggests that GBPs could activate HSF1. IFNγ failed to induce HSPA5 expression in GBP-KO A375 cells (Fig. 5i). Thus, IFNγ activates HSF1 by inducing GBP expression. Furthermore, treatment with KRIBB11, an HSF1 inhibitor, abrogated the upregulation of MHC-I mediated by GBP1 overexpression (Fig. 5j). Hence, GBPs stimulate MHC-I expression in an HSF1-dependent manner.
To solidify the mechanistic relationship between GBPs and HSF1, we silenced Gbp2 and/or Hsf1 in MC38 cells (Fig. 5k). Upon IFNγ treatment, silencing of Gbp2 or Hsf1 alone diminished MHC-I expression, but simultaneously silencing Gbp2 and Hsf1 failed to additionally modulate MHC-I expression (Fig. 5l). To demonstrate the functional relevance of the interplay between GBPs and HSF1 in tumor immunity, we inoculated MC38 tumor cells expressing shFluc, shGbp2, shHSF1, or shGbp2 plus shHSF1 into C57BL/6 mice. In comparison to shFluc controls, silencing Gbp2 and silencing Hsf1 comparably accelerated tumor growth (Fig. 5m), and diminished tumor infiltrating T cell numbers and activation (Fig. 5n and Extended Data Fig. 7d). Moreover, simultaneously silencing Gbp2 and Hsf1 failed to further affect tumor growth and tumor infiltrating T cells (Fig. 5m, n and Extended Data Fig. 7d). Altogether, GBPs stimulate MHC-I expression and antitumor immunity by activating HSF1.
LIMIT-GBP-HSF1 axis drives MHC-I and tumor immunity
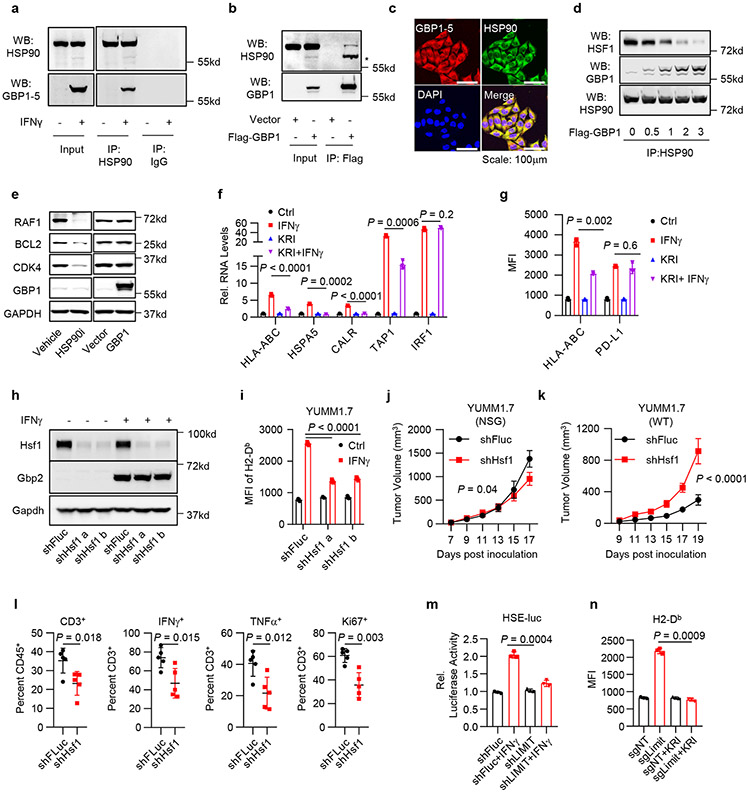
We next examined how GBPs activate HSF1 to alter MHC-I expression and tumor immunity. Under normal condition, monomeric HSF1 is associated with and suppressed by chaperones, such as HSP9031. Interruption of their interaction permits trimerization and accumulation of HSF1 in the nucleus, resulting in transcriptional activation of its target genes32. We hypothesized that GBPs may disturb the association between HSP90 and HSF1, resulting in HSF1 activation. To test this possibility, we treated A375 cells with IFNγ and performed Co-IP with HSP90 antibody. We found IFNγ-induced endogenous GBPs were associated with HSP90 (Fig. 6a). Additionally, we transfected A375 cells with exogenous Flag-GBP1 and performed the Co-IP experiment with Flag-antibody. HSP90 was detected in the IP product from Flag-GBP1 transfected cells, but not vector transfected control cells (Fig. 6b). Immunofluorescence staining demonstrated that GBPs and HSP90 were largely co-localized in the cytoplasm (Fig. 6c). When we transfected 293T cells with increasing doses of GBP1 plasmids, HSP90-associated HSF1 was reduced in a dose dependent manner (Fig. 6d). The data suggest that GBPs interacted with HSP90 and this interaction disrupted the association between HSF1 and HSP90. HSP90 is a chaperone for multiple protein folding and stability, we questioned whether GBPs may alter the chaperone activity of HSP90. Although HSP90 inhibitor suppressed the expression of HSP90 client proteins (such as RAF1, BCL2 and CDK433), overexpression of GBPs failed to do so (Fig. 6e). Thus, GBPs interact with HSP90, and release HSP90-associated HSF1, but do not alter HSP90 activity.
Fig. 6: LIMIT-GBP-HSF1 axis drives MHC-I and tumor immunity.
a. Co-IP of GBP1-5 with HSP90 antibody in IFNγ-pretreated A375 cells. 1 of 3 experiments is shown.
b. Co-IP of HSP90 with Flag antibody in Flag-GBP1-overexpressed A375 cells. * indicated the band shift of HSP90 upon GBP1 overexpression. 1 of 2 experiments is shown.
c. Immunofluorescence staining of GBP1 and HSP90 in IFNγ-pretreated A375 cells. 1 of 4 images is shown.
d. 293T cells were forced expression of Flag-HSF1 and increased doses of Flag-GBP1. Co-IP of HSF1 or GBP1 with HSP90 antibody were performed 24 hours afterwards. 1 of 2 experiments is shown.
e. A375 cells were treated with HSP90 inhibitor, or forced expression of GBP1. Indicated proteins were detected 48 hours afterwards. 1 of 2 experiments is shown.
f-g. A375 cells were treated with IFNγ and KRIBB11. RNA (f) or surface staining (g) levels of indicated genes were determined 48 hours afterwards. P value by 2-sided t-test.
h. YUMM1.7 shFluc or shHsf1 cells were treated with IFNγ. Total protein (h) or surface expression (i) levels of indicated genes were determined 48 hours afterwards. 1 of 2 experiments is shown. P value by 2-sided t-test.
j-k. Tumor growth curves of YUMM1.7 shFluc or shHsf1 cells in NSG mice (j) or wild type C57BL/6 mice (k). n = 5 (j) or 6 (k) animals, P value by 2-sided t-test for end point tumor volume.
l. Percentages of CD3+, Ki67+, IFNγ+, and TNFα+ T cells in YUMM1.7 shFluc or shHsf1 tumors. n = 5 biological independent samples, P value by 2-sided t-test.
m. A375 shFluc or shLIMIT cells were transfected with HSE-luc and PRL-SV40 overnight, and then treated with IFNγ for additional 48 hours. HSF1 transcriptional activity is depicted as the relative luciferase activity. P value by 2-sided t-test.
n. B16 cells were manipulated with Limit CRISPRa and treated with KRIBB11. Surface expression of MHC-I (H2-Db) was determined 48 hours afterwards. P value by 2-sided t-test.
All data are mean ± SD.
n = 3 biological independent samples in (f, g, i, m, n).
Source data are provided in Soure_data_Fig6.xlsx and Unmodified_blots_Fig6.pdf.
Then, we directly examined a role of HSF1 in MHC-I expression. We treated A375 cells with IFNγ in the presence of HSF1 inhibitor KRIBB11. As expected, treatment with KRIBB11 reduced IFNγ-stimulated mRNA expression of MHC-I-related genes, including HLA-ABC, TAP1, HSPA5, and CALR, but not IRF1 (Fig. 6f). Interestingly, KRIBB11 reduced IFNγ-induced MHC-I expression, but had minimal effect on PD-L1 expression (Fig. 6g). Thus, HSF1 can regulate IFNγ-induced MHC-I expression without altering the global IFNγ signaling.
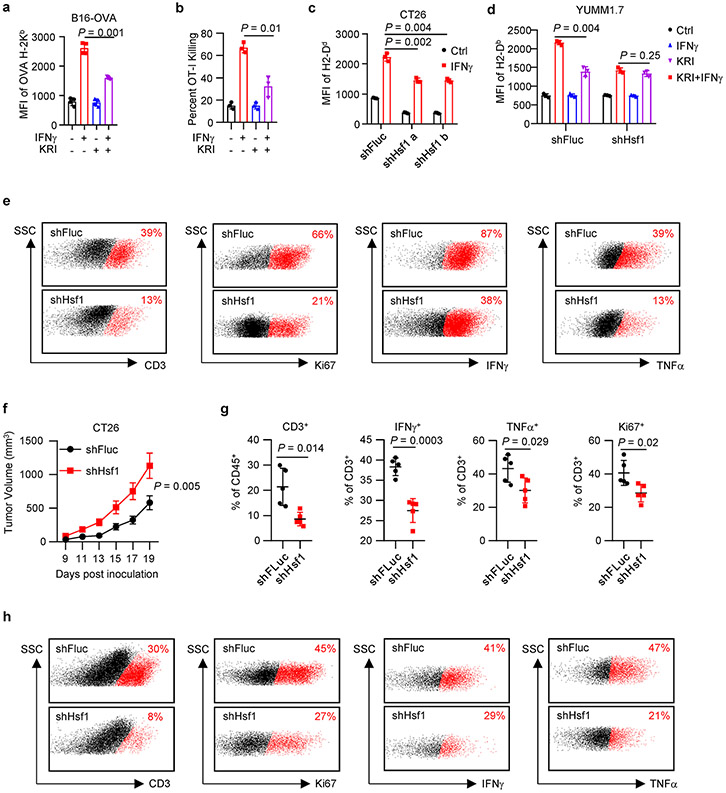
To investigate whether HSF1-regulated MHC-I was functional, we cultured B16-OVA with OT-I cells in the presence of KRIBB11 and IFNγ. KRIBB11 inhibited IFNγ-induced expression of OVA-bound MHC-I (Extended Data Fig. 8a). In line with this, KRIBB11 also suppressed OT-I cell-mediated cytotoxic effects on B16-OVA (Extended Data Fig. 8b). To extend our observations to additional tumors, we silenced Hsf1 with shHsf1 in YUMM1.7 and CT26 cells. Silencing Hsf1 resulted in decreased MHC-I expression in YUMM1.7 (Fig. 6h, i) and CT26 cells (Extended Data Fig. 8c) in response to IFNγ stimulation. In YUMM1.7 cells, silencing HSF1 failed to affect Gbp2 expression in response to IFNγ (Fig. 6h), indicating that Gbp2 is not an HSF1 target gene. In shHsf1 YUMM1.7 cells, KRIBB11 failed to suppress IFNγ-stimulated MHC-I expression (Extended Data Fig. 8d). The data suggest that HSF1 enhanced MHC-I expression in response to IFNγ, and Hsf1 is the mechanistic target of KRIBB11 to regulate MHC-I.
Given that HSF1 affected MHC-I expression, we hypothesized that HSF1 regulated anti-tumor immunity in vivo. To test this hypothesis, we inoculated control and shHsf1 YUMM1.7 tumor cells into NSG and C57BL/6 mice. We observed that silencing HSF1 partially slowed down YUMM1.7 tumor progression in NSG mice (Fig. 6j), supporting that Hsf1 helped maintain protein homeostasis and tumor progression in immune deficient model. However, silencing Hsf1 dramatically accelerated YUMM1.7 tumor growth in wild type C57BL/6 mice (Fig. 6k). The data indicates that Hsf1 may surprisingly promote a potent anti-tumor immunity in immune competent model. In support of this, we detected a reduction of the percentages of tumor infiltrating CD3+, Ki67+, IFNγ+, and TNFα+ T cells (Fig. 6l and Extended Data Fig. 8e) in the shHsf1 YUMM1.7 tumors as compared to shFluc scramble controls. In addition, we inoculated shHsf1 CT26 cells into wild type BALB/c mice. Again, silencing Hsf1 resulted in enhanced CT26 tumor growth (Extended Data Fig. 8f). This was accompanied with a reduction of the percentages of tumor infiltrating CD3+, Ki67+, IFNγ+, and TNFα+ T cells (Extended Data Fig. 8g, h). Altogether, the data suggest that the GBP-HSF1 axis drives MHC-I expression and antitumor immunity.
To mechanistically connect Hsf1 and LIMIT, we silenced LIMIT in A375 cells. Silencing LIMIT reduced the transcriptional activity of HSF1 in response to IFNγ, as determined by luciferase reporter assay (HSE-luc) (Fig. 6m). The data suggest LIMIT contributes to HSF1 activation in response to IFNγ. To test a potential involvement of HSF1 in LIMIT-mediated induction of MHC-I, we stimulated LIMIT via CRISPR activation in B16 cells, in the presence of KRIBB11. We observed that MHC-I upregulation, induced by LIMIT-activation, was abrogated by HSF1 inhibitor (Fig. 6n). The data suggest that LIMIT boosts MHC-I expression in an HSF1-dependent manner.
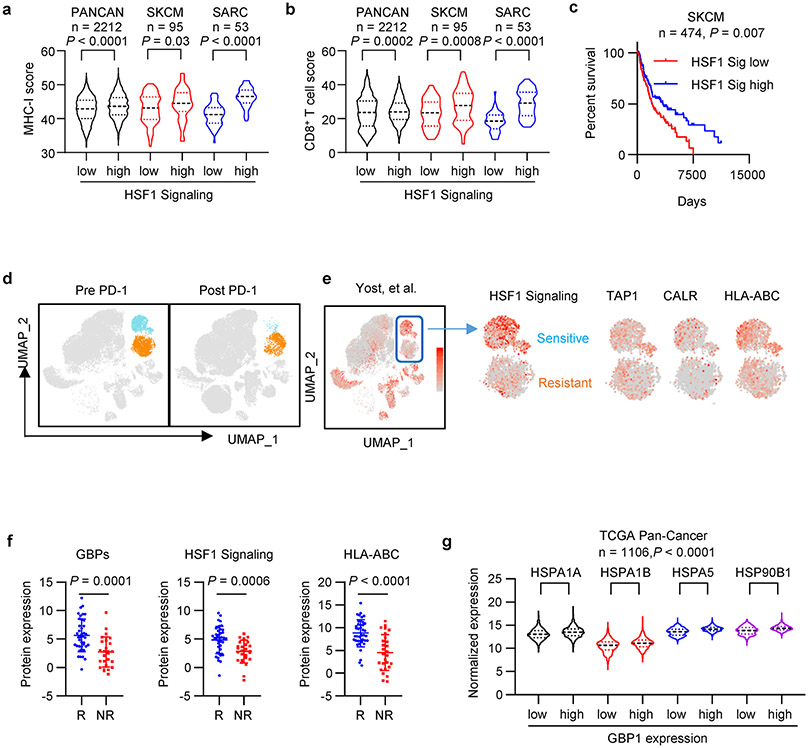
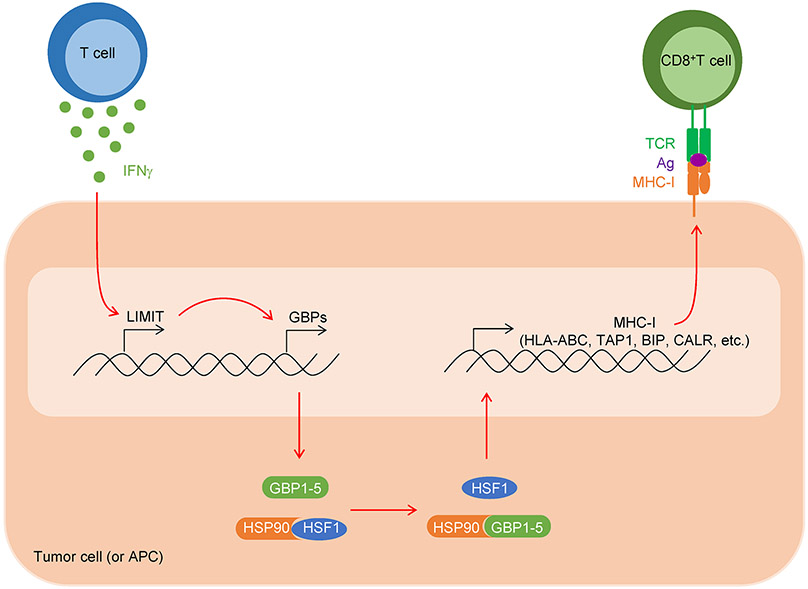
Finally, we analyzed a link among LIMIT, GBPs, and HSF1 in the context of MHC-I expression, tumor immunity, and immunotherapy in patients with cancer. Clinical analysis showed that HSF1-signaling genes correlated with MHC-I expression, CD8+ T cell infiltration, and patient survival (Extended Data Fig. 9a-c). In an immune checkpoint blockade study in patients with basal cell carcinoma34, single cell RNA-sequencing analysis revealed 2 tumor clusters; one tumor cluster was more sensitive to anti-PD-1 treatment as shown by a largely reduced tumor population (Extended Data Fig. 9d). Interestingly, this immune checkpoint sensitive tumor cluster expressed higher levels of HSF1-signaling genes as well as MHC-I gene machinery (Extended Data Fig. 9e). Moreover, in an immune checkpoint blockade study in patients with melanoma35, proteomic analysis demonstrated that the protein expression of GBPs, HSF1 signaling genes, and MHC-I were higher in clinical responders than those in non-responders (Extended Data Fig. 9f). Additionally, we observed a positive correlation between GBP1 and HSF1-signaling genes in human cancers (Extended Data Fig. 9g). The data support that the LIMIT-GBP-HSF1 axis may activate MHC-I expression, and favor anti-tumor immunity (Extended Data Fig. 10).
Discussion
Humans have 30,000-60,000 lncRNAs. However, the identities and biological functions of the vast majority of these potential lncRNAs remain poorly understood. In the cancer biology field, lncRNAs have been largely studied in the immune deficient model, leaving a knowledge gap of lncRNAs in the context of the immune system. A handful of lncRNAs are reported to affect immune cell function36,37, cancer progression, and chemotherapy efficacy38,39. However, whether specific lncRNAs are involved in antitumor immunity and immunotherapy response remains unanswered. In the present study, we have identified that LIMIT is a previously uncharacterized IFNγ-responsive lncRNA in both human and mouse cells. LIMIT can induce MHC-I and MHC-II expression, promoting T cell-mediated tumor immune response and enhancing immunotherapy efficacy. Thus, LIMIT is a previously unknown tumor immunogenic lncRNA.
IFNγ signaling pathway plays a key role in determining therapeutic response to cancer immunotherapy40 via multiple mechanisms19,20,41,42. Genetic mutations in IFNγ signaling genes contribute to checkpoint blockade resistance in patients with cancer43-48. However, IFNγ signaling can induce inhibitory PD-L1 expression49. Hence, it is ideal to identify and target a key IFNγ-signaling gene which selectively mediates anti-tumor immunity, rather than tumor immune evasion. In line with this notion, we demonstrate that LIMIT mediates MHC-I and MHC-II upregulation, but has no effect on PD-L1 expression in response to IFNγ. Thus, LIMIT may be uniquely positioned to be an immunogenic target for cancer immunotherapy.
Several strategies have been proposed to therapeutically target pathogenic lncRNAs50. However, how to elevate the levels of beneficial lncRNAs remains challenging. As cis-acting lncRNAs function locally, forced expression of these lncRNAs may be incapable of locating precisely51. While trans-acting lncRNAs may function through specific secondary structures, over-expression of these lncRNAs may not be able to generate their natural structures due to missing appropriate RNA chaperones52. By using a RNA-guided CRISPR activation strategy22, we directly activated LIMIT expression in tumor cells in preclinical models. RNA-guided CRISPR LIMIT activation can drive tumor MHC-I expression and potentiate checkpoint blockade therapy. Given that loss of MHC-I and IFNγ gene signatures frequently occur in human tumors, we suggest that CRISPR activation of beneficial lncRNAs, such as LIMIT, can rescue tumor MHC-I expression and be a potential therapeutic approach.
While in search of the mechanism by which LIMIT affects tumor immunity, we elucidated that LIMIT targets GBPs via an in cis manner24. GBPs play a role in innate immunity26,53,54. Mice lacking the entire cluster of Gbps manifest poor anti-Toxoplasma gondii response55. However, prior to our work, the mechanistic connection between LIMIT and GBPs, and biological function of GBPs in tumor immunity and immunotherapy are undetermined. We have discovered that GBPs are required for IFNγ-induced tumor MHC-I expression, CD8+ T cell killing efficiency, and effective checkpoint therapy. The data suggest that GBPs are potential target genes to boost tumor immunogenicity. We have unexpectedly uncovered that GBPs activate HSF1 to stimulate MHC-I and MHC-I related gene expression. HSF1 activation mediated by HSP90 inhibitors correlates to tumor control in immunocompetent models56,57. However, despite multiple clinical trials with HSP90 inhibitors, none of the evaluated HSP90 inhibitors has been approved by the FDA for cancer therapy, thus far58. This disappointing fact raises a possibility that HSP90 inhibitors may be detrimental to tumor immunity. The toxicity of these HSP90 inhibitors may foster their destruction of several HSP90 client proteins, such as RAF1 and BCL2, which may be critical for effector T cell proliferation and survival59,60. Given that GBPs interact with HSP90 and release HSP90-decoyed HSF1, but do not alter HSP90 activity, our data suggest that targeting GBPs may be a previously unappreciated and safe strategy to activate HSF1 for cancer immunotherapy.
In summary, we identify LIMIT as a previously unknown cancer immunogenic lncRNA. Our work suggests that targeting the LIMIT-GBP-HSF1 signaling axis can rescue expression and function of MHC-I, presenting a promising cancer immunotherapeutic approach.
Methods
Animal experiments
Six- to eight-week-old female NSG (NOD.Cg-Prkdcscid Il2rgtm1Wjl/SzJ, Stock# 005557), C57BL/6 (C57BL/6J, Stock# 000664), BALB/c (BALB/cJ, Stock# 000651), and OT-1 (C57BL/6-Tg(TcraTcrb)1100Mjb/J, Stock# 003831) mice were obtained from the Jackson Laboratory. All mice were maintained under pathogen-free conditions. The animal room has a controlled temperature (18-23°C), humidity (40-60%), and a 12 light/12 dark cycle. YUMM1.7 (1 × 10⁵), CT26 (1 × 10⁵), MC38 (2.5 × 10⁶), and B16 (1 × 10⁵) cells were subcutaneously injected into the right flank of the mice. For anti-PD-L1 treatment in MC38 model, 5 mg/kg anti-PD-L1 (InVivoMAb, 10F.9G2) and control antibody (InVivoMAb, LTF-2) were intraperitoneally administered on day 6, 9, and 12 post tumor inoculation. For anti-PD-L1 treatment in B16 model, 5 mg/kg anti-PD-L1 (InVivoMAb, 10F.9G2) and control antibody (InVivoMAb, LTF-2) were intraperitoneally administered on day 0, 3, 6, 9, 12 and 15 post tumor inoculation. Tumor diameters were measured using calipers. Tumor volume was calculated by Length × Width × Width/2. Animal studies were conducted under the approval of the Institutional Animal Care and Use Committee at the University of Michigan (PRO00008278). The study is compliant with all of the relevant ethical regulations regarding animal research. In none of the experiments did xenograft tumor size surpass 2 cm in any dimensions, and no animal had severe abdominal distension (≥ 10% original body weight increase). Sample size was chosen based on preliminary data. After tumor inoculation, mice were randomized and assigned to different groups for treatment.
Reagents
KRIBB11 and 17-AAG were purchased from Cayman Chemical. MG-132, Puromycin and Luperox were from Sigma-Aldrich. Recombinant human IFNγ (285-IF), IFNβ (8499-IF), TNFα (210-TA), IL-1β (201-LB), IL-6 (206-IL), and mouse IFNγ (485-MI) were from R&D.
Plasmids
To generate HSE-LUC, DNA sequences corresponding to heat shock elements (HSE) were synthesized, annealed, and ligated into PGL3-basic (Promega) plasmid. FLAG-HSF1 was a gift from Stuart Calderwood (Addgene #32537). For forced expression of human GBP1, GBP2, and GBP5, and mouse Gbp2, respective coding sequences were PCR amplified from the cDNA generated from IFNγ pretreated A375 cells or B16 cells, and subsequently inserted into PCI-Flag plasmid. PCI-Flag plasmid was prepared by inserting the following Kozak sequence plus Flag tag plus 5 × Glycine sequence into the PCI-neo (Promega) plasmid between NheI and XhoI. To knock down human LIMIT and mouse LIMIT, shRNAs were designed and inserted into PLKO.1 plasmid (Addgene #10879). The shRNA targeting firefly luciferase (shFluc) served as a negative control. To target the promoter region of Limit for CRISPR activation, sgRNAs (sgLimit) were designed and inserted into phU6-sgRNA plasmid (Addgene #53188). The non-targeting sgRNA (sgNT) served as a negative control. To delete the STAT1/IRF1 binding sites in LIMIT promoter, paired sgRNAs (psgLIMIT) were designed and inserted into PX459 plasmid (Addgene #48139). To knock down mouse Hsf1 and Gbp2, shRNAs were designed and inserted into PLKO.1 plasmid (Addgene #10879). To knock out GBP1-5, sgRNA was designed and inserted into PX459 plasmid (Addgene #48139). The target sequences are listed in Supplementary Table 7. The primer sequences are listed in Supplementary Tables 8.
Cell Culture
Human melanoma cell line A375 (CRL-1619), mouse melanoma cell lines, B16-F0 (CRL-6322) and YUMM1.7 (CRL-3362), mouse colon cancer cell line CT26 (CRL-2638), and 293T (CRL-3216) were purchased from the American Type Culture Collection (ATCC). Mouse colon cancer cell line MC38 was used previously in the Zou laboratory23,48. B16-OVA cells were established as previously reported42. A375 STAT1 KO, A375 GBP1-5 KO, and A375 LIMIT promoter deletion cell lines were generated in this study. All cell lines were tested for mycoplasma contamination routinely and confirmed negative for mycoplasma. Cells were cultured in RMPI medium (Gibco #11875) supplemented with 10% FBS, with the exception of A375 and 293T cells, the latter 2 lines were cultured in DMEM (Gibco #11965) supplemented with 10% FBS. All cells were maintained in 37°C and 5% CO2. For heat shock, cells were placed into an incubator at 43°C and 5% CO2 for 2 hours. To generate knock down cell lines, lentiviral particles were produced by transfection of PLKO.1 shRNA plasmid with psPAX2 (Addgene #12260) and pMD2.G (Addgene #12259) (4:3:1) into 293T cells, and subsequently transduced into tumor cells with polybrene (Sigma-Aldrich, 8 μg/ml) overnight. 48 hours after transfection, cells were selected with puromycin (1-2 μg/ml) for additional 2 weeks. To establish knock out cell lines, PX459-sgRNA plasmids were transfected into tumor cells for 2 days and selected by puromycin (1-2 μg/ml) for additional 2 days. The cells were then serially diluted and seeded into 96 well plates. After 2-3 weeks, single cell colonies were dissociated and re-plated into 6 well plates. Upon cell confluency, half of the cells were harvested and validated for knock out (KO) efficiency via Western blotting. To apply CRISPR activation system to activate mouse Limit, phU6-sgRNAs were transfected together with SP-dCas9-VPR (Addgene #63798) into B16 cells. All transfections were conducted with lipofectamine 2000 (Thermofisher) at a ratio of 1 μg plasmid: 2 μl transfection regent. The transfection dosage was determined by titration.
Luciferase activity assay
A375 cells were transfected with HSE-LUC and PRL-SV40P (Addgene #27163) for 24 hours, together with PCI-neo (vector) or GBP1, GBP2 for 48 hours. A375 shFluc or A375 shLIMIT cells were transfected with HSE-LUC and PRL-SV40P (Addgene #27163) for 24 hours, and then treated with IFNγ for an additional 48 hours. Luciferase activity for firefly luciferase (HSE-LUC) and renilla luciferase (PRL-SV40P) were measured with Dual-Luciferase Reporter Assay System (Promega). Relative firefly luciferase activity was normalized with renilla luciferase activity.
Surface staining and flow cytometry analysis (FACS)
Cells were trypsinized and washed with MACS buffer (PBS, 2%FBS, 1 mM EDTA). Surface staining was performed by adding the following antibodies to the cell suspension in 50 μl MACS buffer: anti-HLA-ABC (G46-2.6, BD Biosciences), anti-H2-Db (KH95, BD Biosciences), anti-H2-Dd (34-2-12, BD Biosciences), anti-OVA-H2-Kb (eBio25-D1.16, eBioscience), and anti-PD-L1 (MIH1, BD Biosciences). After incubating for 30 minutes, cells were washed with MACS buffer and analyzed on BD Fortessa flow cytometer.
Quantitative PCR (qPCR) analysis
Total RNA was isolated from cells by column purification (Direct-zol RNA Miniprep Kit, Zymo Research) with DNase treatment. cDNA was synthesized using RevertAid First Strand cDNA Synthesis Kit (Thermo Fisher Scientific) with random hexamer primers. Quantitative PCR (qPCR) was performed on cDNA using Fast SYBR Green Master Mix (Thermo Fisher Scientific) on a StepOnePlus Real-Time PCR System (Thermo Fisher Scientific). Gene expression was quantified using the primers listed in Supplementary Table 8. Fold changes in mRNA expression were calculated by the ΔΔCt method using ACTB as an endogenous control. Results are expressed as fold change by normalizing to the controls.
Northern blotting
Northern blot analysis was performed with 10 μg of total RNAs prepared from IFNγ, IFNβ, TNFα pretreated A375 cells. RNAs were resolved by denaturing agarose gel electrophoresis (Ambion) and transferred to Hybond-XL membranes (GE Healthcare). LIMIT was detected using digoxin-labeled DNA probes with DIG Northern Starter Kit (Roche). The probe sequences targeting LIMIT are listed in Supplementary Table 7.
Rapid Amplification of cDNA ends (RACE)
RACE was performed to identify the cDNA ends of human LIMIT or mouse Limit with SMARTer RACE cDNA Amplification Kit (Clontech). The primers for RACE are listed in Supplementary Table 8.
Clone of full-length LIMIT
After obtaining the cDNA end sequences, full-length LIMIT was PCR amplified and inserted into PCI-neo plasmid between XhoI and NotI. The clone primers for human LIMIT and mouse Limit are listed in Supplementary Table 8.
Cell fractionation for RT-PCR
IFNγ pretreated A375 cells were collected from 15 cm plates by scraping and washed once with cold PBS. Cells were pelleted by centrifugation at 700 g for 5 minutes and lysed with hypotonic lysis buffer (10 mM Tris (pH 7.5), 10 mM NaCl, 3 mM MgCl2, 0.3% (vol/vol) NP-40, 10% (vol/vol) glycerol) to collect the cytoplasmic fraction. Cytoplasmic RNA was obtained by ethanol precipitation overnight at −20 °C, followed by re-extraction using TRIZOL reagent. The remaining nuclear pellet was washed three times with the hypotonic lysis buffer, followed by extraction with TRIZOL reagent according to the manufacturer’s instructions. RNAs isolated from nuclear or cytoplasmic fractions were reverse transcribed, and performed RT-PCR for LIMIT with the indicated primers. The unspliced or mature ACTB were used as controls for nuclear or cytoplasmic RNA. The primers for ACTB are listed in Supplementary Table 8.
Western blotting
Cells were washed in cold PBS and lysed in 1 × RIPA lysis buffer (Pierce) with 1 × protease inhibitor (Pierce). Lysates were incubated on ice for 10 min and cleared by centrifugation at 15,000g for 15 minutes. Protein concentration was quantified using a BCA protein assay kit (Thermo Fisher). Thirty microgram protein was mixed with sample buffer (Thermo Fisher) with β-ME and denatured at 95°C for 5 minutes. Sample was separated by SDS–PAGE and transferred to a Nitrocellulose Membrane (Bio-Rad). Membranes were blocked with 5% w/v non-fat dry milk and incubated with primary antibodies overnight at 4 °C and HRP-conjugated secondary antibodies (CST) for 1 hour at room temperature. Signal was detected using Clarity and Clarity Max Western ECL Blotting Substrates (Bio-Rad) and captured using ChemiDoc Imaging System (Bio-Rad). Antibodies were as follows: anti-human GBP1-5 (Santa Cruz, 166960, 1: 500), anti-HSF1 (CST, 12972, 1: 1,000), anti-Phospho-HSF1 (Abcam, 76076, 1: 1000), anti-GBP1 (Proteintech, 15303, 1: 1,000), anti-Gbp2 (Proteintech, 11854, 1: 1,000), anti-HSP90 (CST, 4877, 1: 1,000), anti-HSPA5 (CST, 3177, 1: 1,000), anti-STAT1 (CST, 9172, 1: 1,000), anti-Phospho-STAT1 (CST, 9167, 1: 1000), anti-RAF1 (CST, 9422, 1: 1000), anti-BCL2 (CST, 2870, 1: 1000), anti-CDK4 (CST, 12790, 1: 1000), and anti-GAPDH (Proteintech, 60004, 1: 5,000). For human MHC-I Western blotting, total cell lysates were denatured in the sample buffer without β-ME (non-reducing) to maintain the disulphide bridges and the conformation of the proteins to be detected by anti-HLA-ABC antibody (W6/32, Novus Biologicals, 64775, 1: 1,000).
Co-Immunoprecipitation (Co-IP)
Cells were collected with IP lysis buffer (Pierce, 87787) plus protease inhibitor. Protein concentration was determined with BCA protein assay kit. 200-500 μg protein samples were added to 1-3 μg primary antibodies anti-HSP90 (Proteintech, 13171) or anti-HSF1 (CST, 12972), and incubated with gentle rocking at 4°C overnight. Then, samples were further incubated with 20 μl Protein A/G PLUS-Agarose (Santa Cruz, sc-2003) for 2 hours at 4°C; and centrifuged at 7500 ×g for 30 seconds at 4°C. Cell pellets were washed 4 times with IP lysis buffer, resuspended with 40 μl 2 × sample buffer with β-ME, and heated for 5 minutes at 95°C. The denatured protein samples were analyzed by Western blot. For Flag IP, cells lysates were incubated with 20 μl EZview Red ANTI-FLAG M2 Affinity Gel (Sigma Aldrich) and washed, denatured, and analyzed as described above.
Immunofluorescence staining
A375 cells mounted on cover slips were treated with IFNγ for 24 hours. After washing 2 times with PBS, cells were fixed with 4% PFA for 15 minutes and washed 2 times with PBS for 5 minutes each. Then, the cells were permeabilized with 0.5% triton x-100 in PBS for 10 minutes and rinsed 2 times with PBS for 5 minutes each. Antigens were blocked with 10% normal goal serum in PBS for 30 minutes. Then, primary antibodies were added at 1:50 dilutions of mouse anti-human GBP1-5 antibody (Santa Cruz, 166960) or rabbit anti-human HSP90 antibody (CST, 4877), and incubated at 4°C overnight. Afterwards, the cells were washed and incubated with 1:500 dilutions of Qdot 605 labeled secondary goat anti-mouse antibody (Thermo Fisher, Q11002) or AF488-labeled secondary goat anti-rabbit antibody (Thermo Fisher, A11034), and then mounted on glass slides with ProLong Gold reagent containing DAPI. Confocal fluorescence images were collected using a 63X oil-immersion objective (Leica SP5 Inverted 2-Photon FLIM confocal).
Chromatin immunoprecipitation (ChIP)
ChIPs were performed with cross-linked chromatin from IFNγ treated A375 cells and either HSF1 antibody (CST, 12972) or Normal Rabbit IgG (CST, 2729), using Simple ChIP Plus Enzymatic Chromatin IP Kit (Magnetic Beads) (CST, 9005). The enriched DNA was quantified by real-time PCR using the primers listed in Supplementary Table 8. The amount of immunoprecipitated DNA in each sample was represented as signal relative to total amount of input chromatin, which is equivalent to 1.
OT-I cell isolation and co-culture with OVA+ tumor cells
C57BL/6-Tg(TcraTcrb)1100Mjb/J (OT-I) mice (JAX stock #003831) were purchased from The Jackson Laboratory. Spleen was homogenized, and single cells were suspended in 2 ml Red Blood Cell Lysis Buffer (Sigma-Aldrich) for 1 minute. The splenocytes were pelleted, washed, and resuspended at 2 × 10⁶ cells per ml in RPMI culture medium containing 1 μg/ml OVA257-264 peptide, 5 μg/ml mouse recombinant IL-2, and 40 μM 2-mercaptoethanol. The cells were incubated at 37°C for 5 days. To set up the co-culture of OT-I and OVA+ tumor cells, splenocytes were collected after 5-day activation. OT-I cells were purified using EasySep mouse CD8+ T Cell Isolation Kit (Stemcell). B16-OVA cells were seeded overnight. OT-I cells were then added into the culture at different ratios. All cells were collected by trypsinization and analyzed by flow cytometry (FACS).
Bone marrow derived dendritic cells (BMDCs) and macrophages (BMDMs)
Bone marrow was isolated from C57BL/6 mouse femurs and cultured in RPMI1640 complete media with 20 ng/ml GM-CSF (R & D). Cells were incubated at 37°C and 5% CO2. Additional 10 ml medium with 20 ng/ml GM-CSF was added at day 3. On day 7, non-adherent and loosely adherent cells in the culture supernatant were harvested by gentle washing with PBS, and considered BMDCs. The adherent cells were considered BMDMs.
Intratumoral immune cell profiling
To quantify intratumoral T cells and T cell effector cytokine expression, single-cell suspensions were prepared from fresh tumor tissues by physically passing through 100 μm cell strainers. Immune cells were enriched by density gradient centrifugation. For cytokine staining, intratumoral immune cells were incubated in RPMI culture medium containing PMA (5 ng/ml), ionomycin (500 ng/ml), brefeldin A (1: 1,000), and Monessen (1: 1,000) at 37 °C for 4 hours. 2-3 μl of Anti-CD45 (30-F11, BD Biosciences), anti-CD90 (53-2.1, BD Biosciences), anti-CD3 (145-2C11, BD Biosciences), anti-CD4 (RM4-5, BD Biosciences), and anti-CD8 (53-6.7, BD Biosciences) antibodies were added for 20 minutes for surface staining. The cells were then washed and resuspended in 1 ml of freshly prepared Fix/Perm solution (BD Biosciences) at 4 °C overnight. After being washed with Perm/Wash buffer (BD Biosciences), the cells were stained with 2-3μl anti-Ki67 (B56, BD Biosciences), anti-TNF (MP6-XT22, BD Biosciences), and anti-IFNγ (XMG1.2, BD Biosciences) for 30 minutes, washed, and fixed in 4% formaldehyde (Sigma Aldrich). All samples were read on an LSR Fortessa cytometer and analyzed with FACS DIVA software v. 8.0 (BD Biosciences).
Signature score computation
We used normalized expression of genes to define the following signatures: CD8+ T cell infiltration (CD8A, CD8B, PRF1, and GZMB), MHC-I expression (HLA-A, HLA-B, and HLA-C), and HSF1 signaling (HSPA1A, HSPA1B, HSPA5, and HSP90B1).
Statistical analysis
For cell-based experiments, biological triplicates were performed in each single experiment in general, unless otherwise stated. For animal studies, no less than 5 replicates per group were employed. Animals were randomized into different groups after tumor cell inoculation. The investigators were not blinded to allocation during experiments and outcome assessment. Data are shown as mean values with standard derivation. Statistical analysis was performed using GraphPad Prism8 software (GraphPad Software, Inc.). Two-tailed 2-sided t-test was used to compare treatment groups with control groups; Survival function was estimated by Kaplan–Meier methods and log-rank test was used to calculate statistical differences.
Data availability
The RNA-seq data (GSE99299) and processed single cell data (GSE123814) were obtained from Gene Expression Omnibus (GEO). The MS proteomics data (PXD006003) were obtained from PRIDE repository. The TCGA cancer datasets were obtained from UCSC Xena (http://xena.ucsc.edu/). The RNA-seq data and clinical information for ICB clinical trials were provided by the respective corresponding authors. All raw data supporting the findings of this study are available from the corresponding author on request. Source data are provided with this paper.
Code availability
All analysis used in this study were performed following the manuals of Prism Graphpad version 8.0 and the online website at http://xena.ucsc.edu/. No new code or algorithms were developed during this study.
Extended Data
Extended Data Fig. 1:
LIMIT correlates to effector immune genes across multiple cancer types.
Extended Data Fig. 2:
Genetic loci and sequences of human LIMIT and mouse Limit.
Extended Data Fig. 3:
LIMIT augments MHC-1 expression
Extended Data Fig. 4:
LIMIT augments MHC-1 expression.
Extended Data Fig. 5:
LIMIT augments antigen-loaded MHC-1 expression in vivo.
Extended Data Fig. 6:
LIMIT cis-activates GBPs to boost MHC-1 and tumor immunity.
Extended Data Fig. 7:
GBPs activate HSF1 to stimulate MHC-I expression.
Extended Data Fig. 8:
HSF1 drives MHC-I expression and tumor immunity.
Extended Data Fig. 9:
HSF1 signaling genes correlated with MHC-I and tumor immunity.
Extended Data Fig. 10:
Scheme showing how LIMIT-GBP-HSF1 axis affects MHC-I and tumor immunity.
Supplementary Material
Acknowledgments
We thank the Zou laboratory members for intellectual input. This work was supported in part by the research grants from the U.S. NIH/NCI R01 grants (CA217648, CA123088, CA099985, CA193136, CA152470) (W.Z), and (CA216919, CA213566, CA120458 (M.C.), and the NIH through the University of Michigan Rogel Cancer Center Grant (CA46592).
Footnotes
Competing Interest Declaration
W.Z. has served as a scientific advisor or consultant for NGM, Cstone, Oncopia, and Hengenix. All other authors declare no competing interests.
References
- 1.Zou W, Wolchok JD & Chen L PD-L1 (B7-H1) and PD-1 pathway blockade for cancer therapy: Mechanisms, response biomarkers, and combinations. Sci Transl Med 8, 328rv324, doi: 10.1126/scitranslmed.aad7118 (2016). [DOI] [PMC free article] [PubMed] [Google Scholar]
- 2.Schumacher TN & Schreiber RD Neoantigens in cancer immunotherapy. Science 348, 69–74, doi: 10.1126/science.aaa4971 (2015). [DOI] [PubMed] [Google Scholar]
- 3.Garcia-Lora A, Algarra I & Garrido F MHC class I antigens, immune surveillance, and tumor immune escape. J Cell Physiol 195, 346–355, doi: 10.1002/jcp.10290 (2003). [DOI] [PubMed] [Google Scholar]
- 4.Festenstein H & Garrido F MHC antigens and malignancy. Nature 322, 502–503, doi: 10.1038/322502a0 (1986). [DOI] [PubMed] [Google Scholar]
- 5.Garrido F, Aptsiauri N, Doorduijn EM, Garcia Lora AM & van Hall T The urgent need to recover MHC class I in cancers for effective immunotherapy. Curr Opin Immunol 39, 44–51, doi: 10.1016/j.coi.2015.12.007 (2016). [DOI] [PMC free article] [PubMed] [Google Scholar]
- 6.Hon CC et al. An atlas of human long non-coding RNAs with accurate 5' ends. Nature 543, 199–204, doi: 10.1038/nature21374 (2017). [DOI] [PMC free article] [PubMed] [Google Scholar]
- 7.Mercer TR, Dinger ME & Mattick JS Long non-coding RNAs: insights into functions. Nat Rev Genet 10, 155–159, doi: 10.1038/nrg2521 (2009). [DOI] [PubMed] [Google Scholar]
- 8.Ponting CP, Oliver PL & Reik W Evolution and functions of long noncoding RNAs. Cell 136, 629–641, doi: 10.1016/j.cell.2009.02.006 (2009). [DOI] [PubMed] [Google Scholar]
- 9.Wilusz JE, Sunwoo H & Spector DL Long noncoding RNAs: functional surprises from the RNA world. Genes Dev 23, 1494–1504, doi: 10.1101/gad.1800909 (2009). [DOI] [PMC free article] [PubMed] [Google Scholar]
- 10.Kung JT, Colognori D & Lee JT Long noncoding RNAs: past, present, and future. Genetics 193, 651–669, doi: 10.1534/genetics.112.146704 (2013). [DOI] [PMC free article] [PubMed] [Google Scholar]
- 11.Flynn RA & Chang HY Long noncoding RNAs in cell-fate programming and reprogramming. Cell Stem Cell 14, 752–761, doi: 10.1016/j.stem.2014.05.014 (2014). [DOI] [PMC free article] [PubMed] [Google Scholar]
- 12.Huarte M The emerging role of lncRNAs in cancer. Nat Med 21, 1253–1261, doi: 10.1038/nm.3981 (2015). [DOI] [PubMed] [Google Scholar]
- 13.Frankish A et al. GENCODE reference annotation for the human and mouse genomes. Nucleic Acids Res 47, D766–D773, doi: 10.1093/nar/gky955 (2019). [DOI] [PMC free article] [PubMed] [Google Scholar]
- 14.Riaz N et al. Tumor and Microenvironment Evolution during Immunotherapy with Nivolumab. Cell 171, 934–949 e916, doi: 10.1016/j.cell.2017.09.028 (2017). [DOI] [PMC free article] [PubMed] [Google Scholar]
- 15.Hugo W et al. Genomic and Transcriptomic Features of Response to Anti-PD-1 Therapy in Metastatic Melanoma. Cell 168, 542, doi: 10.1016/j.cell.2017.01.010 (2017). [DOI] [PubMed] [Google Scholar]
- 16.Van Allen EM et al. Genomic correlates of response to CTLA-4 blockade in metastatic melanoma. Science 350, 207–211, doi: 10.1126/science.aad0095 (2015). [DOI] [PMC free article] [PubMed] [Google Scholar]
- 17.Nathanson T et al. Somatic Mutations and Neoepitope Homology in Melanomas Treated with CTLA-4 Blockade. Cancer Immunol Res 5, 84–91, doi: 10.1158/2326-6066.CIR-16-0019 (2017). [DOI] [PMC free article] [PubMed] [Google Scholar]
- 18.Sui J et al. Systematic analyses of a novel lncRNA-associated signature as the prognostic biomarker for Hepatocellular Carcinoma. Cancer Med, doi: 10.1002/cam4.1541 (2018). [DOI] [PMC free article] [PubMed] [Google Scholar]
- 19.Kaplan DH et al. Demonstration of an interferon gamma-dependent tumor surveillance system in immunocompetent mice. Proc Natl Acad Sci U S A 95, 7556–7561, doi: 10.1073/pnas.95.13.7556 (1998). [DOI] [PMC free article] [PubMed] [Google Scholar]
- 20.Fruh K & Yang Y Antigen presentation by MHC class I and its regulation by interferon gamma. Curr Opin Immunol 11, 76–81 (1999). [DOI] [PubMed] [Google Scholar]
- 21.Dong H et al. Tumor-associated B7-H1 promotes T-cell apoptosis: a potential mechanism of immune evasion. Nat Med 8, 793–800, doi: 10.1038/nm730 (2002). [DOI] [PubMed] [Google Scholar]
- 22.Perez-Pinera P et al. RNA-guided gene activation by CRISPR-Cas9-based transcription factors. Nat Methods 10, 973–976, doi: 10.1038/nmeth.2600 (2013). [DOI] [PMC free article] [PubMed] [Google Scholar]
- 23.Lin H et al. Host expression of PD-L1 determines efficacy of PD-L1 pathway blockade-mediated tumor regression. J Clin Invest 128, 1708, doi: 10.1172/JCI120803 (2018). [DOI] [PMC free article] [PubMed] [Google Scholar]
- 24.Sun Q, Hao Q & Prasanth KV Nuclear Long Noncoding RNAs: Key Regulators of Gene Expression. Trends Genet 34, 142–157, doi: 10.1016/j.tig.2017.11.005 (2018). [DOI] [PMC free article] [PubMed] [Google Scholar]
- 25.Cheng YS, Colonno RJ & Yin FH Interferon induction of fibroblast proteins with guanylate binding activity. J Biol Chem 258, 7746–7750 (1983). [PubMed] [Google Scholar]
- 26.Kim BH et al. Interferon-induced guanylate-binding proteins in inflammasome activation and host defense. Nat Immunol 17, 481–489, doi: 10.1038/ni.3440 (2016). [DOI] [PMC free article] [PubMed] [Google Scholar]
- 27.Messeguer X et al. PROMO: detection of known transcription regulatory elements using species-tailored searches. Bioinformatics 18, 333–334, doi: 10.1093/bioinformatics/18.2.333 (2002). [DOI] [PubMed] [Google Scholar]
- 28.Consortium, E. P. An integrated encyclopedia of DNA elements in the human genome. Nature 489, 57–74, doi: 10.1038/nature11247 (2012). [DOI] [PMC free article] [PubMed] [Google Scholar]
- 29.Dai C & Sampson SB HSF1: Guardian of Proteostasis in Cancer. Trends Cell Biol 26, 17–28, doi: 10.1016/j.tcb.2015.10.011 (2016). [DOI] [PMC free article] [PubMed] [Google Scholar]
- 30.West JD, Wang Y & Morano KA Small molecule activators of the heat shock response: chemical properties, molecular targets, and therapeutic promise. Chem Res Toxicol 25, 2036–2053, doi: 10.1021/tx300264x (2012). [DOI] [PMC free article] [PubMed] [Google Scholar]
- 31.Zou J, Guo Y, Guettouche T, Smith DF & Voellmy R Repression of heat shock transcription factor HSF1 activation by HSP90 (HSP90 complex) that forms a stress-sensitive complex with HSF1. Cell 94, 471–480 (1998). [DOI] [PubMed] [Google Scholar]
- 32.Dayalan Naidu S & Dinkova-Kostova AT Regulation of the mammalian heat shock factor 1. FEBS J 284, 1606–1627, doi: 10.1111/febs.13999 (2017). [DOI] [PubMed] [Google Scholar]
- 33.Whitesell L & Lindquist SL HSP90 and the chaperoning of cancer. Nat Rev Cancer 5, 761–772, doi: 10.1038/nrc1716 (2005). [DOI] [PubMed] [Google Scholar]
- 34.Yost KE et al. Clonal replacement of tumor-specific T cells following PD-1 blockade. Nat Med 25, 1251–1259, doi: 10.1038/s41591-019-0522-3 (2019). [DOI] [PMC free article] [PubMed] [Google Scholar]
- 35.Harel M et al. Proteomics of Melanoma Response to Immunotherapy Reveals Mitochondrial Dependence. Cell 179, 236–250 e218, doi: 10.1016/j.cell.2019.08.012 (2019). [DOI] [PMC free article] [PubMed] [Google Scholar]
- 36.Heward JA & Lindsay MA Long non-coding RNAs in the regulation of the immune response. Trends Immunol 35, 408–419, doi: 10.1016/j.it.2014.07.005 (2014). [DOI] [PMC free article] [PubMed] [Google Scholar]
- 37.Flores-Concha M & Onate AA Long Non-coding RNAs in the Regulation of the Immune Response and Trained Immunity. Front Genet 11, 718, doi: 10.3389/fgene.2020.00718 (2020). [DOI] [PMC free article] [PubMed] [Google Scholar]
- 38.Schmitt AM & Chang HY Long Noncoding RNAs in Cancer Pathways. Cancer Cell 29, 452–463, doi: 10.1016/j.ccell.2016.03.010 (2016). [DOI] [PMC free article] [PubMed] [Google Scholar]
- 39.Sun TT et al. LncRNA GClnc1 Promotes Gastric Carcinogenesis and May Act as a Modular Scaffold of WDR5 and KAT2A Complexes to Specify the Histone Modification Pattern. Cancer Discov 6, 784–801, doi: 10.1158/2159-8290.CD-15-0921 (2016). [DOI] [PubMed] [Google Scholar]
- 40.Sharma P, Hu-Lieskovan S, Wargo JA & Ribas A Primary, Adaptive, and Acquired Resistance to Cancer Immunotherapy. Cell 168, 707–723, doi: 10.1016/j.cell.2017.01.017 (2017). [DOI] [PMC free article] [PubMed] [Google Scholar]
- 41.Peng D et al. Epigenetic silencing of TH1-type chemokines shapes tumour immunity and immunotherapy. Nature 527, 249–253, doi: 10.1038/nature15520 (2015). [DOI] [PMC free article] [PubMed] [Google Scholar]
- 42.Wang W et al. CD8(+) T cells regulate tumour ferroptosis during cancer immunotherapy. Nature 569, 270–274, doi: 10.1038/s41586-019-1170-y (2019). [DOI] [PMC free article] [PubMed] [Google Scholar]
- 43.Gao J et al. Loss of IFN-gamma Pathway Genes in Tumor Cells as a Mechanism of Resistance to Anti-CTLA-4 Therapy. Cell 167, 397–404 e399, doi: 10.1016/j.cell.2016.08.069 (2016). [DOI] [PMC free article] [PubMed] [Google Scholar]
- 44.Zaretsky JM et al. Mutations Associated with Acquired Resistance to PD-1 Blockade in Melanoma. N Engl J Med 375, 819–829, doi: 10.1056/NEJMoa1604958 (2016). [DOI] [PMC free article] [PubMed] [Google Scholar]
- 45.Manguso RT et al. In vivo CRISPR screening identifies Ptpn2 as a cancer immunotherapy target. Nature 547, 413–418, doi: 10.1038/nature23270 (2017). [DOI] [PMC free article] [PubMed] [Google Scholar]
- 46.Shin DS et al. Primary Resistance to PD-1 Blockade Mediated by JAK1/2 Mutations. Cancer Discov 7, 188–201, doi: 10.1158/2159-8290.CD-16-1223 (2017). [DOI] [PMC free article] [PubMed] [Google Scholar]
- 47.Sucker A et al. Acquired IFNgamma resistance impairs anti-tumor immunity and gives rise to T-cell-resistant melanoma lesions. Nat Commun 8, 15440, doi: 10.1038/ncomms15440 (2017). [DOI] [PMC free article] [PubMed] [Google Scholar]
- 48.Li J et al. Epigenetic driver mutations in ARID1A shape cancer immune phenotype and immunotherapy. J Clin Invest, doi: 10.1172/JCI134402 (2020). [DOI] [PMC free article] [PubMed] [Google Scholar]
- 49.Benci JL et al. Tumor Interferon Signaling Regulates a Multigenic Resistance Program to Immune Checkpoint Blockade. Cell 167, 1540–1554 e1512, doi: 10.1016/j.cell.2016.11.022 (2016). [DOI] [PMC free article] [PubMed] [Google Scholar]
- 50.Arun G, Diermeier SD & Spector DL Therapeutic Targeting of Long Non-Coding RNAs in Cancer. Trends Mol Med 24, 257–277, doi: 10.1016/j.molmed.2018.01.001 (2018). [DOI] [PMC free article] [PubMed] [Google Scholar]
- 51.Gil N & Ulitsky I Regulation of gene expression by cis-acting long non-coding RNAs. Nat Rev Genet 21, 102–117, doi: 10.1038/s41576-019-0184-5 (2020). [DOI] [PubMed] [Google Scholar]
- 52.Jones AN & Sattler M Challenges and perspectives for structural biology of lncRNAs-the example of the Xist lncRNA A-repeats. J Mol Cell Biol 11, 845–859, doi: 10.1093/jmcb/mjz086 (2019). [DOI] [PMC free article] [PubMed] [Google Scholar]
- 53.Shenoy AR et al. GBP5 promotes NLRP3 inflammasome assembly and immunity in mammals. Science 336, 481–485, doi: 10.1126/science.1217141 (2012). [DOI] [PubMed] [Google Scholar]
- 54.Tretina K, Park ES, Maminska A & MacMicking JD Interferon-induced guanylate-binding proteins: Guardians of host defense in health and disease. J Exp Med 216, 482–500, doi: 10.1084/jem.20182031 (2019). [DOI] [PMC free article] [PubMed] [Google Scholar]
- 55.Yamamoto M et al. A cluster of interferon-gamma-inducible p65 GTPases plays a critical role in host defense against Toxoplasma gondii. Immunity 37, 302–313, doi: 10.1016/j.immuni.2012.06.009 (2012). [DOI] [PubMed] [Google Scholar]
- 56.Mbofung RM et al. HSP90 inhibition enhances cancer immunotherapy by upregulating interferon response genes. Nat Commun 8, 451, doi: 10.1038/s41467-017-00449-z (2017). [DOI] [PMC free article] [PubMed] [Google Scholar]
- 57.Proia DA & Kaufmann GF Targeting Heat-Shock Protein 90 (HSP90) as a Complementary Strategy to Immune Checkpoint Blockade for Cancer Therapy. Cancer Immunol Res 3, 583–589, doi: 10.1158/2326-6066.CIR-15-0057 (2015). [DOI] [PubMed] [Google Scholar]
- 58.Yuno A et al. Clinical Evaluation and Biomarker Profiling of Hsp90 Inhibitors. Methods Mol Biol 1709, 423–441, doi: 10.1007/978-1-4939-7477-1_29 (2018). [DOI] [PubMed] [Google Scholar]
- 59.Charo J et al. Bcl-2 overexpression enhances tumor-specific T-cell survival. Cancer Res 65, 2001–2008, doi: 10.1158/0008-5472.CAN-04-2006 (2005). [DOI] [PMC free article] [PubMed] [Google Scholar]
- 60.Owaki H et al. Raf-1 is required for T cell IL2 production. EMBO J 12, 4367–4373 (1993). [DOI] [PMC free article] [PubMed] [Google Scholar]
Associated Data
This section collects any data citations, data availability statements, or supplementary materials included in this article.
Supplementary Materials
Data Availability Statement
The RNA-seq data (GSE99299) and processed single cell data (GSE123814) were obtained from Gene Expression Omnibus (GEO). The MS proteomics data (PXD006003) were obtained from PRIDE repository. The TCGA cancer datasets were obtained from UCSC Xena (http://xena.ucsc.edu/). The RNA-seq data and clinical information for ICB clinical trials were provided by the respective corresponding authors. All raw data supporting the findings of this study are available from the corresponding author on request. Source data are provided with this paper.


