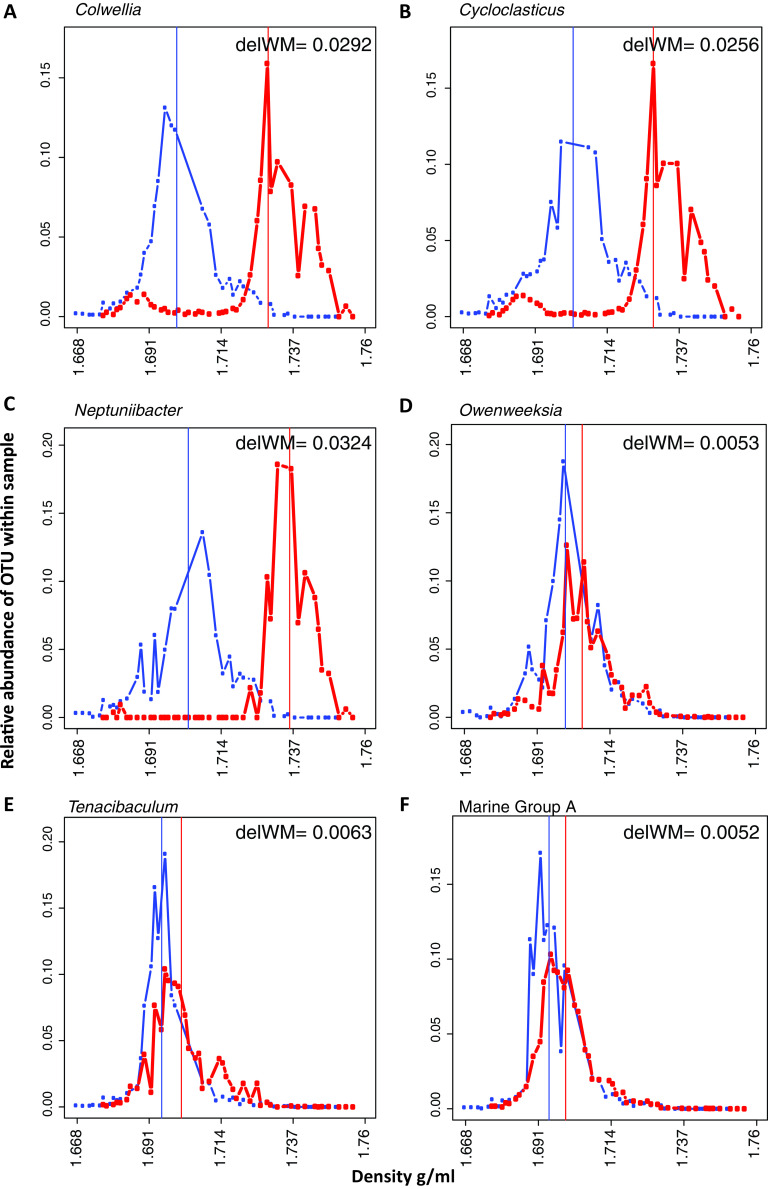
FIG 2.
Density shifts demonstrating which taxa took up 13C naphthalene. (A to F) Distribution of labeled (13C, red) and control (12C, blue) normalized relative abundance as a function of buoyant density of (A) Colwellia, (B) Cycloclasticus, (C) Neptuniibacter, (D) Owenweeksia, (E) Tenacibaculum, and (F) Marine group A. Vertical lines represent the weighted mean of the distribution. The difference between the weighted mean density (WM) of the labeled (13C) and control (12C) (delWM) is noted on each plot. OTUs are based on 16S-rRNA community analysis performed on each fraction normalized by the amount of DNA per fraction.

