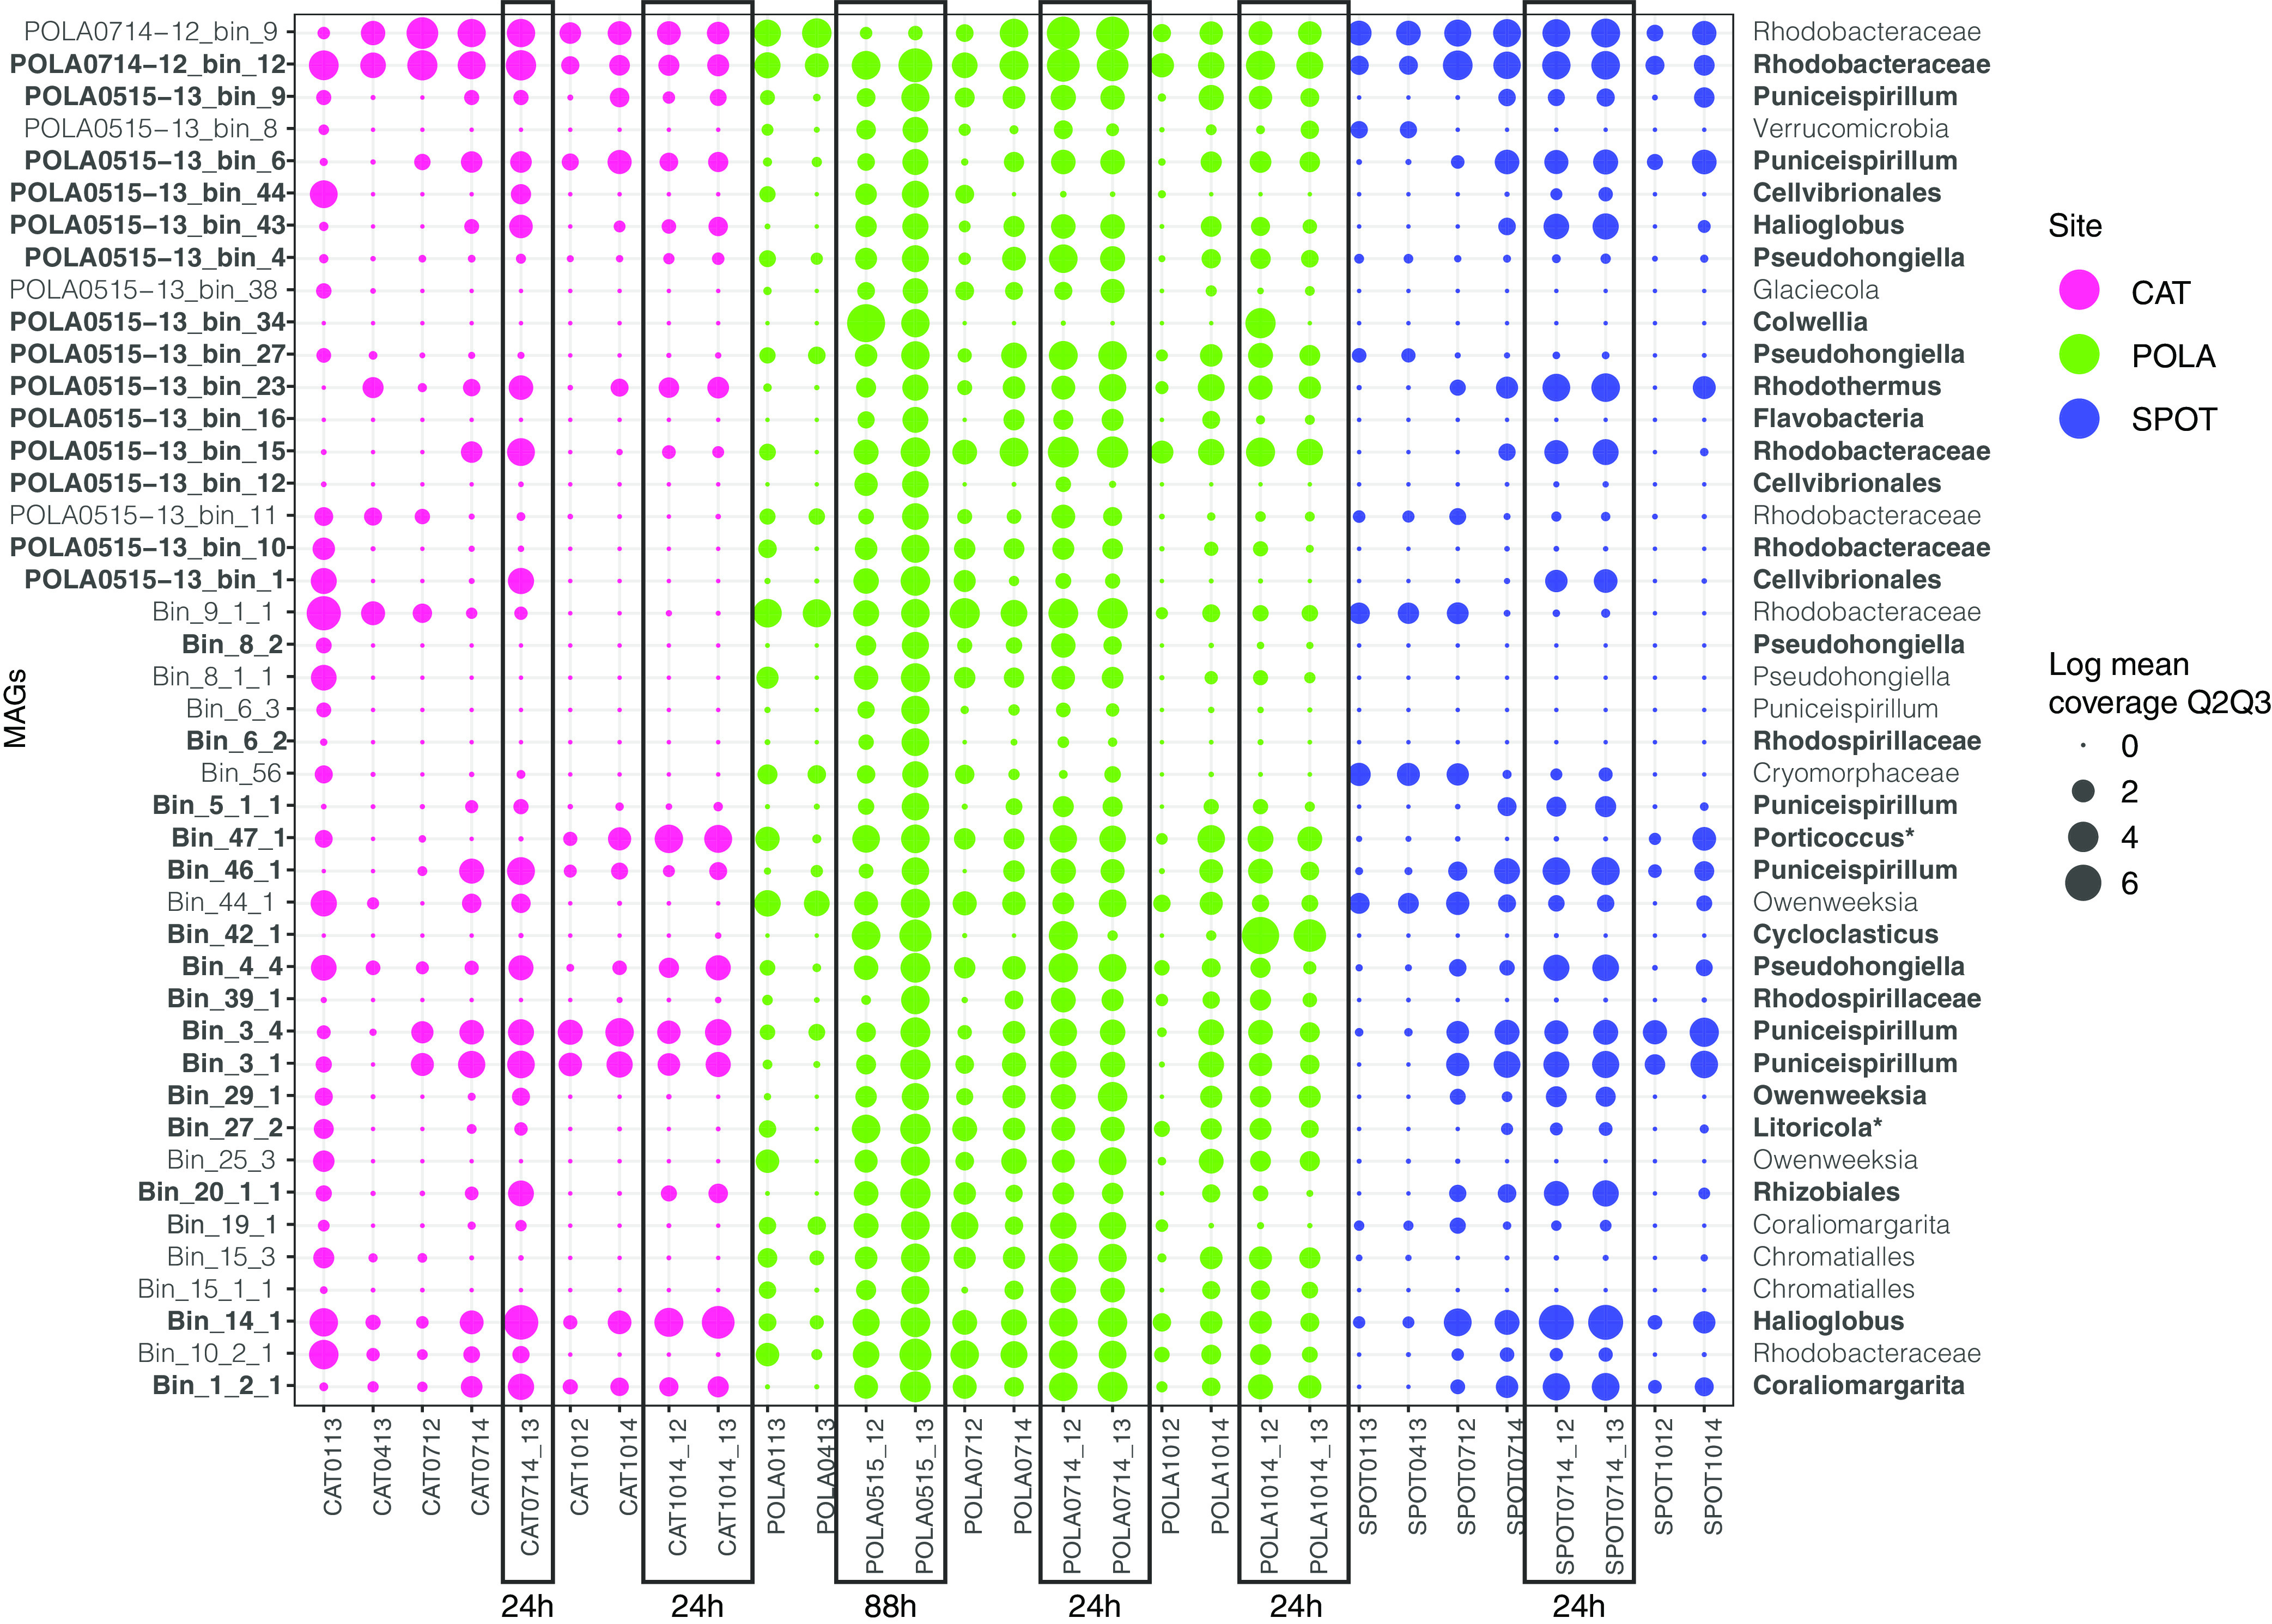
FIG 3.

Abundance of MAGs in response to amendment with naphthalene. Each row represents a MAG. Mean metagenomic coverage (measure of abundance) of MAGs in naphthalene-amended and unamended seawater was normalized to sequencing depth and log-transformed. Each column represents a sample with collection month and year indicated (e.g., 0113 is January 2013). Amended samples have _12 (12C-naphthalene added) or _13 (13C-naphthalene added) next to the sample name and are outlined by rectangles. Incubation time is denoted under the rectangles. The rest of the samples represent t0 (before naphthalene addition). MAG taxonomy by GToTree is displayed on the right. MAGs in bold font had significantly higher coverage in naphthalene-amended samples (P value < 0.05). *, 16S-rRNA-based taxonomy where its resolution was higher than GToTree taxonomy.
