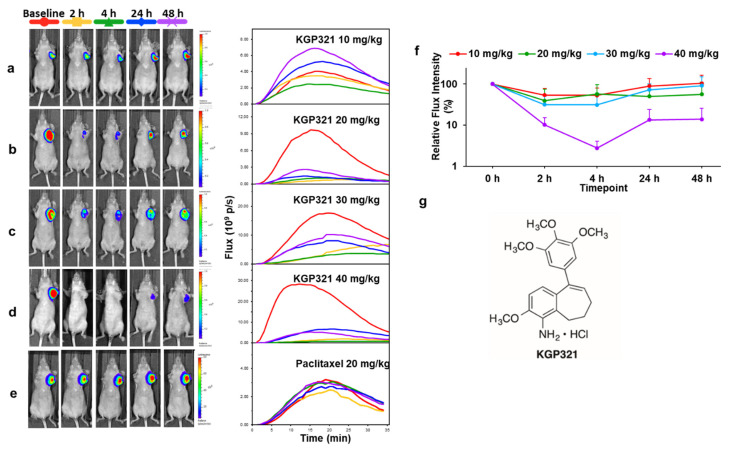
Figure 6.
Dose response of MDA-MB-231-luc MFP tumors to KGP321. Left: BLI signal intensity images overlaid as heat maps on gray scale photographs of nude mice at 16 min following administration of luciferin at selected time points following administration of KGP321. Center: BLI intensity curves for the respective individual mice at left show differential variation over a period of 35 min following administration of luciferin at baseline (red), 2 h post (orange), 4 h (green) and 24 h (blue), 48 h (purple). (a) 10 mg/kg (n = 4); (b) 20 mg/kg (n = 3); (c) 30 mg/kg (n = 3); (d) 40 mg/kg (n = 3); (e) Paclitaxel (20 mg/kg) showing no acute changes in BLI signal. (f) BLI relative intensity change curves showing variation over a period of 48 h following administration of different doses of KGP321. Line colors 10 mg/kg (red); 20 mg/kg (green); 30 mg/kg blue) and 40 mg/kg (purple). ANOVA based on Fisher’s PLSD indicated that over the 72 h-time course all doses 10–40 mg/kg gave significantly different light emission from vehicle alone (p < 0.005), but there was no significant difference between the doses. At 30 and 40 mg/kg there was significantly less light emission at 2 and 4 h compared with baseline (p < 0.05) and this continued up to 72 h for 40 mg/kg (p < 0.0001). (g) Structure of KGP321, a novel aminobenzosuberene-based VDA.

