

Abstract
PTEN is one of the most frequently mutated genes in malignancies and acts as a powerful tumor suppressor. Tumorigenesis is involved in multiple and complex processes including initiation, invasion, and metastasis. The complexity of PTEN function is partially attributed to PTEN family members such as PTENα and PTENβ. Here, we report the identification of PTENε (also named as PTEN5), a novel N‐terminal‐extended PTEN isoform that suppresses tumor invasion and metastasis. We show that the translation of PTENε/PTEN5 is initiated from the CUG816 codon within the 5′UTR region of PTEN mRNA. PTENε/PTEN5 mainly localizes in the cell membrane and physically associates with and dephosphorylates VASP and ACTR2, which govern filopodia formation and cell motility. We found that endogenous depletion of PTENε/PTEN5 promotes filopodia formation and enhances the metastasis capacity of tumor cells. Overall, we identify a new isoform of PTEN with distinct subcellular localization and molecular function compared to the known members of the PTEN family. These findings advance our current understanding of the importance and diversity of PTEN functions.
Keywords: alternative initiation, filopodia formation, metastasis, PTEN5, PTENε
Subject Categories: Cancer; Cell Adhesion, Polarity & Cytoskeleton; Protein Biosynthesis & Quality Control
A novel isoform of PTEN is regulated by eIF2A and has a unique function in controlling tumor cell motility.
Introduction
PTEN was discovered independently by two groups in 1997 as a pivotal tumor suppressor that is often lost or mutated in cancers (Li & Sun, 1997; Li et al, 1997). Germline mutations of the PTEN gene lead to inherited autosomal dominant hamartoma tumor syndromes collectively referred to as the PTEN hamartoma tumor syndromes (PHTS), which provides a basic understanding of the role PTEN plays in tumorigenesis (Liaw et al, 1997). As a dual‐functional phosphatase, PTEN is located in the cytoplasm and nucleus and can also be secreted from cells (Planchon et al, 2008; Putz et al, 2012). The optimal substrate of PTEN in the cytoplasm is PtdIns(3,4,5)P3 that activates AKT signaling. With the lipid phosphatase activity, PTEN can dephosphorylate PIP3 at 3′position and convert it back into PIP2, antagonizing the PI3K/AKT pathway that is involved in multiple cellular activities, including cell growth, differentiation, proliferation, survival, motility, and invasion (Yao & Cooper, 1995; Datta et al, 1997; Maehama & Dixon, 1998; Myers et al, 1998; Qian et al, 2004; Park et al, 2006; Peltier et al, 2007). In addition to its cytoplasm localization, PTEN can also be translocated into the nucleus, and nuclear PTEN mainly participates in the maintenance of chromosome stability, pre‐mRNA splicing modulation, and regulation of DNA repair pathways (Shen et al, 2007; Song et al, 2011; Bassi et al, 2013; Shen et al, 2018). PTEN is also emerging as an important factor in normal cellular homeostases such as cell metabolism, cell cycle progression, stem cell self‐renewal, and antiviral innate immunity (Knobbe et al, 2008; Garcia‐Cao et al, 2012; Li et al, 2016; Brandmaier et al, 2017). PTEN dysregulation is also highly related to diseases other than tumors including diabetes and autism spectrum disorders (Butler et al, 2005; Stiles et al, 2006). Nonetheless, the current exploration of the PTEN function cannot fully illustrate the diversity of its involvement in multiple biological processes.
Previously, an N‐terminal extended isoform initiated from a CUG codon in the 5′untranslated region (5′UTR) of PTEN mRNA termed as PTENα (also known as PTEN‐Long) was identified (Hopkins et al, 2013; Liang et al, 2014). We have also identified another PTEN isoform initiated from an AUU codon, termed as PTENβ (Liang et al, 2017). Compared with canonical PTEN, PTENα and PTENβ have distinct subcellular localization, in which PTENα is mainly localized in mitochondria while PTENβ is predominantly distributed in the nucleolus. PTENα forms a heterodimer with canonical PTEN in the mitochondria and interacts with COX1, thus regulating the mitochondrial function and energy production whereas PTENβ interacts with and directly dephosphorylates nucleolin, which in turn negatively regulates ribosomal DNA transcription and ribosomal biogenesis (Liang et al, 2014; Liang et al, 2017). Moreover, PTENα was found to be a membrane‐permeable variant of PTEN that can be secreted from cells and taken up directly by other cells, and an N‐terminal poly‐Arginine sequence was proved to be critical for its cell penetration and subsequent inhibition of PI3K–AKT both in vitro and in vivo (Hopkins et al, 2013). It is reported that PTENα and PTENβ directly interact with the histone H3 lysine 4 (H3K4) presenter WDR5 through their N‐terminal extended domains to promote H3K4 trimethylation and maintain a tumor‐promoting signature (Shen et al, 2019). These findings demonstrate that the recognition of PTENα and PTENβ helps to illustrate the complicacies of PTEN function, also indicating other unidentified PTEN isoforms may exist that are involved in various biological processes.
There are at least four additional N‐terminally extended forms of PTEN that could be translated utilizing staring codons in the 5′UTR region of PTEN mRNA, except for PTENα and PTENβ. In the current study, we found that translation initiation from a CUG codon at 216 bp upstream of the AUG start codon for canonical PTEN leads to the synthesis of a novel PTEN isoform named PTENε (or PTEN5), which comprises an N‐terminal extension of 72 amino acids (Homo sapiens) compared with canonical PTEN protein. Our results show that PTENε is mainly distributed in the cell plasma membrane and suppresses filopodia formation. Overexpression of PTENε leads to a significant reduction of filopodia and inhibits their migration and invasion capacity in PTEN‐null tumor cells while depletion of endogenous PTENε promotes filopodia formation in the cell membrane and tumor metastasis. These findings collectively characterize a new N‐terminal extended PTEN isoform with distinct subcellular localization and molecular function compared with canonical PTEN protein and other known PTEN isoforms. Identification of PTENε further illustrates the multifunctional role of the PTEN family and the function of this new PTEN isoform.
Results
PTEN variants generated by initiation at codons within PTEN 5′ UTR
PTENα and PTENβ are N‐terminal extended isoforms of PTEN, which are initiated by non‐AUG start codons, and can be recognized by PTEN antibodies (Liang et al, 2014; Liang et al, 2017). We found that a polyclonal antibody against the full‐length PTEN interacts with four unidentified proteins with molecular weights lower than PTENβ (between 72 and 55 kDa) in Hela cells (Fig 1A, lane 1). To exclude the possibility that these unidentified proteins could be proteolytically cleavage products of previously reported N‐terminally extended PTEN isoforms, somatic PTENα and PTENβ knockout cell lines were established with the CRISPR‐Cas9 approach (Appendix Fig S1A). The insertion of a TAG stop codon immediately downstream of the PTENβ initiation codon AUU594 led only to the disappearance of the slower migrating proteo‐forms PTENα and PTENβ without any effect on the proteins between 72 and 55 kDa, thus ruling out the possibility that some of these unidentified proteins are cleavage products (Fig 1A, lane 2 vs. lane 1). We then examined a panel of cancer cell lines with PTEN‐null PC3 cells as the negative control, and these PTEN‐like proteins were recognized by the monoclonal antibody against the PTEN C‐terminal domain in all tested cell lines other than PC3, suggesting that these proteins may harbor similar or identical C‐terminal regions as canonical PTEN (Fig 1B). To confirm this observation, Hela and HepG2 cancer cell lines were examined with a homemade anti‐PTENα antibody against the 173 N‐terminal amino acids of PTENα (Liang et al, 2014; Liang et al, 2017). This anti‐PTENα antibody recognized three of the unidentified proteins with larger molecular weights, indicating that they were most likely novel N‐terminally extended PTEN variants (Fig 1C). In addition, a TAG stop codon that terminates translation from upstream initiation sites was inserted upstream of the AUG1032 start codon of canonical PTEN with CRISPR‐Cas9 (Appendix Fig S1B), and this somatic mutation eliminated all the four PTEN‐like proteins along with PTENα and PTENβ without affecting canonical PTEN expression (Fig 1D, lane 2 vs. lane 1), thus excluding the possibility of these unidentified proteins being the bands of canonical PTEN modifications and indicating that these PTEN‐like proteins are possibly translated from in‐frame alternative initiation sites within the PTEN mRNA 5′ leader. By the order of molecular weights of proteins following PTENα, the PTEN proteo‐form ranked fifth is designated as PTENε or PTEN5.
Figure 1. Identification of PTEN variants that may be generated by initiation at codons within the PTEN 5′UTR.
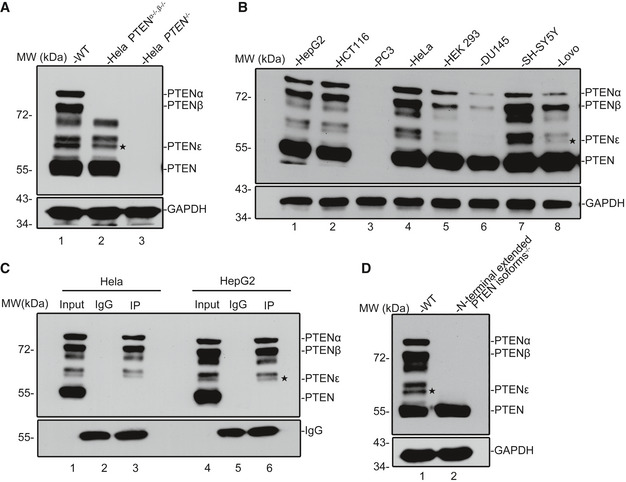
- Western blot of PTEN variants in WT (lane 1), PTENα−/−, β−/− (lane 2), and PTEN −/− (lane 3) Hela cells with a polyclonal antibody against full‐length PTEN. Except for PTENα, PTENβ, and canonical PTEN, immunoblotting revealed four additional bands with molecular weights lower than PTENβ in WT and PTEN α−/−, β−/− Hela cells. Hela PTEN −/− cells have no expression of PTEN variants or canonical PTEN. The asterisks shown here and in other immunoblot images throughout this manuscript indicate the corresponding protein band of PTENε.
- Western blot of PTEN variants in a panel of human cancer cell lines using a rabbit monoclonal antibody against the C‐terminal region of PTEN (Cell Signaling Technology, 138G6). The PTEN‐null prostate cancer cell line PC3 was used as a negative control.
- Immunoprecipitation of PTEN variants with a homemade PTENα antibody before immunoblotting with a PTEN monoclonal antibody in Hela and HepG2 cells (Cell Signaling Technology, 138G6).
- Western blot of PTEN variants in WT (lane 1) and N‐terminal extended PTEN isoforms−/− (lane 2) Hela cells with a PTEN monoclonal antibody (Cell Signaling Technology, 138G6).
Source data are available online for this figure.
Alternative initiation of PTENε translation from CUG816
To determine whether these unidentified PTEN proteo‐forms were N‐terminally extended variants initiated from codons within the 5′ UTR of human PTEN mRNA, a C‐terminal FLAG‐tagged plasmid carrying the coding sequence of PTENα or canonical PTEN was constructed (Fig 2A, upper panel). In addition to PTENα, PTENβ, and PTEN, immunoblots generated from transfected cell lysates and probed with FLAG antibody detected four distinct proteins with masses between 72 and 55 kDa in PTENα overexpressing panel, matching the bands of PTEN proteo‐forms in cancer cell lines detected by the PTEN monoclonal antibody (Fig 2A, lower panel, lane 3). Moreover, these overexpressed PTEN‐like proteins could be recognized by a PTEN monoclonal antibody (Appendix Fig S2). These results suggest that new ORFs within the 5′untranslated region of PTEN mRNA (between AUU594 and AUG1032) initiate the translation of PTENε and the other three unidentified proteins. We further analyzed the 5′ UTR of human PTEN mRNA, and a total of 18 non‐AUG alternative initiation codons in frame with the AUG1032 start codon were detected (Fig 2B). To identify the translation initiation site of PTENε, first, some triplets were mutated to UAG stop codons, which would terminate the translation from upstream initiation sites (Fig 2C). The mutation of AGA942 into a UAG triplet led to the disappearance of PTENε and the proteo‐forms with higher molecular weights, while the UCU783 > UAG mutation caused only premature termination of the proteo‐forms migrating slower than PTENε without affecting expression of PTENε, indicating that translation of PTENε initiates from a triplet between UCU783 and AGA942 (Fig 2D, lane 3 and lane 4 vs. lane 2). There are five evolutionarily conserved non‐AUG alternative initiation codons between UCU783 and AGA942, which could initiate translation of proteins of a similar size with PTENε. These potential non‐AUG codons (AGG810, CUG816, AAG831, CUG846, AAG936) were mutated separately to a non‐initiating CUC triplet to determine which is necessary for PTENε expression (Fig 2E). The anti‐FLAG immunoblotting of these transfected lysates reveals that mutation of CUG816 but not any other triplet abolishes the expression of PTENε (Fig 2F, lane 5 vs. other lanes). These results indicate that CUG816 is necessary for PTENε expression and that PTENε is probably translated from the CUG816 site of human PTEN mRNA 5′leader.
Figure 2. Alternative initiation of PTENε translation from CUG816 .
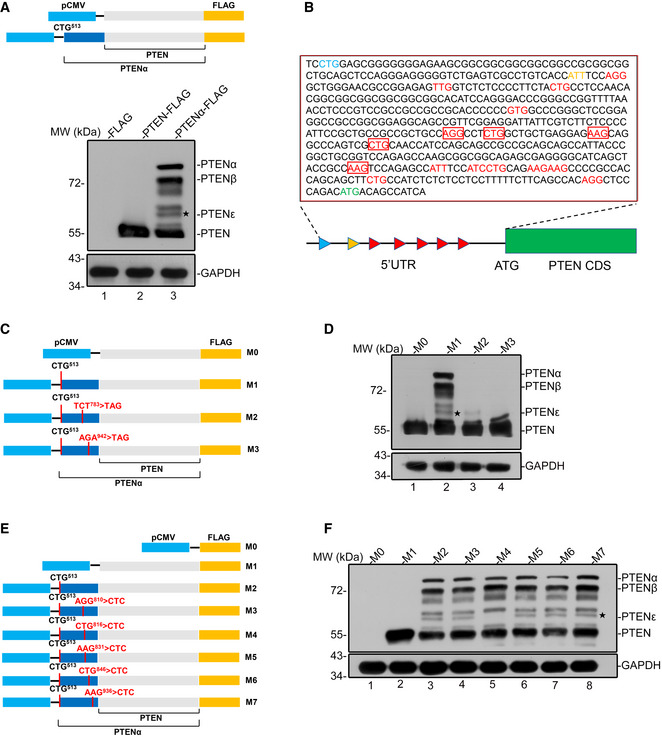
- A pcDNA3.1 plasmid containing PTENα or canonical PTEN with a C‐terminal FLAG tag was used for the detection of PTENα, PTENβ, canonical PTEN, and other unknown PTEN isoforms (upper panel); indicated plasmids in the upper panel were transfected into HEK293 cells followed by Western blotting analysis using FLAG antibody. GAPDH was used as a control (lower panel).
- The sequence of the 5′ UTR region of Homo sapiens PTEN mRNA. The codons that differ from AUG by only one nucleotide are highlighted in red. The initiation codons of PTENα, PTENβ, and canonical PTEN are separately highlighted in blue, yellow, and green. The potential initiation codons of PTENε are highlighted in red boxes.
- A different set of PTEN and PTENα constructs with a C‐terminal FLAG tag, in which one of two sites (UCU783 or AGA942) was mutated to a UAG stop codon.
- Mutation of AGA942 into UAG eliminates PTENε expression, while the UCU783 > UAG mutation has no such effect. C‐terminal FLAG‐tagged PTENα expression plasmids with and without UCU783 > UAG or AGA942 > UAG mutation as indicated in (C) were introduced into HEK293 cells separately, followed by immunoblotting with FLAG and GAPDH antibodies.
- A different set of PTENα constructs with a C‐terminal FLAG tag, in which one of the non‐AUG initiation codons between UCU783 and AGA942 (AGG810, CUG816, AAG831, CUG846, AAG936) was mutated to the CUC codon.
- Mutation of CUG816 but not any other potential non‐AUG initiation codon eliminates PTENε expression. C‐terminal FLAG‐tagged PTENα expression plasmids with or without mutations as indicated in (E) were introduced into HEK293 cells separately, followed by immunoblotting with FLAG and GAPDH antibodies.
Source data are available online for this figure.
Mass spectrometry analysis of the PTENε sequence
To validate the translation initiation site of PTENε, mass spectrometry was employed for peptide sequencing. The coding sequence of PTENα was cloned into a plasmid with a C‐terminal His‐tag, and the initiation codons of PTENα (CUG513) and PTENβ (AUU594) were mutated to CUC codons to abolish expression of PTENα and PTENβ, whereas an AUG1032 > AUA mutation was created to eliminate the initiation of canonical PTEN (Fig 3A). The plasmid mentioned above was introduced into Sf9 insect cells, respectively, and the protein expressed was purified. As expected, four protein bands matching unidentified PTEN isoforms were detected (Fig 3B, M2 lane), and the protein band ranked third by molecular weight was eliminated by a CUG816 > CUC mutation (Fig 3B, M1 lane), indicating it is PTENε. Five peptide fragments covering 94.4% of the N‐terminal region of PTENε (from CUG816 to AUG1032) were detected in the mascot reports of purified His‐PTENε (Fig 3B, right panel). Moreover, LC‐MS/MS also captured the most proximal N‐terminal peptide of PTENε, MAAEEKQAQSLQPSSSR (17 aa, MS/MS spectrum shown in Fig 3C). These mass spectrum data, therefore, verified that PTENε initiates at CUG816 within the PTEN mRNA 5′leader. Moreover, the translation initiation site of endogenous PTENε was further confirmed by mass spectrometric analysis of PTENε protein purified with an anti‐PTENα antibody from Hela cells (Fig EV1A).
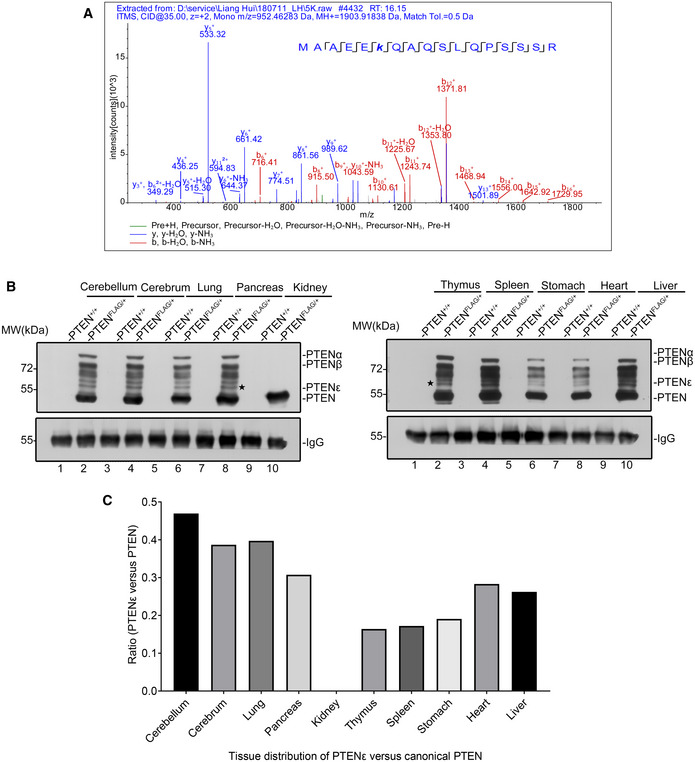
Figure 3. The PTENε translation initiation codon was identified by MALDI‐TOF mass spectrometry.
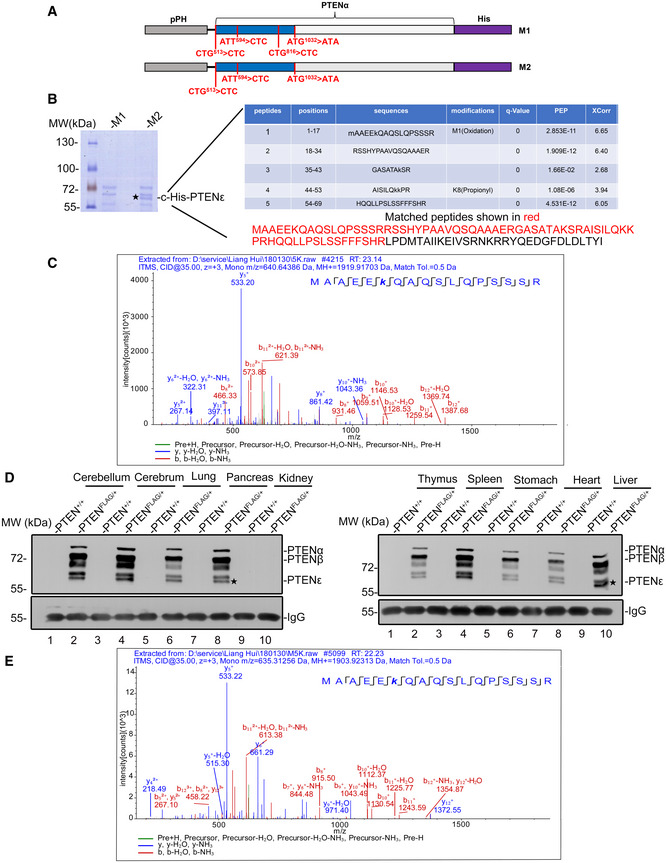
- Two pFastBac1 plasmids containing PTENα with a C‐terminal His‐tag with or without CUG816 > CUC mutation was used for in vitro purification and mass spectrometry sequencing. The initiation codon of canonical PTEN (AUG1032) was mutated to AUA and the initiation codons of PTENα (CUG513) and PTENβ (AUU594) were mutated to CUC to avoid co‐purification of PTEN, PTENα, and PTENβ with PTENε.
- His‐selected affinity purification of PTENε. Sf9‐expressed His‐PTENε was purified using nickel affinity chromatography. Combined fractions were separated by SDS–PAGE. The protein band ranked third by molecular weight in the M2 lane can be eliminated by the CUG816 > CUC mutation (M1 lane vs. M2 lane), indicating it is PTENε. Mass spectrometry analysis of the band of PTENε protein revealed five segments of peptide that match the N‐terminal extended sequence of PTENε, including the most proximal N‐terminal peptide of PTENε, MAAEEKQAQSLQPSSSR.
- The MS/MS spectrum of the peptide (MAAEEKQAQSLQPSSSR) that matches the N‐terminal sequence of PTENε.
- Verification of expression of FLAG‐tagged PTENα, PTENβ, and PTENε in PtenFLAG knock‐in mice. Various tissues from PtenFLAG knock‐in mice or control wild‐type mice were lysed for immunoprecipitation with anti‐FLAG M2 magnetic beads before being immunoblotted with the anti‐PTENα antibody raised in our laboratory.
- The MS/MS spectrum of the peptide (MAAEEKQAQSLQPSSSR) of endogenous PTENε in mice that matches the N‐terminal sequence of PTENε. Protein lysates of PtenFLAG knock‐in liver tissues were subjected to immunoprecipitation with anti‐FLAG M2 agarose. The bound proteins were separated with SDS–PAGE, and gel slices of the band ranked fifth by molecular weight were analyzed by mass spectrometry.
Source data are available online for this figure.
Figure EV1. The MS/MS spectrum of the peptide of endogenous PTENε in Hela cells that matches the N‐terminal sequence of PTENε.
-
AThe MS/MS spectrum of the peptide (MAAEEKQAQSLQPSSSR) of endogenous PTENε in Hela cells that matches the most N‐terminal sequence of PTENε. Protein lysates of Hela cells were subjected to sequential immunoprecipitation with the anti‐PTENα antibody. The bound proteins were separated with SDS–PAGE, and gel slices of the band ranked fifth by molecular weight were analyzed by mass spectrometry.
-
B, CDetection of the relative expression of PTEN isoforms vs. canonical PTEN in PtenFLAG knock‐in mice. Various tissues from PtenFLAG knock‐in mice or control wild‐type mice were lysed for immunoprecipitation with the anti‐FLAG M2 magnetic beads before immunoblotting with the anti‐PTEN antibody (B). The protein level of canonical PTEN and PTENε was measured by evaluating the gray value of corresponding protein bands in each panel (C).
Source data are available online for this figure.
Given that the alternative translation initiation site CUG816 and its adjacent nucleotide sequence critical for PTENε expression are highly homologous between Homo sapiens and Mus musculus (Appendix Fig S3), PTENε expression in mice may also be conserved. To test this possibility, tissue samples extracted from heterozygous PtenFLAG mice (Liang et al, 2014; Liang et al, 2017), in which a FLAG‐coding sequence was inserted into the C‐terminus of the Pten gene, were used for FLAG pull‐down followed by immunoblotting with a homemade anti‐PTENα antibody or a PTEN monoclonal antibody separately. In addition to PTENα and PTENβ, which were reported to be conserved expressed in mice (Liang et al, 2014; Liang et al, 2017), distinct protein bands of molecular weights lower than PTENβ that were similar to the bands discovered in multiple cancer cell lines were detected in the FLAG elute from PtenFLAG tissues but not in the wild‐type tissues (Figs 3D and EV1B). Moreover, mass spectrometric analysis of the FLAG elutes from PtenFLAG tissues detected the most proximal N‐terminal peptide of PTENε, MAAEEKQAQSLQPSSSR (Fig 3E), which further confirms the in vivo existence of PTENε in mice. We also compared relative expression of PTENε vs. canonical PTEN in different tissues and found that PTENε is highly expressed in the nervous system such as the cerebellum and cerebrum (Fig EV1B and 1C). This PtenFLAG knock‐in mice model demonstrates that the translation of PTENε arises from the natural occurrence of alternative initiation within the 5′leader of PTEN mRNA. Generally, these results verify the existence of PTENε in vivo and confirm that the expression of PTENε is conserved in different species.
EIF2A is critical for expression of CUG816 initiated PTENε
Alterations in eIFs stoichiometry are known to influence start codon recognition patterns, which can lead to shifts in the relative amounts of AUG vs. non‐AUG initiation, although the exact mechanism is unknown (Kearse & Wilusz, 2017). It was reported that overexpression of eIF5 results in more initiation at the CUG codon and less at the AUG codon (Kearse & Wilusz, 2017; Tang et al, 2017). Moreover, it is known that eIF2A is crucial for Leu‐tRNA initiation at CUG start codons and other non‐AUG codons such as UUG (Liang et al, 2014; Starck et al, 2016; Sendoel et al, 2017). To determine the effect of these eIFs on CUG initiated PTENε, we first examined expression of eIF5 and eIF2A in a panel of cancer cell lines as listed in Fig 1B. The correlation analysis between eIF2A or eIF5 and PTENε revealed that the level of eIF2A transcripts and protein positively correlated with PTENε protein, whereas no obvious relationship was observed between eIF5 transcripts and PTENε, suggesting that eIF2A is related to PTENε synthesis (Fig 4A, upper panel vs. lower panel and Fig EV2A). Furthermore, we examined the PTENε expression level in eIF2A or eIF5 overexpression or knockdown cells separately (Fig 4B and C). The expression status of eIF5 does not affect PTENε expression (Fig 4B and C, right panel). While overexpression of eIF2A significantly increases PTENε expression, PTENε expression is downregulated markedly in eIF2A knockdown cells (Fig 4B and C, right panel lane 2 and/or 3 vs. lane1), and the reduction of PTENε can be compensated by overexpression of exogenous eIF2A (Fig EV2B). These results highlight the importance of eIF2A status for CUG initiated PTENε expression. Noteworthy, besides PTENε, the expression of PTENα, PTENβ, and other unidentified PTEN isoforms was also positively correlated with eIF2A status (Fig 4B and C), while eIF2A plays a repressive effect on the expression of canonical PTEN (Fig EV2C). We also linked the 5'UTR of PTEN with luciferase reporter to testify the influence of eIF2A alteration on translation of distinct isoforms initiated by specific upstream codons. As shown in Fig EV2D, overexpression of eIF2A promotes translation of PTENα, PTENβ, and PTENε, respectively, further indicating that eIF2A modulates expression of CUG816 initiated PTENε as well as other two known isoforms PTENα and PTENβ. Together, these data indicate that PTENε synthesis is closely regulated by the eIF2A‐dependent mechanism.
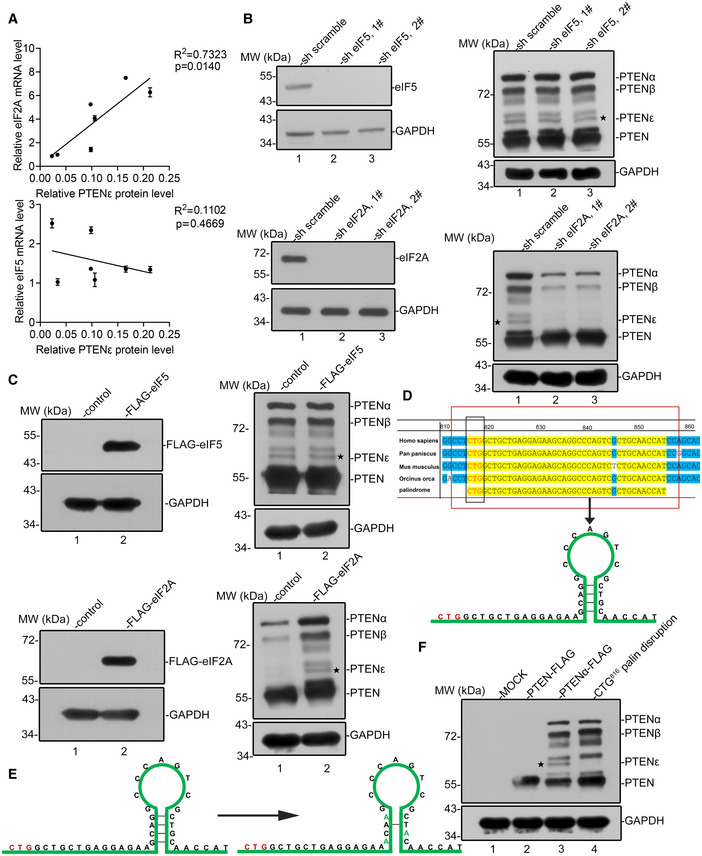
Figure 4. EIF2A is critical for non‐AUG initiation of PTEN isoforms.
-
ACorrelation analysis of PTENε protein level with eIF2A or eIF5 mRNA level. The mRNA level of eIF2A and eIF5 in cell lines as listed in Fig 1B was measured by RT–PCR. PTENε protein level in cell lines listed in Fig 1B was measured by evaluating the gray value of corresponding protein bands. PTENε protein level is positively correlated with the eIF2A mRNA level (P < 0.05), while it has no significant correlation with the eIF5 mRNA level (P > 0.05). The Pearson correlation test was employed to analysis the correlation between PTENε and eIF2A or eIF5, and data are presented as the mean ± SD based on three independent experiments.
-
BReduction of PTENε in response to eIF2A knockdown. Hela cells were infected with lentivirus expressing eIF2A shRNA, eIF5 shRNA, or scramble shRNA separately. The knockdown of eIF2A or eIF5 was validated by Western blot (left panel). Lysates of Hela cells were collected and subjected to Western blot analysis with antibodies against PTEN and GAPDH (right panel).
-
COverexpression of eIF2A induces the relative expression of PTENε. FLAG‐tagged eIF2A or eIF5 were overexpressed in DU145 cells before Western blot analysis of PTENε expression with an antibody against PTEN. GAPDH was used as a loading control.
-
DA palindromic motif 14 bp downstream CUG816 in the 5′UTR of PTEN is evolutionarily conserved. (upper panel) Phylogenetic analysis of the 5′UTR of PTEN mRNA in bonobo (Pan paniscus), killer whale (Orcinus orca), and mouse (Mus musculus). The CUG816 initiation codon of PTENε is highlighted in a blue box, and the 14 bp downstream palindromic sequence is highlighted in a red box. The putative hairpin structure shown in the lower panel was predicted by the Mfold web server.
-
E, FAbolition of PTENε expression by disruption of the palindromic motif. (E) Disruption of the CUG816 downstream palindromic motif by mutagenesis. C‐terminal FLAG‐tagged PTENε expression plasmids with or without disruption of the palindromic motif were introduced into HEK293 cells, followed by immunoblotting with FLAG and GAPDH antibodies (F).
Source data are available online for this figure.
Figure EV2. The endogenous expression of PTENε is regulated by eIF2A.
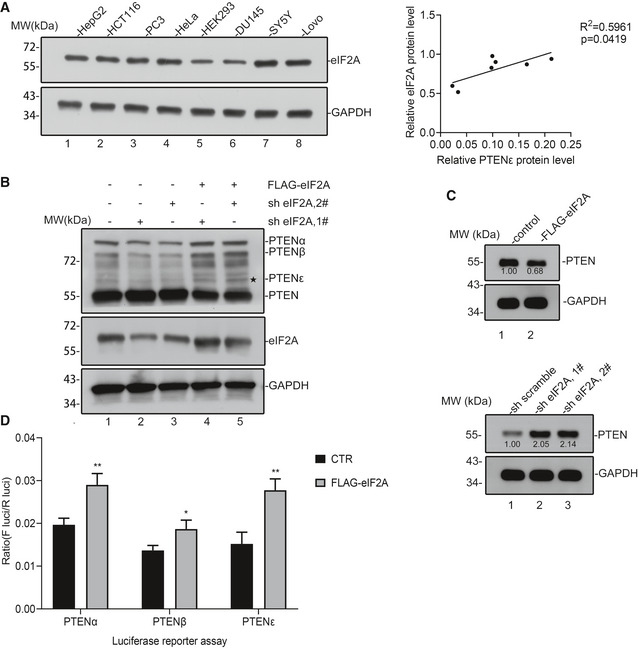
- Correlation analysis of PTENε protein with endogenous eIF2A protein. The eIF2A protein level in cell lines as listed in Fig 1B was measured by evaluating the gray value of relevant protein bands. Pearson’s correlation test was utilized to perform the correlation analysis between endogenous eIF2A and PTENε through the GraphPad Prism 8 software.
- Reduced expression of PTENε in eIF2A knockdown Hela cells was rescued by eIF2A reintroduction. Wild‐type FLAG‐eIF2A was reintroduced into eIF2A knockdown cells used in Fig 4B, and the lysates of these Hela cells were collected and subjected to Western blot analysis with antibodies against PTEN, eIF2A, and GAPDH.
- The influence of eIF2A alteration on canonical PTEN expression. The relative expression of canonical PTEN in eIF2A overexpression or knockdown cells was quantified by Western blot. PTEN protein level in the aforementioned cells was measured by evaluating the gray value of corresponding protein bands. GAPDH was used as the negative control.
- Luciferase reporter activity driven by PTEN variants after eIF2A overexpression. HEK293 cells were co‐transfected with pCMV‐tag2b‐eIF2A or pCMV‐basic plasmid and Luc2‐IRES‐Report plasmids (GS0112, GENESEED Biotech Co.) carrying the specific N‐terminal extended nucleotide of corresponding PTEN isoforms compared with canonical PTEN. Luciferase activity was measured 24 h after transfection. All data are presented as mean ± SD of three independent experiments and were analyzed with the unpaired t‐test. *P < 0.05; **P < 0.01.
Source data are available online for this figure.
The ability of mammalian ribosomes to initiate at non‐AUG codons is usually inefficient and can be facilitated by the presence of a stem‐loop structure downstream of the alternative initiation codon (Diaz de Arce et al, 2018). We have previously reported that a palindromic sequence downstream of AUU594 is critical for translation initiation of PTENβ (Liang et al, 2017). To explore whether PTENε expression is modulated by the sequence or the secondary structure flanking the CUG816 initiation site, we evaluated the sequence feature surrounding CUG816 and identified a hairpin structure starting 14 bp immediately downstream of CUG816 by using the Mfold web server (Zuker, 2003) (Fig 4D). To access the influence of this palindromic sequence on the initiation efficiency of the preceding CUG816 codon, we disrupted this hairpin by point mutation and examined PTENε expression (Fig 4E). As shown in Fig 4F, the expression of PTENε decreased markedly upon disrupting the palindromic structure 14 bp downstream of CUG816, indicating that the translation initiation of PTENε is reliant on this secondary structure (lane 4 vs. lane 3).
PTENε is localized predominantly in the cell plasma membrane
The initiation from upstream non‐AUG codons frequently generates isoforms harboring signals for subcellular localization (Coldwell et al, 2004). Consistently, we previously reported that the N‐terminal extended PTENα and PTENβ isoforms are endowed with the capability for special subcellular localization differing from canonical PTEN (Liang et al, 2014; Liang et al, 2017). Given that the N‐terminal extension of newly identified PTENε is different from any other PTEN isoform, it may thus have distinctive subcellular distribution and molecular functions compared with other known PTEN variants. To investigate this possibility, we constructed a set of plasmids expressing C‐terminal GFP‐tagged PTENε, PTENα, PTENβ, or canonical PTEN, in which the initiation codon for corresponding PTEN isoform was mutated to AUG to enhance respect expression and we also introduced an AUG1032 > AUA mutation in GFP‐tagged PTENε, PTENα, and PTENβ constructs to guarantee that only a single isoform was expressed in each instance (Fig 5A and Appendix Fig S4A). The subcellular localization of PTENε was distinct from that of canonical PTEN, PTENα, and PTENβ. Consistent with our previous observations, the immunofluorescence signal of PTENα or PTENβ was mainly detected in the cytoplasm or the nucleolus, respectively, while canonical PTEN showed ubiquitous subcellular localization in both nucleus and cytoplasm. In contrast, fluorescence signals of PTENε were abundantly distributed in the periphery of cells, which seems to be the cell membrane (Fig 5B). To further confirm the localization of PTENε on the cell membrane, we evaluated the co‐localization of C‐terminal GFP‐tagged PTENε with β‐catenin, a multifunctional protein mainly distributed in the cell membrane (Fig 5C). Also, to exclude the influence of GFP tag on protein localization, PTENε expression plasmid without a tag was constructed by introducing a UAG stop codon in front of the GFP initiation site (Appendix Fig S4B), and similar immunofluorescence signals with PTEN monoclonal antibody were detected in PTEN‐null cells, revealing that untagged PTENε presents similar or identical subcellular distribution patterns with the GFP‐tagged PTENε (Appendix Fig S4C). Besides, the extensive membrane distribution of PTENε was further validated through cell fractionation analysis (Fig 5D).
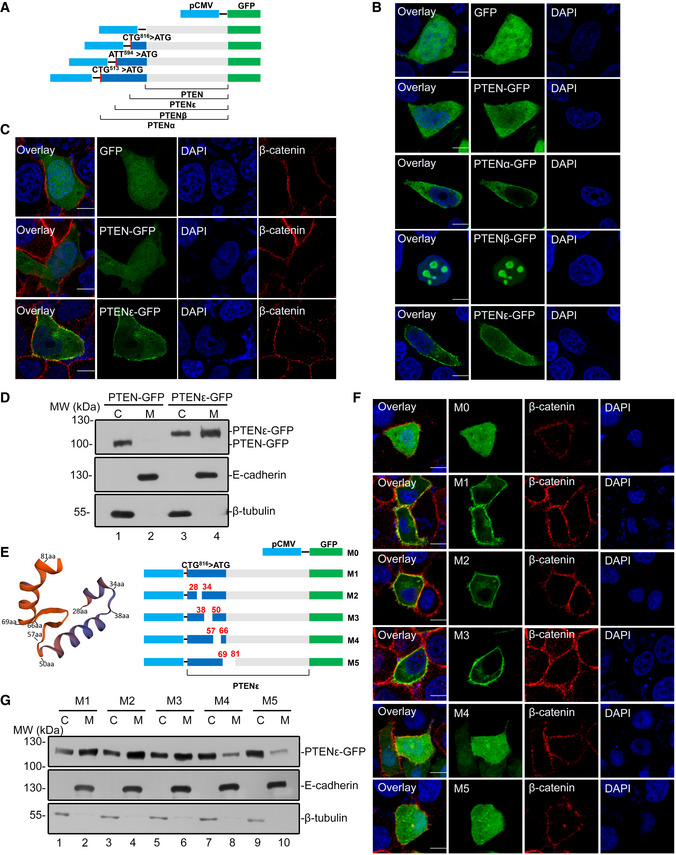
Figure 5. PTENε is localized predominantly in the cell membrane.
-
AA set of different constructs of PTEN, PTENα, PTENβ, and PTENε with a C‐terminal GFP tag. The AUG start codon of canonical PTEN was mutated to AUA in PTENα, PTENβ, and PTENε constructs to abolish the expression of canonical PTEN and the corresponding start site of these PTEN isoforms was mutated into AUG to enhance their expression.
-
BSubcellular localization of C‐terminal GFP‐tagged PTENα, PTENβ, PTENε, and PTEN. The constructs indicated in the data (A) were introduced into Hela PTEN −/− cells. Thirty‐six hours after transfection, cells were stained with DAPI, followed by imaging with confocal microscopy. The scale bars represent 5 μm.
-
CThe transfected Hela PTEN −/− cells in (B) were stained with an anti‐β‐catenin antibody and DAPI before being imaged with confocal microscopy. The scale bars represent 5 μm.
-
DHEK293 cells were transfected with C‐terminal GFP‐tagged PTEN and PTENε and subjected to cell fractionation, followed by Western blotting with GFP, E‐cadherin, and β‐tubulin antibodies. C: cytoplasm. M: cell plasma membrane.
-
EPrediction of N‐terminal structure of PTENε by SWISS‐MODEL (left panel); a different set of C‐terminal GFP‐tagged PTENε plasmids with or without fragment deletion in PTENε N‐terminal sequence were constructed.
-
F, GTo determine the sequences that are critical for the membrane localization of PTENε. Hela and HEK293 cells were transfected with constructs indicated in (E). Thirty‐six hours after transfection, transfected Hela cells were stained with anti‐β‐catenin antibody and DAPI, followed by imaging with confocal microscopy. The scale bars represent 5 μm (F). The transfected HEK293 cells were conducted with cell fractionation before Western blotting with GFP, E‐cadherin, and β‐tubulin antibodies (G). C: cytoplasm. M: cell plasma membrane.
Source data are available online for this figure.
PTENε protein differs from PTENα, PTENβ, and PTEN in length due to its N‐terminal extension, raising the possibility that PTENε may have a specific N‐terminal structure that results in its unique subcellular distribution. We used SWISS‐MODEL to predict the structure of PTENε by analyzing its N‐terminal amino acid sequence, and protein structure modeling reveals that the residues 28–34, 38–50, and 69–81 of the N terminals of PTENε may be folded and form three α‐helixes, respectively, while the residues 57–66 may form a β‐sheet (Fig 5E, left panel). To investigate whether these structure elements direct PTENε membrane localization, we established a series of constructs in which these secondary structure sequences were deleted separately by mutations (Fig 5E, right panel). As shown in Fig 5F and G, the deletion of the residues 57–66 and 69–81 greatly reduced the membrane localization of PTENε, whereas other mutations had no such effect, indicating that these two fragments of PTENε sequences are critical for its membrane localization.
PTENε interacts with and dephosphorylates pseudopod formation‐related proteins
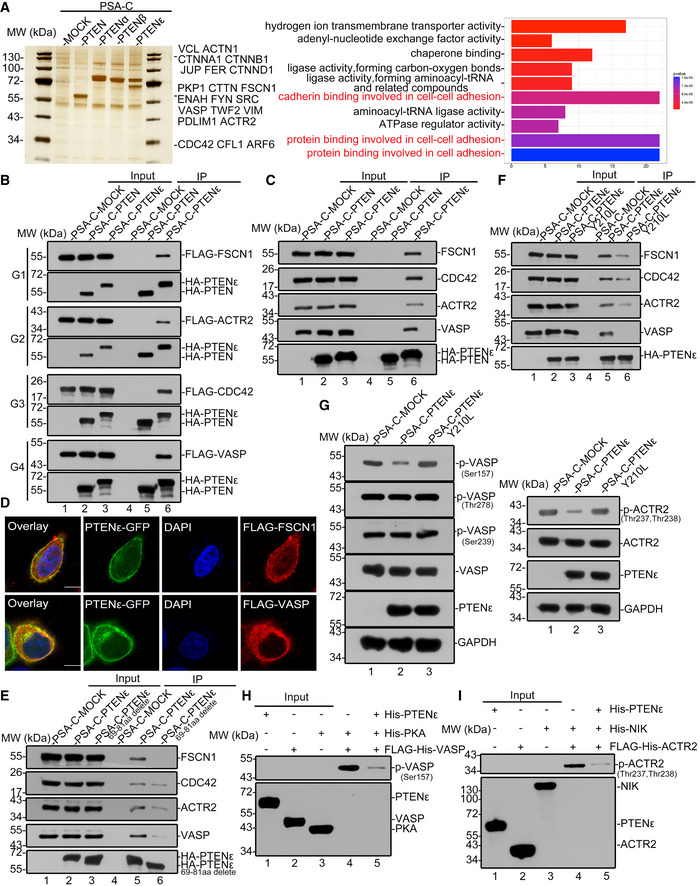
Given the fact that the N‐terminal sequences of PTENα and PTENβ harbor multiple subcellular location signals and protein interaction sites, we hypothesize that the N‐terminal sequence of this newly identified PTEN isoform renders PTENε unique biological functions compared with canonical PTEN. To identify potential PTENε targets and investigate possible molecular functions of PTENε in the membrane, we performed S‐tag‐PTENε pull‐down assay coupled with mass spectrometry to capture potential interacting partners of PTENε. Results with S‐tag‐PTEN, S‐tag‐PTENα, and S‐tag‐PTENβ were analyzed, respectively, as controls. Mass spectrometry demonstrated that PTENε specifically associates with a lot of membrane or membrane‐associated proteins, including considerable critical proteins involved in cell migration regulation, which were considered to be potential PTENε targets (Fig 6A, right panel). To validate their interaction with PTENε, a total of 23 candidate genes were cloned as listed in Fig 6A (left panel). Immunoprecipitation with overexpressed proteins demonstrates that PTENε physically interacts with VASP, FSCN1, CDC42, and ACTR2, respectively, key proteins involved in filopodia formation, whereas canonical PTEN does not interact with these proteins (Fig 6B, lane 6 vs. lane 5), and these interactions were further confirmed through immunoprecipitation with endogenous PTENε target proteins (Fig 6C). We also detected that neither PTENα nor PTENβ, two known variants of PTEN, interacts with these four filopodia formation‐related proteins, which indicates that these proteins were potential specific targets of PTENε (Fig EV3A). Also, immunofluorescence reveals that PTENε partially colocalizes with these partners in the cell membrane (Figs 6D and EV3B, and Appendix Fig S5), further confirming the interaction of PTENε with these membrane‐localized proteins. As PTENε is mainly distributed in the cell membrane, we next examined whether the membrane localization of PTENε is required for its interaction with the aforementioned proteins. As shown in Fig 6E (lane 6 vs. lane 5), membrane localization abolishment by mutations greatly reduces PTENε’s interaction with VASP, Fascin, CDC42, and ACTR2, suggesting that the membrane distribution of PTENε is critical for its substrates binding and function execution. These PTENε partners VASP, Fascin, CDC42, and ACTR2 are all involved in the formation of pseudopods, which is essential for cell migration (Mattila & Lappalainen, 2008), suggesting that PTENε may participate in cell motion regulation through the corresponding pathways.
Figure 6. PTENε interacts with and dephosphorylates filopodia formation‐related proteins.
-
AIn vivo S‐tag‐PTENε pull‐down analysis. Whole‐cell extracts from HEK293 cells transfected with S‐tag‐PTENε were immunoprecipitated with S‐protein beads followed by mass spectrometric peptide sequencing. S‐tagged‐PTEN, S‐tagged‐PTENα, S‐tagged‐PTENβ, or mock construct were introduced into HEK293 cells separately, and the transfected cells were treated in the same way as described above. Cell adhesion associated protein was found in the PTENε pull‐down list (left panel). Molecular function analysis of PTENε interacting proteins compared with canonical PTEN, PTENα, PTENβ, and MOCK groups (right panel, statistical significance was determined by Fisher’s exact test.). Mass spectrometry analysis data (as indicated in Figs 3C and E, and EV1A, and 6A) are available via ProteomeXchange with identifier PXD022245.
-
BExogenous immunoprecipitation of PTENε with FLAG‐tagged CDC42, ACTR2, VASP, and FSCN1. The plasmid expressing PTEN, PTENε, or mock carrying C‐terminal S‐tag and HA tag was co‐transfected with FLAG‐tagged CDC42, ACTR2, VASP, or FSCN1 plasmid in HEK293 cells separately. Cell lysates were incubated with S‐protein agarose followed by Western blotting with antibodies against the FLAG tag and HA tag. G1–4 stand for immunoprecipitation group 1–4.
-
CImmunoprecipitation of PTENε with endogenous CDC42, ACTR2, VASP, and FSCN1. The plasmid expressing PTEN, PTENε, or mock plasmid carrying C‐terminal S‐tag and HA tag was transfected in HEK293 cells separately. Cell lysates were incubated with S‐protein agarose followed by Western blotting with antibodies against CDC42, VASP, ACTR2, FSCN1, and HA tag.
-
DImages of immunofluorescence staining for PTENε and its interacting proteins (VASP and FSCN1). Hela PTEN −/− cells were co‐transfected by a plasmid expressing C‐terminal GFP‐tagged PTENε with FLAG‐tagged targets (FSCN1, VASP) separately, followed by staining with an anti‐FLAG antibody and DAPI, and were imaged by confocal microscopy. The scale bars represent 5 μm.
-
EThe cell plasma membrane localization of PTENε is required for its interaction with downstream targets. FLAG‐tagged CDC42, VASP, ACTR2, or FSCN1 plasmid was co‐transfected with a plasmid expressing PTENε with or without 69–81aa deletion carrying C‐terminal S‐tag and HA tag in HEK293 cells. Cell lysates were incubated with S‐protein agarose before Western blotting with antibodies against the FLAG tag and HA tag.
-
FPTENε protein phosphatase activity is required for its interaction with CDC42, FSCN1, VASP, and ACTR2. Wild‐type PTENε and PTENε with protein phosphatase activity abolished mutation (Y210L, analogous to PTEN (Y138L)) were separately co‐transfected with FLAG‐tagged targets (CDC42, FSCN1, ACTR2 or VASP) in HEK293 cells. Cell lysates were incubated with S‐protein agarose followed by Western blotting with antibodies against the FLAG tag and HA tag.
-
GThe level of phospho‐VASP and phospho‐ACTR2 in PTENε overexpressed Hela cells. Wild‐type PTENε and PTENε with protein phosphatase activity abolished mutation (Y210L, analogous to PTEN (Y138L)) carrying C‐terminal S‐tag and HA tag were introduced into Hela PTEN −/− cells, followed by immunoblotting with antibodies against p‐ACTR2 (Thr237 and Thr238), p‐VASP(Ser157), p‐VASP (Ser239), p‐VASP (Thr278), VASP, ACTR2, GAPDH, and HA tag.
-
H, IPurified ACTR2 or VASP was phosphorylated in vitro by NIK or PKA and subsequently used in a phosphatase assay with His‐PTENε or without purified PTENε protein as a control, followed by immunoblotting with antibodies against p‐ACTR2 (Thr237 and Thr238) and p‐VASP (Ser157). Purified proteins (PTENε, PKA, NIK, ACTR2, and VASP) were detected by anti‐His antibody (ZSGB‐BIO, TA‐02).
Source data are available online for this figure.
Figure EV3. PTENε, but not other known PTEN isoforms, dephosphorylates ACTR2 and VASP by its protein phosphatase activity.
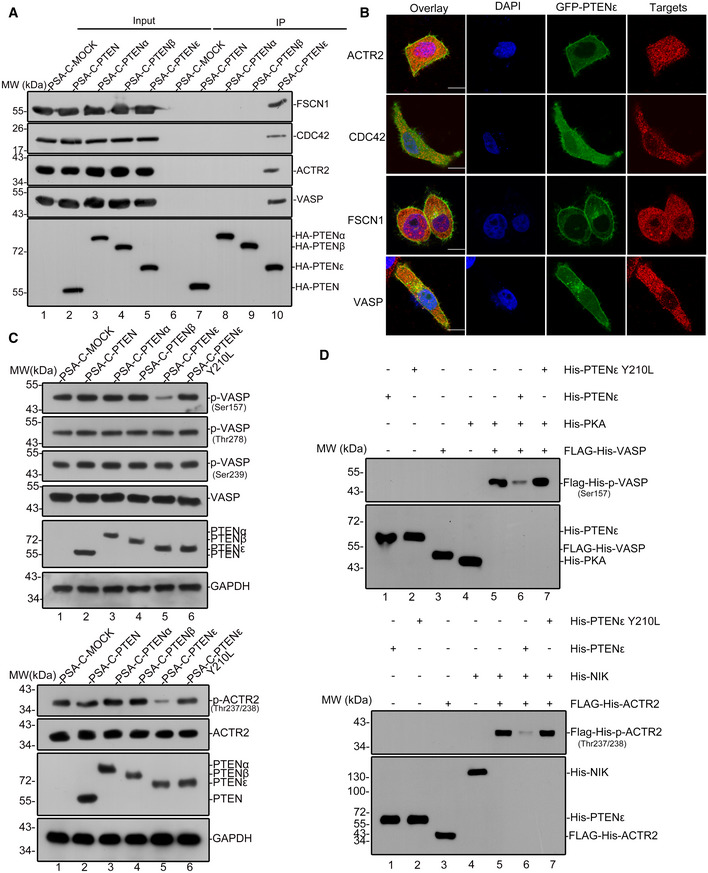
- PTENε, but not other known PTEN isoforms, interacts with filopodia formation‐related proteins. HEK293 cells were transfected with C‐terminal HA and S‐tagged PTEN, PTENα, PTENβ, PTENε, or mock plasmid separately, followed by immunoprecipitation with S‐protein beads and Western blotting with antibodies against CDC42, VASP, ACTR2, or FSCN1, and HA, respectively.
- Images of immunofluorescence staining for PTENε and endogenous interacting proteins (VASP, FSCN1, CDC42, and ACTR2). C‐terminal GFP‐tagged PTENε was introduced into Hela PTEN −/− cells. Then, these transfected cells were seeded on coverslips and sequentially stained with monoclonal antibodies (Santa Cruz, sc‐8401(CDC42), sc‐21743(FSCN1), sc‐166103(ACTR2), and Cell Signaling Technology, 3132(VASP)) and DAPI separately. Then, all the coverslips were imaged by confocal microscopy. The scale bars represent 5 μm.
- Overexpression of PTENε, but not other PTEN variants, reduces the endogenous phosphorylation of ACTR2 (lower panel) and VASP (upper panel). HA and S‐tagged canonical PTEN, PTENα, PTENβ, PTENε, and PTENε Y210L were introduced into Hela PTEN −/− cells, followed by immunoblotting with antibodies against p‐ACTR2 (Thr237 and Thr238), p‐VASP(Ser157), p‐VASP (Ser239), p‐VASP (Thr278), VASP, ACTR2, GAPDH, and HA tag.
- Purified ACTR2 or VASP was phosphorylated in vitro by NIK or PKA and subsequently used in a phosphatase assay with wild‐type His‐PTENε, protein phosphatase‐deficient His‐PTENε Y210L or without purified PTENε protein as a control, followed by immunoblotting with antibodies against p‐ACTR2 (Thr237 and Thr238, lower panel) and p‐VASP (Ser157, upper panel). Purified proteins (PTENε, PTENε Y210L, PKA, NIK, ACTR2, and VASP) were detected by anti‐His antibody (ZSGB‐BIO, TA‐02).
Source data are available online for this figure.
Because PTENε contains the entire phosphatase domain detected in canonical PTEN, we first examined its effect on the PI3K/AKT pathway by evaluating the level of phosphorylated AKT in the presence or absence of related proteins. As shown in Appendix Fig S6A and B, exogenously overexpressed PTENε, PTENα, PTENβ, or canonical PTEN in Hela PTEN −/− cells all effectually decreases the phosphorylation of AKT, demonstrating that PTENε can act as a phosphatase as canonical PTEN. Moreover, we found that the affinity for substrates binding of PTENε depends on its protein phosphatase activity to varying degrees. The physical interaction of PTENε with VASP or ACTR2 was almost abolished in phosphatase activity‐deficient PTENε mutant group (Y210L, analogous to PTEN (Y138L)), while the interaction between PTENε and FSCN1 and CDC42 was also reduced after PTENε protein phosphatase abolishment, but to a much lower extent (Fig 6F, lane 6 vs. lane 5), indicating that PTENε protein phosphatase activity is critical for its association with these substrates and that PTENε may act as phosphatase of these substrates, particularly of VASP and ACTR2, and influence their functions. VASP is an actin‐binding protein that regulates cell shape and polarity through the F‐actin cytoskeleton, whose activity is controlled by phosphorylation at Ser157, Ser239, and Thr278 (Butt et al, 1994; Gertler et al, 1996; Lambrechts et al, 2000; Blume et al, 2007). Specifically, the cAMP‐dependent phosphorylation at Ser157 promotes F‐actin‐shaped membrane protrusions, including filopodia, whereas the cGMP‐dependent phosphorylation at Ser239 and Thr278 induces dissociation of VASP/actin complexes and inhibition of locomotory membrane structures (Ali et al, 2015). Actin filament assembly controlled by the actin‐related protein ARP2/3 complex is necessary to build membrane protrusions and phosphorylation at ACTR2 Thr237 and Thr238 are essential for ARP2/3 complex activation (LeClaire et al, 2008). We found that exogenously overexpressed wild‐type PTENε but not protein phosphatase activity‐deficient PTENε mutant efficaciously reduced the VASP phosphorylation at Ser157 and ACTR2 phosphorylation at Thr237 and Thr238 sites, whereas the VASP Ser239 and Thr278 phosphorylation levels were unaffected (Fig 6G). Meanwhile, no obvious alteration in corresponding phosphorylation sites of VASP and ACTR2 was detected in cells overexpressing other PTEN variants (Fig EV3C), suggesting that PTENε but no other PTEN isoforms or canonical PTEN specifically acts as VASP and ACTR2 phosphatase. In vitro dephosphorylation assays further proofed that PKA‐phosphorylated VASP Ser157 and NIK‐phosphorylated ACTR2 Thr237 and Thr238 sites are dephosphorylated by wild‐type PTENε (Fig 6H and I), but not the protein phosphatase abolished PTENε Y210L mutant (Fig EV3D). These results reveal that PTENε acts as the phosphatase of VASP and ACTR2 and suggest that PTENε may be involved in filopodia formation modulation by dephosphorylating VASP and ACTR2 through its protein phosphatase activity.
PTENε suppresses aggressiveness of cancer cells
It is well known that VASP, ACTR2, FSCN1, and CDC42 are key proteins involved in filopodia formation, in which the phosphorylation status of these proteins is precisely regulated (Mattila & Lappalainen, 2008). Our results that PTENε physically associates with and dephosphorylates VASP and ACTR2 at pivotal sites influencing their function indicate that PTENε may control filopodia formation by dephosphorylating these proteins.
To evaluate the function of PTENε, we established a somatic PTEN knockout Hela cell line through the CRISPR‐Cas9 approach, in which a UAG stop codon generated immediately downstream of the AUG start codon of canonical PTEN due to frameshift mutation terminates translation from upstream initiation sites, leading to the abolishment of N‐terminal extended PTEN isoforms and canonical PTEN (Fig 1A, lane3, and Appendix Fig S1C). Hela PTEN −/− cells and the PTEN‐null H4 human neuroglioma cell line were used to dissect the function of PTENε in the regulation of cell motility. The aforementioned cells were infected by lentiviral‐PTENε or lentiviral‐PTENε Y210L, respectively, and stable transfectants were established (Appendix Fig S7A and B). We first evaluated the effect of PTENε on filopodia formation. As shown in Fig 7A and B, overexpression of wild‐type PTENε in Hela PTEN −/− cells led to a sharp decrease of filopodia number, compared with control cells, while overexpression of PTENε Y210L had no such effect. These results show that PTENε is involved in filopodia formation regulation which is reliant on its protein phosphatase activity. As PTENε membrane localization participates in promoting the physical interaction between PTENε and filopodia formation‐related proteins, we also detected whether the disruption of PTENε’s membrane localization alters filopodia formation in Hela cells. It turns out that although the overexpression of wild‐type PTENε greatly reduces the number of filopodia in the cell membrane, the membrane localization abolishment panel shows no difference with the mock group in filopodia formation, suggesting that membrane distribution of PTENε is likewise critical for its function in suppressing filopodia formation (Fig EV4A and B).
Figure 7. PTENε suppresses the aggressiveness of cancer cells.
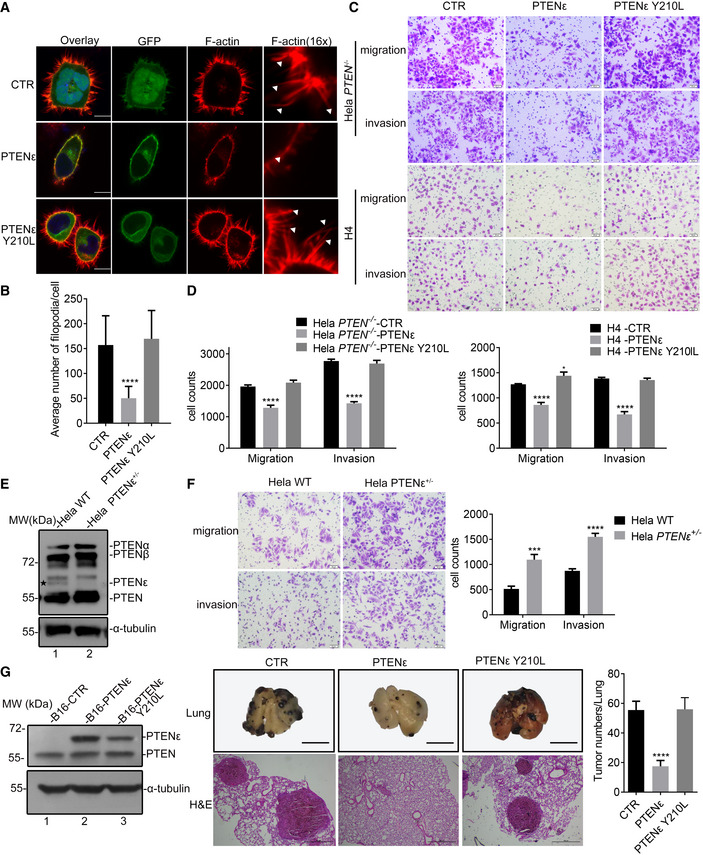
- Immunofluorescence staining of F‐actin in PTENε or PTENε Y210L overexpressed Hela PTEN −/− cells and control cells. PTENε‐GFP, PTENε Y210L‐GFP, or mock construct was introduced into HeLa PTEN −/− cells, respectively. The transfected cells were stained with Phalloidin and DAPI before being imaged with confocal microscopy. The scale bars represent 5 μm (left panel). White arrows shown in the magnified immunofluorescence images indicate the filopodia in the cell membrane.
- Quantification of the number of filopodia per cell by FiloQuant software and the data are presented as mean ± SD of three independent experiments and were analyzed with the unpaired t‐test. ****P < 0.0001.
- Representative images of transwell migration and invasion assays in Hela PTEN −/− cells and H4 cells stably transfected with PTENε, PTENε Y210L, or an empty control (magnification, 200×). The scale bars represent 50 μm.
- Statistical analysis of transwell migration and invasion assays in Hela PTEN −/− cells and H4 cells stably transfected with PTENε, PTENε Y210L, or an empty control (magnification, 100×; five random per well). Data are presented as the mean ± SEM based on three independent experiments and were analyzed with the unpaired t‐test. *P < 0.05. ****P < 0.0001.
- Adenine base editing‐mediated endogenous PTENε knockout in Hela cells. Immunoblotting analyses were used to verify the level of PTENε loss in Hela cells.
- Representative images of transwell migration and invasion assays in Hela PTENε+/− cells at 200× magnification (left panel, the scale bars represent 50 μm). (right panel) Migrated or invaded cells were counted at five random fields at 100× magnification per well to assess cell migration and invasion ability. Data are presented as the mean ± SEM based on three independent experiments and were analyzed with the unpaired t‐test. ***P < 0.001; ****P < 0.0001.
- Left panel: Immunoblotting analyses were used to verify the level of overexpressed PTENε or PTENε Y210L in B16 cells. Middle panel: Representative images showing the lung metastasis of PTENε or PTENε Y210L overexpressed B16 cells or control cells in the mouse pulmonary metastasis model (n = 4). H & E, hematoxylin–eosin staining. The scale bars represent 600 mm (upper panel) and 500 μm (lower panel) separately. Right panel: The representative bar graphs showing the quantification of tumor metastatic ability was displayed by measuring the number of tumor nodules (data are presented as mean ± SD based on three independent replicates). The overexpression of PTENε attenuated tumor metastatic ability compared with the vector control group. ****P < 0.0001 in the unpaired t‐test.
Source data are available online for this figure.
Figure EV4. PTENε plays a critical role in suppressing filopodia formation.
-
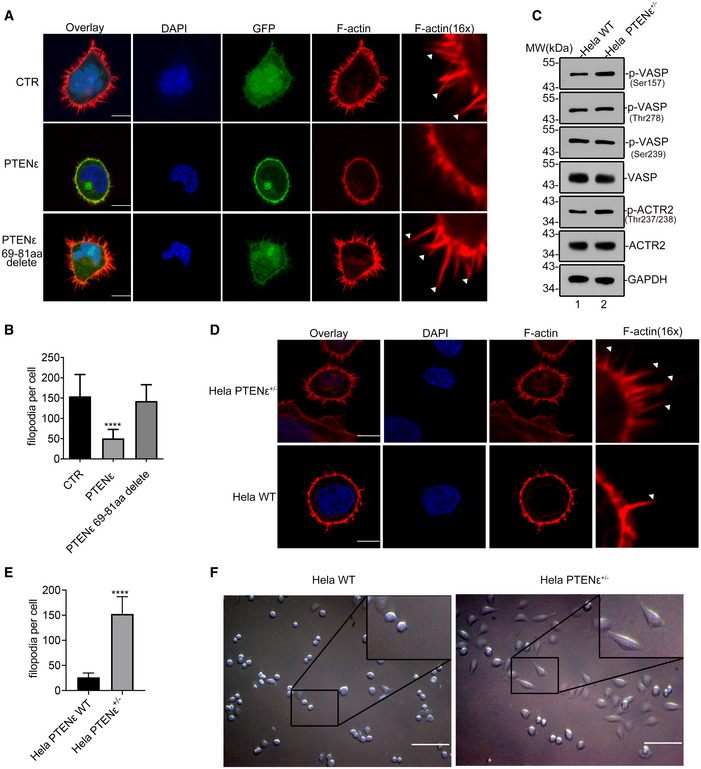
AImmunofluorescence staining of F‐actin in wild‐type PTENε or mutant PTENε overexpressed Hela PTEN −/− cells and control cells. PTENε‐GFP, PTENε 69–81aa delete‐GFP, or mock construct was introduced into Hela PTEN −/− cells. The transfected cells were stained with Phalloidin and DAPI before being imaged with confocal microscopy. The scale bars represent 5 μm (left panel). White arrows shown in the magnified immunofluorescence images indicate the filopodia in the cell membrane.
-
BQuantification of the number of filopodia per cell by FiloQuant software. The data are presented as mean ± SD of three independent experiments and were analyzed with the unpaired t‐test. ****P < 0.0001.
-
CThe phosphorylation of VASP and ACTR2 in PTENε depleted Hela cells. Hele WT and Hela PTENε+/− cell lysates were immunoblotted with antibodies against p‐ACTR2 (Thr237 and Thr238), p‐VASP (Ser157), p‐VASP (Ser239), p‐VASP (Thr278), VASP, ACTR2, and GAPDH.
-
D, EThe influence of endogenous PTENε depletion on filopodia formation. (D) Immunofluorescence staining of F‐actin in Hela PTENε+/− cells and wild‐type cells. Hela PTENε+/− cells and wild‐type cells were stained with Phalloidin and DAPI before being imaged with confocal microscopy. The scale bars represent 5 μm. White arrows shown in the magnified immunofluorescence images indicate the filopodia in the cell membrane. (E) Quantification of the number of filopodia per cell by FiloQuant software and the data are presented as mean ± SD of three independent experiments and were analyzed with the unpaired t‐test. ****P < 0.0001.
-
FThe influence of PTENε deficiency on Hela cell morphology. The morphology of Hela PTENε+/− cells was observed with a Nikon microscope. Representative images of each group were shown at a higher magnification. The scale bars represent 80 μm.
Source data are available online for this figure.
Considering that abundant expression of filopodia is a critical hallmark of invasive cancer cells, we suspected that overexpressed PTENε suppresses metastasis of cancer cells by regulating filopodia formation through its protein phosphatase ability. To confirm this, the motility of stable transfectants was determined by transwell migration and Matrigel invasion assays. As shown in Fig 7C and D, compared with control cells, cell migration and invasion abilities of PTENε overexpressed Hela cells were reduced by about 34.3% or 48.5%, respectively, whereas the protein phosphatase dead PTENε mutant had no such effect. Similar results were obtained in H4 cells (Fig 7C and D). These results demonstrate that the migration and invasion of cancer cells in vitro were significantly suppressed by PTENε, which was highly possible to be related to the dephosphorylation of corresponding substrates. Concerning cell growth, overexpression of wild‐type PTENε or PTENε protein phosphatase‐deficient mutant hardly affects cell proliferation compared with the control group while PTENε slightly promotes the proliferation of H4 cells (Appendix Fig S7C and D).
To determine whether PTENε is indeed involved in the suppression of tumor metastasis in vivo, we utilized CRISPR/Cas9‐mediated base editing to convert PTENε alternative initiation site CTG into CCG to eliminate the endogenous expression of PTENε in Hela cells. We eventually obtained a PTENε heterozygous knockout cell clone, the sequencing result and off‐targets detection were shown in Appendix Fig S8 and the depletion of endogenous PTENε was shown in Fig 7E (lane 2 vs. lane 1). We first evaluated whether the phosphorylation of VASP and ACTR2 was altered in Hela PTENε+/− cells. As depicted in Fig EV4C, endogenous depletion of PTENε elevated the phosphorylation of the VASP Ser157 site and ACTR2 Thr237 and Thr238 sites, whereas the VASP Ser239 and Thr278 phosphorylation levels were unaffected. We further evaluated the status of filopodia after endogenous PTENε depletion. As was shown in Fig EV4D and E, PTENε downregulation greatly induces the formation of filopodia compared with the corresponding wild‐type group. The influence of PTENε depletion on Hela cell morphology was evaluated as well, and it turned out that cells were relatively single, short shuttle‐like, or round in the parental Hela panel, whereas Hela PTENε+/− cells were spindle‐shaped, irregular, and in a disordered arrangement group (Fig EV4F), indicating that endogenous PTENε depletion may facilitate the invasion of cancer cells by regulating filopodia formation. Accordingly, the number of migrated and invaded cells in Hela PTENε+/− group was substantially increased compared with WT cells (Fig 7F). To further verify the metastasis suppression effect of PTENε, B16 cells stably transfected with PTENε or PTENε Y210L mutant were injected into the tail vein of C57BL/6 mice, and 2 weeks later, mice were sacrificed and metastatic tumor nodules in the lung were evaluated by morphological observation and histological examination. As shown in Fig 7G, the number of lung metastatic colonies was much fewer in mice injected with PTENε overexpressed B16 cells compared with the control and PTENε Y210L group. These results collectively demonstrate that PTENε suppresses the invasion and metastasis of cancer cells in vivo and in vitro, likely through dephosphorylation of pseudopod formation‐related substrates.
Discussion
For eukaryotes, protein‐coding sequences have traditionally been defined as uninterrupted ORFs that began with the universal AUG start codon. However, it has been known since the 1980s that near‐cognate codons that differ from AUG by only one nucleotide can initiate protein synthesis, among which CUG was used most efficiently, followed by GUG, ACG, and AUU (Clements et al, 1988; Hann et al, 1988). More recently, the extensive use of ribosome profiling, in which short mRNA fragments that are protected by 80S ribosomes are purified and subjected to high‐throughput sequencing, has revealed as much as half of all translation initiation utilizes non‐AUG start codons (Ingolia et al, 2009; Ingolia et al, 2011; Diaz de Arce et al, 2018). Typically, alternative protein isoforms derived from non‐AUG start codons have recently been found to be generated from numerous cancer‐related genes and act to either promote or inhibit cancer progression (Ivanov et al, 2011; Kearse & Wilusz, 2017). Moreover, several recent studies revealed that the misregulation of non‐AUG initiations stimulates cancer malignancy (Sendoel et al, 2017). Previously, we and other groups independently identified PTENα and PTENβ, two N‐terminal extended isoforms of PTEN, which are derived from a CUG or AUU codon separately (Hopkins et al, 2013; Liang et al, 2014; Liang et al, 2017). In this study, we identify another novel translational variant of PTEN, designated PTENε or PTEN5. PTENε/PTEN5 is translated from a CUG codon 216 bp upstream of the AUG initiation site of the canonical PTEN. We found that PTENε/PTEN5 mainly distributes in the cell membrane and inhibits invasion and metastasis of cancer cells, and our data also indicate that PTENε may exert this function through regulating the formation of pseudopods by its protein phosphatase activity.
The role of individual eIFs and the flanking sequences in AUG‐initiated protein synthesis in eukaryotes has been reviewed extensively (Jackson et al, 2010; Hinnebusch, 2017). Nevertheless, the modulation of translation initiation derived from non‐AUG start codons has been less understood. It has been reported that eIF5, a crucial component of the multi‐initiation factor complex (MFC), increases the non‐AUG initiation rate, whereas 5MP exerts the opposite effect by competing with eIF5 for the Met‐tRNAi‐binding factor eIF2 (Nanda et al, 2009; Loughran et al, 2012; Diaz de Arce et al, 2018). Moreover, Ataman et al demonstrated that the alternative initiation factor eIF2A mediates initiation at non‐AUG codons for the translation of the 5′untranslated region of oncogenes such as NRAS, CD44, and RAC1 to promote cancer initiation (Sendoel et al, 2017). Our data reveal that eIF2A is essential for PTENα translation which is consistent with our previous study (Liang et al, 2014) and demonstrate that the eIF2A, instead of the eIF5 dependent mechanism, plays a critical role in CUG initiated PTENε synthesis and the expression of other PTEN isoforms as yet unidentified. Therefore, the critical role of eIF2A in mediating PTEN isoforms expression revealed in this work indicates that the modulation of non‐AUG initiation by eIF2A during tumor initiation was broad and complicated and reveals that the underline mechanisms of eIF2A to balance the translation initiation of oncogenes and anti‐oncogenes to promote or inhibit tumor are not clear, which needs further investigation.
We identified an evolutionarily conserved hairpin that begins 14nt downstream of CUG816. Consistent with several previous reports that mRNA structures immediately downstream of non‐AUG start codons influence initiation efficiency by affecting the movement of PIC (Kearse & Wilusz, 2017; Liang et al, 2017), our results demonstrate that disruption of this palindromic structure greatly reduced the alternative translation of PTENε, which indicates that the palindrome is critical for CUG initiated PTENε expression.
Several recent studies reported that N‐terminal extended isoforms initiated from non‐AUG codons in 5′UTR of mRNA may present distinct subcellular localization compared with proteins translated from downstream ORFs (Liang et al, 2014; Kearse & Wilusz, 2017; Liang et al, 2017). In line with this, data in the current study demonstrate that considerable PTENε protein localizes in the cell membrane, unlike other identified PTEN isoforms. SWISS‐MODEL analysis revealed that the residues 28–34, 38–50, and 69–81 of the N terminals of PTENε may be folded and form three α‐helixes, respectively, and residues 57–66 may form a β‐sheet. We further verified that the predicted β‐sheet formed of residues 57–66 and the α‐helix formed of 69–81 residues of PTENε are critical for PTENε membrane localization. Also, it is worth noting that the secondary structure of PTENε protein predicted by bioinformatics and their role in PTENε membrane localization need further confirmation in the future by determination of PTENε protein structure with X‐ray diffraction.
The role of PTEN protein in cancer metastasis suppression has been studied extensively. It has been reported that PTEN negatively regulates the remodeling of the actin cytoskeleton and the formation of focal adhesion complex by interaction and dephosphorylation of FAK and p130cas to suppress integrin‐mediated cell migration (Tamura et al, 1998; Tamura et al, 1999). Meanwhile, it has been shown that PTEN suppresses cell migration through inhibition of the MAP kinase pathway by dephosphorylation of shc, a critical protein that links tyrosine kinases to Ras signaling by recruiting the Grb2‐Sos complex to the plasma membrane in a tyrosine phosphorylation‐dependent manner (Gu et al, 1998; Gu et al, 1999). Furthermore, PTEN can attenuate the migratory and invasive potential of cancer by suppressing matrix metalloproteinases‐mediated degradation of the basement membrane through downregulating the expression of MMP‐2 and MMP‐9 or suppressing their enzymatic activity (Furukawa et al, 2006; Tian et al, 2010). Besides, angiogenesis is highly correlated with the presence of local or distant metastasis, and PTEN is reported to suppress angiogenesis by downregulating VEGF expression (Simonetti et al, 2006; Zhu et al, 2007; Jiang & Liu, 2009).
Filopodia are actin‐rich plasma membrane protrusions that function as antennae for cells to probe their environment, and filopodia are implicated in several fundamental physiological processes, of which cell migration is the best characterized (Mattila & Lappalainen, 2008). Abundant filopodia are considered the typical character of invasive cancer cells (Vignjevic et al, 2007). As summarized above, PTEN suppresses cancer migration through the regulation of diverse pathways. However, the role of the PTEN gene in the initiation and elongation of filopodia remains vague. In the current study, our data demonstrate that PTENε is involved in the manipulation of filopodia formation, and PTENε overexpression results in decreased filopodia and reduces tumor invasion and metastasis. Our results reveal that PTENε physically interacts with VASP, ACTR2, Fascin, and CDC42 (Mattila & Lappalainen, 2008), which are critical for filopodia formation, and indicate that PTENε may exert its function by dephosphorylating VASP at Ser157 and ACTR2 at Thr237/Thr238, respectively. Meanwhile, the effect of PTENε on Fascin‐ and CDC42‐related pathways and their role in filopodia formation remain further investigated. It is worth noting that, beyond cell migration, filopodia have also been implicated in several other fundamental physiological processes including wound healing, adhesion to the extracellular matrix, neurite outgrowth, and embryonic development (Gupton & Gertler, 2007). Therefore, the suppression of filopodia formation of PTENε indicates that it may be involved in these biological processes that need a further warranty.
According to the TCGA and Clinvar database, there is a slew of mutations within the unique N‐terminal sequence of PTENε compared to canonical PTEN (Landrum et al, 2014; Tomczak et al, 2015). These mutations associate with multiple diseases such as PTEN hamartoma tumor syndrome, autism spectrum disorder, hereditary cancer‐predisposing syndrome, indicating there may be other potential functions of PTENε to be further investigated.
We found that at least three additional proteo‐forms may be translationally initiated from codons in the 5′UTR of PTEN mRNA in addition to PTENα, PTENβ, and PTENε (Appendix Fig S9). In line with previously identified N‐terminal extended PTEN isoforms, two PTEN proteo‐forms with molecular weight slightly below PTENβ and above PTENε can also be recognized by an anti‐PTENα antibody (Liang et al, 2014), highly indicating that they were N‐terminal extended PTEN isoforms. However, the PTEN proteo‐form with a molecular weight close to canonical PTEN is not recognized by the anti‐PTENα antibody, and this affinity abolishment may result from protein conformation altered by differences in the length of the N‐terminal domain. Other isoforms of PTEN need further verification with mutational and mass spectrometry analysis.
In this study, we report the existence of PTENε or PTEN5, a membrane‐localized PTEN isoform, which suppresses filopodia formation and tumor metastasis. The identification of PTENε may pave the way for the inhibition of cancer development. Recognition of PTENε and sequential exploration of its function in filopodia formation regulation reveal the complexity of the PTEN protein family and provide evidence for its extensive involvement in various biological processes.
Materials and Methods
Cell lines, antibodies, and reagents
All human cell lines used in this study were from the American Type Culture Collection. These cell lines were authenticated by STR locus analysis and were tested for mycoplasma contamination. PC3 cells were maintained in RPMI 1640 (CORNING), and all other cells were maintained in DMEM (CORNING), supplemented with 10% FBS (Hyclone) in a 37°C incubator with 5% (v/v) CO2. The insect cell line Sf9 was obtained from Invitrogen and cultured in Grace's insect medium (Gibco). Primary antibodies used for Western blot, immunoprecipitation, and immunofluorescence are listed in Appendix Table S1. The anti‐PTENα antibody was raised and tested for its specificity in our laboratory (Liang et al, 2014).
Plasmids and cloning strategies
The plasmids pCMV‐tag‐2b, pSA, pEGFP‐N1, pFastBac1, and lentiCRISPR V2, PX459, ABE7.10 were purchased from Addgene, and the Luc2‐IRES‐Report plasmid GS0112 was purchased from GENESEED Biotech. PTEN, PTENα, PTENβ, PTENε, VASP, FSCN1, ACTR2, or CDC42, and mutations of these molecules were inserted into these plasmids.
Mice
The C57BL/6 (6 weeks, male) were purchased from Vital River Laboratory Animal Technology. All animals were maintained in a special pathogen‐free facility, and the animal study protocols used were approved by the ethics committee of Peking University Health Science Center (approval number LA2017142). Control cells and PTENε or PTENε Y210L overexpressed cells (1 × 10⁶ cells) suspended in 0.1 ml PBS were intravenously injected into the tail vein. On account of excessive tumor burdens, all animals were humanely sacrificed 2–3 weeks after injection. Pieces of lung were fixed in 10% formalin before embedded in paraffin. Serial sections of the embedded specimens were stained with hematoxylin and eosin (H&E) as conventionally conducted.
Luciferase reporter assay and real‐time PCR
For luciferase reporter assays, after transfection of various combinations of control, reporter, or protein expression vectors for 24 h, cells were lysed with a passive lysis buffer (Promega) as suggested. Luciferase activity was measured with the Dual‐Luciferase Assay System (Promega) following the manufacturer’s protocol. For quantification of endogenous PTEN, eIF2A, and eIF5 mRNA, total RNA was extracted from cells followed by reverse transcription and evaluated with real‐time PCR.
Mass spectrometry
For in vitro PTENε identification experiments, the PTENε coding sequence (CUG513‐UGA2240, PTENα initiation codon CUG513 mutated to CUC, PTENβ initiation codon AUU594 mutated to CUC, and canonical PTEN initiation codon AUG1032 mutated to AUA) was subcloned with a C‐terminal His‐tag into a pFastBac1 vector for expression in Sf9 insect cells. His affinity chromatography was used for purification of PTENε‐His before SDS–PAGE, and gel slices with a molecular weight corresponding to PTENε were digested in‐gel by endoproteinase trypsin (Promega) following the block of lysine by propionylation. Peptides were separated by online reversed‐phase nanoscale capillary liquid chromatography (Easy‐nLC 1000, Thermo Scientific). The data‐dependent mass spectra were acquired with the LTQ‐Orbitrap Elite mass spectrometer (Thermo Scientific) equipped with a nanoelectrospray ion source (Thermo Scientific). Raw files were searched by Proteome Discoverer (Version 1.4.1.14, Thermo Scientific) against the UniProt Human database supplemented with the N‐terminal extended PTEN sequence (Appendix Fig S10A). Search parameters were set as previously described (Liang et al, 2014). For endogenous PTENε identification experiments in Hela, protein lysates of Hela cells were subjected to sequential immunoprecipitation with an anti‐PTENα antibody raised in our laboratory (Liang et al, 2014). The bound proteins were separated with SDS–PAGE, and gel slices with a molecular weight corresponding to PTENε were treated in the same way as described above. For endogenous PTENε identification experiments in mice, the FLAG‐purified proteins from Pten FLAG tissues were treated in the same way as described above. Raw files were searched with Proteome Discoverer (Version 1.4.1.14, Thermo Scientific) against the UniProt Mouse database supplemented with the N‐terminal extended PTEN sequence (Appendix Fig S10B). Peptide analysis of pull‐down experiments was performed as previously described (Liang et al, 2014; Liang et al, 2017).
CRISPR‐CAS9 mediated gene editing
Sequences (GGCTGGGAACGCCGGAGAGT, AGAGAGATGGCAGAAGCTGC, or TTGATGATGGCTGTCATGTC) of the human PTEN gene in exon1 were targeted separately. Oligos were purchased from Tsingke and ligated into the lentiCRISPR V2 plasmid. To make lentivirus, 4 µg lentiCRISPR V2, 2 µg pVSVg, and 2 µg psPAX2 plasmids were co‐transfected into HEK293 cells. Return the cells to the incubator and allow viral production to continue for 48–96 h before harvest. Hela cells were seeded onto 24‐well plates containing 500 µl DMEM at a density of 100,000 cells per ml of cell suspension, and after attaching, 500 µl DMEM containing lentivirus and 2 µg/ml polybrene was added. The medium was replaced at around 12 h post‐infection. Cells were maintained for another 72 h to allow sufficient time for genomic engineering mediated by the CRISPR‐Cas9 system. Transfected cells were then treated with 2 µg/ml of puromycin for 4 days. After puromycin selection, cell clones were selected and amplified for mutation sequencing.
The sequence (AGCCAGAGGCCTGGCAGCGG) was targeted to convert the alternative transcription site of PTENε CTG into non‐initial CCG combined with ABE 7.10 according to the previously published paper by Nicole M. Gaudelli (Gaudelli et al, 2017). Oligos were purchased from Tsingke and ligated into a modified pX459 plasmid in which the cas9 sequence was deleted. Hela cells grown in the absence of antibiotics were seeded on 6‐well poly‐D‐lysine coated plates (Corning). 20–24 h later, cells were transfected at ~ 70% consistent with 0.5 µg sgRNA expression plasmid, 1.5 µg base editor plasmid ABE 7.10. Twenty‐four hours after transfection, the positively transfected cells were selected by adding puromycin (2 µg/ml) for 4 days. Then, all the selected cell clones were amplified for DNA sequencing. To detect if there are any potential off‐targets in this heterozygous knockout cell clone, we selected the top ten ranked genes that may be misrecognized by ABE7.10 through Blast webtool on the NCBI portal and examined their corresponding genome by DNA sequencing. As was shown in Appendix Fig S8B, neither genome mutation nor deletion of the corresponding gene was detected in this heterozygous knockout cell clone.
Cell fraction
The membrane and cytosol fractions were extracted according to a membrane and cytosol protein extraction kit (P0033; Beyotime). Briefly, the HEK293 cells transfected with relative constructs were harvested and added to an Eppendorf tube with 1 ml of buffer A, cracked with glass homogenizer until no obvious shiny rings around the nuclei were observed, and then centrifuged at 700 g for 10 min at 4°C to remove nucleus and unbroken cells. The resulting supernatant transferred to a new Eppendorf tube was centrifuged at 14,000 g for 10 s at 4°C. Then, the supernatant obtained above was transferred to a new Eppendorf tube (cytosol fraction), and 200–300 μl buffer B was added to the precipitate. The sample was then shaken on a vortex intensely for 5 s and kept on ice for 5–10 min. The shaking and ice steps were repeated twice to three times and then centrifuged at 14,000 g for 5 min at 4°C to obtain the supernatant’s membrane fraction.
Co‐immunoprecipitation
Immunoprecipitation was performed as previously described (Shen et al, 2007). In brief, cells were extracted and lysed in lysis buffer (50 mM Tris‐PH 7.5, 150 mM NaCl, 0.5% NP40) freshly supplemented with 1 mM PMSF and protease inhibitor. 500 µg of cell lysate was incubated with S‐protein agarose (Novagen) or anti‐FLAG M2 magnetic beads (SIGMA‐ALDRICH) for 3 h. The protein‐bead complex mixture was washed in a washing buffer containing 0.1% NP40 and subjected to Western blot to evaluate protein interaction.
Immunofluorescence and confocal microscopy
Hela cells were seeded on cover glass in DMEM followed by transfection with C‐terminal GFP‐tagged PTEN, PTENα, PTENβ, PTENε, or PTENε mutants with Lipofectamine 3000 transfection reagent. After transfection for 36 h, cells were sequentially fixed, permeabilized, and blocked as previously described (Liang et al, 2017). The primary antibody was then applied for 2 h, and fluorophore‐conjugated secondary antibody was applied for 1 h. After being washed with PBS, cells were stained with 4,6‐diamidino‐2‐phenylindole (DAPI) (Sigma). Coverslips were mounted, and cells were evaluated with fluorescence microscopy. A Nikon A1 microscope was used for confocal microscopy.
To stain filopodia in the cell membrane, Hela PTEN −/− cells transfected with corresponding plasmids were seeded on the coverslip coated by Fibronectin (Sigma, 10 µg/ml) at 4°C overnight at a density of 1×10⁵. Then, the coverslips were fixed using 4% PFA, followed by permeabilization (0.25% Triton‐X, Sigma), blocking with 1% bovine serum albumin, and staining with rhodamine‐conjugated phalloidin (YEASEN) and DAPI.
S‐tag pull‐down assay
S‐tag pull‐down assay was performed as previously described with some modifications (Liang et al, 2017). HEK293 cells were transfected with pSA, pSA‐PTEN, pSA‐PTENα, pSA‐PTENβ, or pSA‐PTENε and harvested 30 h after transfection. Cells were lysed with lysis buffer (50 mM Tris‐PH 7.5, 150 mM NaCl, 2 mM EDTA, 1% NP40) freshly supplemented with 1 mM PMSF and protease inhibitor. Equal amounts of protein were incubated with S‐protein agarose (Novagen) for 3 h. The protein‐bead complexes were washed three times with washing buffer containing 0.5% NP40. After boiling at 100°C in loading buffer, proteins were loaded onto NuPAGE 4–12% gels (Invitrogen) and visualized with silver staining (Pierce Silver Stain Kit). The potential interacting proteins in specific bands were evaluated with mass spectrum analysis.
In vitro kinase and phosphatase assay
His‐PTENε, His‐PTENε Y210L, His‐PKA, and His‐NIK were expressed in Sf9 cells and purified using Ni‐NTA agarose (Qiagen). FLAG‐His‐VASP and FLAG‐His‐ACTR2 were purified with ANTI‐FLAG® M2 Affinity Gel (F2426) and 3 × FLAG Peptide (F4799) from HEK293 cells after transfection with pCMV‐VASP and pCMV‐ACTR2 (FLAG and His‐tagged) for 30 h. For kinase assay, purified FLAG‐His‐VASP or FLAG‐His‐ACTR2 on anti‐FLAG M2 magnetic beads was incubated with His‐PKA or His‐NIK separately in kinase buffer (50 mM Tris–HCl, 10 mM MgCl2, 2 mM DTT, 1 mM EGTA, and 0.2 mM ATP) for 30 min at 30°C. For the following dephosphorylation assay, phosphorylated FLAG‐His‐VASP or FLAG‐His‐ACTR2 was incubated with or without purified His‐PTENε or His‐PTENε Y210L in dephosphorylation buffer (20 mM HEPES, 1 mM MgCl2, 1 mM EDTA, 1 mM DTT, and 0.1 mg/ml BSA) for 1 h at 37°C. The phosphorylation of VASP and ACTR2 sites with the potential for alteration was evaluated by Western blot.
Transwell migration and invasion assay
Transwell migration assays were performed by a 24‐well Boyden chamber (6.5 mm diameter, 8.0 µm; BD) according to the manufacturer’s instructions. In brief, the stably transfected Hela PTEN −/− cells or H4 cells were re‐suspended in serum‐free media. Approximately 3 × 10⁴ cells/well were seeded on the upper chamber and incubated at 37°C under 5% CO2 for 24 h, and the lower chamber was filled with complete media containing 20% FBS. After 24 h, the residual cells in the upper chamber were gently removed. Migrated cells on the lower side of the membrane were fixed with methanol and stained with 0.1% crystal violet and counted at 100× magnification at five random fields per well for statistical analysis while images at 200× magnification are chosen as representative images. In the case of in vitro invasion assay, similar experiments were performed by these transwell chambers but coated with the Matrigel matrix.
Functional pathway enrichment analysis
GO analysis was carried out to facilitate elucidating the biological implications of unique genes in the significant or representative profiles of the differently expressed genes in the S‐tag pull‐down experiment (Ashburner et al, 2000). The gene ontology analyses have the following three aspects, including biological process (BP terms), cellular component (CC terms), and molecular function (MF terms), respectively. The false discovery rate (FDR) adjustment on the P‐values was made by using the Benjamin–Hochberg procedure. FDR less than 0.05 was considered as the significance threshold.
Statistical analysis
Prism GraphPad software v8.0 was used for analysis. The Pearson correlation test was employed to analyze correlations between PTENε and eIF2A or eIF5. The statistical significance of differences between different groups was calculated with the two‐tailed unpaired t‐test. All bars represent the mean ± SEM or SD derived from three independent experiments. P‐values of 0.05 or less were considered significant.
Author contributions
YY and HL conceived the study. HL and QZ designed and performed the experiments and analyzed the data. LZ performed several experiments. YJ performed the immunofluorescence experiments. XZ performed mass spectrometric analysis. YL and JG performed tail vein injection in mice. YZ performed functional pathway enrichment analysis. HL, QZ, and YY wrote the manuscript.
Conflict of interest
The authors declare that they have no conflict of interest.
Supporting information
Appendix
Expanded View Figures PDF
Source Data for Expanded View and Appendix
Review Process File
Source Data for Figure 1
Source Data for Figure 2
Source Data for Figure 3
Source Data for Figure 4
Source Data for Figure 5
Source Data for Figure 6
Source Data for Figure 7
Acknowledgements
We thank Dr. L. Liang for help with Sf9 cell culture and Dr. Y. Li and J. Gong for help with mouse tail vein injection. This work was supported by grants including the National Key Research and Development Program of China 2016YFA0500302; the National Natural Science Foundation of China 82030081, 31700717, 81773020, 81430056 and 31420103905; the Young Elite Scientist Sponsorship Program by CAST 2019QNRC001 (to H.L.) and the Lam Chung Nin Foundation for Systems Biomedicine.
The EMBO Journal (2021) 40: e105806.
Data availability
Nucleotide sequence data reported in this work are available in the GenBank databases under the accession numbers MK783286 (Homo sapiens) and MK783287 (Mus musculus). The mass spectrometry proteomics data have been deposited to the ProteomeXchange Consortium (http://proteomecentral.proteomexchange.org/cgi/GetDataset) via the PRIDE (Vizcaino et al, 2016) partner repository with the data set identifier PXD022245 (http://www.ebi.ac.uk/pride/archive/projects/PXD022245). The original immunoblots, polyacrylamide gels, and agarose gels are provided in the source data file. Primers used in this study are listed in Appendix Tables [Link], [Link]. All other data supporting the findings of this study are available within the article or its supplementary information or from the corresponding author upon reasonable request.
References
- Ali M, Rogers LK, Pitari GM (2015) Serine phosphorylation of vasodilator‐stimulated phosphoprotein (VASP) regulates colon cancer cell survival and apoptosis. Life Sci 123: 1–8 [DOI] [PubMed] [Google Scholar]
- Ashburner M, Ball CA, Blake JA, Botstein D, Butler H, Cherry JM, Davis AP, Dolinski K, Dwight SS, Eppig JT et al (2000) Gene ontology: tool for the unification of biology. The Gene Ontology Consortium. Nat Genet 25: 25–29 [DOI] [PMC free article] [PubMed] [Google Scholar]
- Bassi C, Ho J, Srikumar T, Dowling RJ, Gorrini C, Miller SJ, Mak TW, Neel BG, Raught B, Stambolic V (2013) Nuclear PTEN controls DNA repair and sensitivity to genotoxic stress. Science 341: 395–399 [DOI] [PMC free article] [PubMed] [Google Scholar]
- Blume C, Benz PM, Walter U, Ha J, Kemp BE, Renne T (2007) AMP‐activated protein kinase impairs endothelial actin cytoskeleton assembly by phosphorylating vasodilator‐stimulated phosphoprotein. J Biol Chem 282: 4601–4612 [DOI] [PubMed] [Google Scholar]
- Brandmaier A, Hou SQ, Shen WH (2017) Cell cycle control by PTEN. J Mol Biol 429: 2265–2277 [DOI] [PMC free article] [PubMed] [Google Scholar]
- Butler MG, Dasouki MJ, Zhou XP, Talebizadeh Z, Brown M, Takahashi TN, Miles JH, Wang CH, Stratton R, Pilarski R et al (2005) Subset of individuals with autism spectrum disorders and extreme macrocephaly associated with germline PTEN tumour suppressor gene mutations. J Med Genet 42: 318–321 [DOI] [PMC free article] [PubMed] [Google Scholar]
- Butt E, Abel K, Krieger M, Palm D, Hoppe V, Hoppe J, Walter U (1994) cAMP‐ and cGMP‐dependent protein kinase phosphorylation sites of the focal adhesion vasodilator‐stimulated phosphoprotein (VASP) in vitro and in intact human platelets. J Biol Chem 269: 14509–14517 [PubMed] [Google Scholar]
- Clements JM, Laz TM, Sherman F (1988) Efficiency of translation initiation by non‐AUG codons in Saccharomyces cerevisiae. Mol Cell Biol 8: 4533–4536 [DOI] [PMC free article] [PubMed] [Google Scholar]
- Coldwell MJ, Hashemzadeh‐Bonehi L, Hinton TM, Morley SJ, Pain VM (2004) Expression of fragments of translation initiation factor eIF4GI reveals a nuclear localisation signal within the N‐terminal apoptotic cleavage fragment N‐FAG. J Cell Sci 117: 2545–2555 [DOI] [PubMed] [Google Scholar]
- Datta SR, Dudek H, Tao X, Masters S, Fu H, Gotoh Y, Greenberg ME (1997) Akt phosphorylation of BAD couples survival signals to the cell‐intrinsic death machinery. Cell 91: 231–241 [DOI] [PubMed] [Google Scholar]
- Diaz de Arce AJ, Noderer WL, Wang CL (2018) Complete motif analysis of sequence requirements for translation initiation at non‐AUG start codons. Nucleic Acids Res 46: 985–994 [DOI] [PMC free article] [PubMed] [Google Scholar]
- Furukawa K, Kumon Y, Harada H, Kohno S, Nagato S, Teraoka M, Fujiwara S, Nakagawa K, Hamada K, Ohnishi T (2006) PTEN gene transfer suppresses the invasive potential of human malignant gliomas by regulating cell invasion‐related molecules. Int J Oncol 29: 73–81 [PubMed] [Google Scholar]
- Garcia‐Cao I, Song MS, Hobbs RM, Laurent G, Giorgi C, de Boer VC, Anastasiou D, Ito K, Sasaki AT, Rameh L et al (2012) Systemic elevation of PTEN induces a tumor‐suppressive metabolic state. Cell 149: 49–62 [DOI] [PMC free article] [PubMed] [Google Scholar]
- Gaudelli NM, Komor AC, Rees HA, Packer MS, Badran AH, Bryson DI, Liu DR (2017) Programmable base editing of A*T to G*C in genomic DNA without DNA cleavage. Nature 551: 464–471 [DOI] [PMC free article] [PubMed] [Google Scholar]
- Gertler FB, Niebuhr K, Reinhard M, Wehland J, Soriano P (1996) Mena, a relative of VASP and Drosophila Enabled, is implicated in the control of microfilament dynamics. Cell 87: 227–239 [DOI] [PubMed] [Google Scholar]
- Gu J, Tamura M, Yamada KM (1998) Tumor suppressor PTEN inhibits integrin‐ and growth factor‐mediated mitogen‐activated protein (MAP) kinase signaling pathways. J Cell Biol 143: 1375–1383 [DOI] [PMC free article] [PubMed] [Google Scholar]
- Gu J, Tamura M, Pankov R, Danen EH, Takino T, Matsumoto K, Yamada KM (1999) Shc and FAK differentially regulate cell motility and directionality modulated by PTEN. J Cell Biol 146: 389–403 [DOI] [PMC free article] [PubMed] [Google Scholar]
- Gupton SL, Gertler FB (2007) Filopodia: the fingers that do the walking. Sci STKE 2007: re5 [DOI] [PubMed] [Google Scholar]
- Hann SR, King MW, Bentley DL, Anderson CW, Eisenman RN (1988) A non‐AUG translational initiation in c‐myc exon 1 generates an N‐terminally distinct protein whose synthesis is disrupted in Burkitt's lymphomas. Cell 52: 185–195 [DOI] [PubMed] [Google Scholar]
- Hinnebusch AG (2017) Structural insights into the mechanism of scanning and start codon recognition in eukaryotic translation initiation. Trends Biochem Sci 42: 589–611 [DOI] [PubMed] [Google Scholar]
- Hopkins BD, Fine B, Steinbach N, Dendy M, Rapp Z, Shaw J, Pappas K, Yu JS, Hodakoski C, Mense S et al (2013) A secreted PTEN phosphatase that enters cells to alter signaling and survival. Science 341: 399–402 [DOI] [PMC free article] [PubMed] [Google Scholar]
- Ingolia NT, Ghaemmaghami S, Newman JR, Weissman JS (2009) Genome‐wide analysis in vivo of translation with nucleotide resolution using ribosome profiling. Science 324: 218–223 [DOI] [PMC free article] [PubMed] [Google Scholar]
- Ingolia NT, Lareau LF, Weissman JS (2011) Ribosome profiling of mouse embryonic stem cells reveals the complexity and dynamics of mammalian proteomes. Cell 147: 789–802 [DOI] [PMC free article] [PubMed] [Google Scholar]
- Ivanov IP, Firth AE, Michel AM, Atkins JF, Baranov PV (2011) Identification of evolutionarily conserved non‐AUG‐initiated N‐terminal extensions in human coding sequences. Nucleic Acids Res 39: 4220–4234 [DOI] [PMC free article] [PubMed] [Google Scholar]
- Jackson RJ, Hellen CU, Pestova TV (2010) The mechanism of eukaryotic translation initiation and principles of its regulation. Nat Rev Mol Cell Biol 11: 113–127 [DOI] [PMC free article] [PubMed] [Google Scholar]
- Jiang BH, Liu LZ (2009) PI3K/PTEN signaling in angiogenesis and tumorigenesis. Adv Cancer Res 102: 19–65 [DOI] [PMC free article] [PubMed] [Google Scholar]
- Kearse MG, Wilusz JE (2017) Non‐AUG translation: a new start for protein synthesis in eukaryotes. Genes Dev 31: 1717–1731 [DOI] [PMC free article] [PubMed] [Google Scholar]
- Knobbe CB, Lapin V, Suzuki A, Mak TW (2008) The roles of PTEN in development, physiology and tumorigenesis in mouse models: a tissue‐by‐tissue survey. Oncogene 27: 5398–5415 [DOI] [PubMed] [Google Scholar]
- Lambrechts A, Kwiatkowski AV, Lanier LM, Bear JE, Vandekerckhove J, Ampe C, Gertler FB (2000) cAMP‐dependent protein kinase phosphorylation of EVL, a Mena/VASP relative, regulates its interaction with actin and SH3 domains. J Biol Chem 275: 36143–36151 [DOI] [PubMed] [Google Scholar]
- Landrum MJ, Lee JM, Riley GR, Jang W, Rubinstein WS, Church DM, Maglott DR (2014) ClinVar: public archive of relationships among sequence variation and human phenotype. Nucleic Acids Res 42: D980–985 [DOI] [PMC free article] [PubMed] [Google Scholar]
- LeClaire LL III, Baumgartner M, Iwasa JH, Mullins RD, Barber DL (2008) Phosphorylation of the Arp2/3 complex is necessary to nucleate actin filaments. J Cell Biol 182: 647–654 [DOI] [PMC free article] [PubMed] [Google Scholar]
- Li DM, Sun H (1997) TEP1, encoded by a candidate tumor suppressor locus, is a novel protein tyrosine phosphatase regulated by transforming growth factor beta. Cancer Res 57: 2124–2129 [PubMed] [Google Scholar]
- Li J, Yen C, Liaw D, Podsypanina K, Bose S, Wang SI, Puc J, Miliaresis C, Rodgers L, McCombie R et al (1997) PTEN, a putative protein tyrosine phosphatase gene mutated in human brain, breast, and prostate cancer. Science 275: 1943–1947 [DOI] [PubMed] [Google Scholar]
- Li S, Zhu M, Pan R, Fang T, Cao YY, Chen S, Zhao X, Lei CQ, Guo L, Chen Y et al (2016) The tumor suppressor PTEN has a critical role in antiviral innate immunity. Nat Immunol 17: 241–249 [DOI] [PubMed] [Google Scholar]
- Liang H, He S, Yang J, Jia X, Wang P, Chen X, Zhang Z, Zou X, McNutt MA, Shen WH et al (2014) PTENalpha, a PTEN isoform translated through alternative initiation, regulates mitochondrial function and energy metabolism. Cell Metab 19: 836–848 [DOI] [PMC free article] [PubMed] [Google Scholar]
- Liang H, Chen X, Yin Q, Ruan D, Zhao X, Zhang C, McNutt MA, Yin Y (2017) PTENbeta is an alternatively translated isoform of PTEN that regulates rDNA transcription. Nat Commun 8: 14771 [DOI] [PMC free article] [PubMed] [Google Scholar]
- Liaw D, Marsh DJ, Li J, Dahia PL, Wang SI, Zheng Z, Bose S, Call KM, Tsou HC, Peacocke M et al (1997) Germline mutations of the PTEN gene in Cowden disease, an inherited breast and thyroid cancer syndrome. Nat Genet 16: 64–67 [DOI] [PubMed] [Google Scholar]
- Loughran G, Sachs MS, Atkins JF, Ivanov IP (2012) Stringency of start codon selection modulates autoregulation of translation initiation factor eIF5. Nucleic Acids Res 40: 2898–2906 [DOI] [PMC free article] [PubMed] [Google Scholar]
- Maehama T, Dixon JE (1998) The tumor suppressor, PTEN/MMAC1, dephosphorylates the lipid second messenger, phosphatidylinositol 3,4,5‐trisphosphate. J Biol Chem 273: 13375–13378 [DOI] [PubMed] [Google Scholar]
- Mattila PK, Lappalainen P (2008) Filopodia: molecular architecture and cellular functions. Nat Rev Mol Cell Biol 9: 446–454 [DOI] [PubMed] [Google Scholar]
- Myers MP, Pass I, Batty IH, Van der Kaay J, Stolarov JP, Hemmings BA, Wigler MH, Downes CP, Tonks NK (1998) The lipid phosphatase activity of PTEN is critical for its tumor supressor function. Proc Natl Acad Sci USA 95: 13513–13518 [DOI] [PMC free article] [PubMed] [Google Scholar]
- Nanda JS, Cheung YN, Takacs JE, Martin‐Marcos P, Saini AK, Hinnebusch AG, Lorsch JR (2009) eIF1 controls multiple steps in start codon recognition during eukaryotic translation initiation. J Mol Biol 394: 268–285 [DOI] [PMC free article] [PubMed] [Google Scholar]
- Park CM, Park MJ, Kwak HJ, Lee HC, Kim MS, Lee SH, Park IC, Rhee CH, Hong SI (2006) Ionizing radiation enhances matrix metalloproteinase‐2 secretion and invasion of glioma cells through Src/epidermal growth factor receptor‐mediated p38/Akt and phosphatidylinositol 3‐kinase/Akt signaling pathways. Cancer Res 66: 8511–8519 [DOI] [PubMed] [Google Scholar]
- Peltier J, O'Neill A, Schaffer DV (2007) PI3K/Akt and CREB regulate adult neural hippocampal progenitor proliferation and differentiation. Dev Neurobiol 67: 1348–1361 [DOI] [PubMed] [Google Scholar]
- Planchon SM, Waite KA, Eng C (2008) The nuclear affairs of PTEN. J Cell Sci 121: 249–253 [DOI] [PubMed] [Google Scholar]
- Putz U, Howitt J, Doan A, Goh CP, Low LH, Silke J, Tan SS (2012) The tumor suppressor PTEN is exported in exosomes and has phosphatase activity in recipient cells. Sci Signal 5: ra70 [DOI] [PubMed] [Google Scholar]
- Qian Y, Corum L, Meng Q, Blenis J, Zheng JZ, Shi X, Flynn DC, Jiang BH (2004) PI3K induced actin filament remodeling through Akt and p70S6K1: implication of essential role in cell migration. Am J Physiol Cell Physiol 286: C153–163 [DOI] [PubMed] [Google Scholar]
- Sendoel A, Dunn JG, Rodriguez EH, Naik S, Gomez NC, Hurwitz B, Levorse J, Dill BD, Schramek D, Molina H et al (2017) Translation from unconventional 5' start sites drives tumour initiation. Nature 541: 494–499 [DOI] [PMC free article] [PubMed] [Google Scholar]
- Shen WH, Balajee AS, Wang J, Wu H, Eng C, Pandolfi PP, Yin Y (2007) Essential role for nuclear PTEN in maintaining chromosomal integrity. Cell 128: 157–170 [DOI] [PubMed] [Google Scholar]
- Shen SM, Ji Y, Zhang C, Dong SS, Yang S, Xiong Z, Ge MK, Yu Y, Xia L, Guo M et al (2018) Nuclear PTEN safeguards pre‐mRNA splicing to link Golgi apparatus for its tumor suppressive role. Nat Commun 9: 2392 [DOI] [PMC free article] [PubMed] [Google Scholar]
- Shen SM, Zhang C, Ge MK, Dong SS, Xia L, He P, Zhang N, Ji Y, Yang S, Yu Y et al (2019) PTENalpha and PTENbeta promote carcinogenesis through WDR5 and H3K4 trimethylation. Nat Cell Biol 21: 1436–1448 [DOI] [PubMed] [Google Scholar]
- Simonetti O, Lucarini G, Goteri G, Zizzi A, Biagini G, Lo Muzio L, Offidani A (2006) VEGF is likely a key factor in the link between inflammation and angiogenesis in psoriasis: results of an immunohistochemical study. Int J Immunopathol Pharmacol 19: 751–760 [DOI] [PubMed] [Google Scholar]
- Song MS, Carracedo A, Salmena L, Song SJ, Egia A, Malumbres M, Pandolfi PP (2011) Nuclear PTEN regulates the APC‐CDH1 tumor‐suppressive complex in a phosphatase‐independent manner. Cell 144: 187–199 [DOI] [PMC free article] [PubMed] [Google Scholar]
- Starck SR, Tsai JC, Chen K, Shodiya M, Wang L, Yahiro K, Martins‐Green M, Shastri N, Walter P (2016) Translation from the 5' untranslated region shapes the integrated stress response. Science 351: aad3867 [DOI] [PMC free article] [PubMed] [Google Scholar]
- Stiles BL, Kuralwalla‐Martinez C, Guo W, Gregorian C, Wang Y, Tian J, Magnuson MA, Wu H (2006) Selective deletion of Pten in pancreatic beta cells leads to increased islet mass and resistance to STZ‐induced diabetes. Mol Cell Biol 26: 2772–2781 [DOI] [PMC free article] [PubMed] [Google Scholar]
- Tamura M, Gu J, Matsumoto K, Aota S, Parsons R, Yamada KM (1998) Inhibition of cell migration, spreading, and focal adhesions by tumor suppressor PTEN. Science 280: 1614–1617 [DOI] [PubMed] [Google Scholar]
- Tamura M, Gu J, Danen EH, Takino T, Miyamoto S, Yamada KM (1999) PTEN interactions with focal adhesion kinase and suppression of the extracellular matrix‐dependent phosphatidylinositol 3‐kinase/Akt cell survival pathway. J Biol Chem 274: 20693–20703 [DOI] [PubMed] [Google Scholar]
- Tang L, Morris J, Wan J, Moore C, Fujita Y, Gillaspie S, Aube E, Nanda J, Marques M, Jangal M et al (2017) Competition between translation initiation factor eIF5 and its mimic protein 5MP determines non‐AUG initiation rate genome‐wide. Nucleic Acids Res 45: 11941–11953 [DOI] [PMC free article] [PubMed] [Google Scholar]
- Tian T, Nan KJ, Guo H, Wang WJ, Ruan ZP, Wang SH, Liang X, Lu CX (2010) PTEN inhibits the migration and invasion of HepG2 cells by coordinately decreasing MMP expression via the PI3K/Akt pathway. Oncol Rep 23: 1593–1600 [DOI] [PubMed] [Google Scholar]
- Tomczak K, Czerwinska P, Wiznerowicz M (2015) The Cancer Genome Atlas (TCGA): an immeasurable source of knowledge. Contemp Oncol (Pozn) 19: A68–77 [DOI] [PMC free article] [PubMed] [Google Scholar]
- Vignjevic D, Schoumacher M, Gavert N, Janssen KP, Jih G, Lae M, Louvard D, Ben‐Ze'ev A, Robine S (2007) Fascin, a novel target of beta‐catenin‐TCF signaling, is expressed at the invasive front of human colon cancer. Cancer Res 67: 6844–6853 [DOI] [PubMed] [Google Scholar]
- Vizcaino JA, Csordas A, Del‐Toro N, Dianes JA, Griss J, Lavidas I, Mayer G, Perez‐Riverol Y, Reisinger F, Ternent T et al (2016) 2016 update of the PRIDE database and its related tools. Nucleic Acids Res 44: 11033 [DOI] [PMC free article] [PubMed] [Google Scholar]
- Yao R, Cooper GM (1995) Requirement for phosphatidylinositol‐3 kinase in the prevention of apoptosis by nerve growth factor. Science 267: 2003–2006 [DOI] [PubMed] [Google Scholar]
- Zhu L, Loo WT, Louis WC (2007) PTEN and VEGF: possible predictors for sentinel lymph node micro‐metastasis in breast cancer. Biomed Pharmacother 61: 558–561 [DOI] [PubMed] [Google Scholar]
- Zuker M (2003) Mfold web server for nucleic acid folding and hybridization prediction. Nucleic Acids Res 31: 3406–3415 [DOI] [PMC free article] [PubMed] [Google Scholar]
Associated Data
This section collects any data citations, data availability statements, or supplementary materials included in this article.
Supplementary Materials
Appendix
Expanded View Figures PDF
Source Data for Expanded View and Appendix
Review Process File
Source Data for Figure 1
Source Data for Figure 2
Source Data for Figure 3
Source Data for Figure 4
Source Data for Figure 5
Source Data for Figure 6
Source Data for Figure 7
Data Availability Statement
Nucleotide sequence data reported in this work are available in the GenBank databases under the accession numbers MK783286 (Homo sapiens) and MK783287 (Mus musculus). The mass spectrometry proteomics data have been deposited to the ProteomeXchange Consortium (http://proteomecentral.proteomexchange.org/cgi/GetDataset) via the PRIDE (Vizcaino et al, 2016) partner repository with the data set identifier PXD022245 (http://www.ebi.ac.uk/pride/archive/projects/PXD022245). The original immunoblots, polyacrylamide gels, and agarose gels are provided in the source data file. Primers used in this study are listed in Appendix Tables [Link], [Link]. All other data supporting the findings of this study are available within the article or its supplementary information or from the corresponding author upon reasonable request.