Abstract
Multimorbidity, the simultaneous presence of multiple chronic conditions, is an increasing global health problem and research into its determinants is of high priority. We used baseline untargeted plasma metabolomics profiling covering >1,000 metabolites as a comprehensive readout of human physiology to characterize pathways associated with and across 27 incident noncommunicable diseases (NCDs) assessed using electronic health record hospitalization and cancer registry data from over 11,000 participants (219,415 person years). We identified 420 metabolites shared between at least 2 NCDs, representing 65.5% of all 640 significant metabolite–disease associations. We integrated baseline data on over 50 diverse clinical risk factors and characteristics to identify actionable shared pathways represented by those metabolites. Our study highlights liver and kidney function, lipid and glucose metabolism, low-grade inflammation, surrogates of gut microbial diversity and specific health-related behaviors as antecedents of common NCD multimorbidity with potential for early prevention. We integrated results into an open-access webserver (https://omicscience.org/apps/mwasdisease/) to facilitate future research and meta-analyses.
Deep molecular profiling of human blood has the potential to identify new pathways to diseases, improve risk prediction and enable stratified prevention and management1. Prospective studies have shown the promise of deep phenotypic profiling for precision medicine2,3 but these were very-small-scale and focused on single diseases4,5. Many pathways are shared across different diseases and one in four patients now presents with two or more chronic conditions at the same time, referred to as multimorbidity6,7. The incidence of NCD multimorbidity is increasing not only in high-income8,9 but also in middle- and low-income countries7,10, which poses major challenges for health-care systems globally.
The co-occurrence of conditions, such as type 2 diabetes (T2D) and cardiovascular diseases, is common and previous work has shown a high degree of interconnectivity with other diseases11. The lack of horizontal integration between specialities delivering care for patients with coexisting diseases means that multimorbidity is more likely to be seen as a random assortment of individual conditions. There is now a call by public health authorities and policymakers for a shift to recognizing multimorbidity as an accumulation of largely predictable clusters of diseases in the same person12. However, knowledge about shared etiologies of less obviously related diseases is sparse. Molecular profiling has the potential to identify pathways simultaneously and systematically across many different incident diseases assessed objectively and at scale. Research into the determinants of NCD multimorbidity is a high priority12 but, to our knowledge, investigations of in-depth molecular profiles in large prospective cohorts with comprehensive, long-term clinical follow-up have not been previously undertaken. Detailed information on modifiable factors that underlie and drive shared risk, which is required to establish actionable insights for the prevention and management of multimorbidity13, is also lacking.
The human blood metabolome provides a comprehensive readout of human physiology obtained through untargeted assessment of hundreds of small circulating molecules, which reflect the influences and interactions of genetics, lifestyle, environment, medical treatment and microbial activity14. We investigated the associations between baseline levels of 1,014 metabolites assessed through untargeted profiling of plasma samples and the onset of 27 NCDs, all-cause mortality and NCD multimorbidity (Extended Data Fig. 1). Clinical outcomes were assessed using electronic health record hospitalization and cancer registry data in over 11,000 participants (219,415 person years of follow-up) of the European Prospective Investigation into Cancer (EPIC)-Norfolk study15.
We systematically analyzed and established a comprehensive catalog of risk factor–metabolite–disease associations to address unanswered questions related to the shared etiology and drivers of multiple chronic conditions and multimorbidity. We sought to characterize: (1) pathways at baseline shared across multiple incident conditions to identify those that predispose individuals to multimorbidity; (2) which of the identified metabolite–disease associations are driven by modifiable clinical and other risk factors to identify targets of interventions; and (3) metabolites most strongly associated with the onset of NCD multimorbidity. We share our results through an open-access web server (https://omicscience.org/apps/mwasdisease/) to maximize the use of this resource, thereby considerably augmenting existing efforts16.
Results
We used data from the EPIC-Norfolk cohort, which includes 25,639 middle-aged participants from the general population of Norfolk, UK15. A quasi-random subsample of 11,966 participants (mean age of 60 years, s.d. = 9 years, 53.7% females) was selected for metabolomic profiling using the Metabolon HD4 platform; detailed characteristics of participants and metabolites can be found in Supplementary Tables 1–3.
Small molecule profiles of incident diseases.
Plasma levels of 458 metabolites were significantly associated with at least one incident disease or all-cause mortality representing 1,226 associations in total (trait-wise Bonferroni cutoff for significance accounting for the number of metabolites: P < 4.95 × 10⁻⁵; Extended Data Fig. 2). All-cause mortality was associated with most of those metabolites (n = 268) followed by incident T2D (n = 214), chronic obstructive pulmonary disease (COPD) (n = 142), coronary heart disease (CHD) (n = 127), heart failure (n = 110), renal disease (n = 110), peripheral arterial disease (PAD) (n = 95), lung cancer (n = 43), liver disease (n = 39), atrial fibrillation (n = 27), abdominal aortic aneurysm (AAA) (n = 21) and asthma (n = 16). We observed only few associations with incident colon cancer (n = 5), cataract (n = 5), cerebral stroke (n = 2), stomach cancer (n = 1) and Parkinson’s disease (n = 1). The five most significant associations for each of the incident diseases and all-cause mortality are shown in Extended Data Fig. 3. The number of metabolites associated with each disease outcome was partly explained by the number of cases for each disease and hence the power to detect an association (Extended Data Fig. 4). Specifically, incident T2D, COPD, PAD and lung cancer were associated with more metabolites than expected based on the overall relationship between the number of cases and the number of associated metabolites in the present study (Extended Data Fig. 4). The opposite was the case for incident cerebral stroke, eye disease or skin cancers, among others.
We observed highly correlated effect sizes (r > 0.9 for most analyses) while testing for an effect of delayed diagnosis of patients in various sensitivity analysis, including logistic regression models and exclusion of participants with any event up to five years after baseline examinations (Extended Data Fig. 5). This, however, might not exclude the possibility that effect estimates obtained in the present study could underestimate the effect for conditions usually defined in primary care settings, such as fractures or cataracts.
We identified 54 metabolite–outcome associations with suggestive evidence (P < 0.001) for differing effect sizes between men and women (Extended Data Fig. 6) of which 7 passed the more stringent Bonferroni-corrected threshold, including larger effect sizes in women for orotidine, erythornate and three unknown compounds with incident CHD. We provide sex-specific effect estimates along with P values for sex interaction effects for all metabolite–outcome associations in the web server published along with this study.
Two-thirds of associated metabolites are shared among diseases.
A total of 420 (65.6%) metabolites were associated with at least 2 different diseases or all-cause mortality (P < 0.001; Methods and Fig. 1) and 220 (34.6%) metabolites were specifically associated with one disease only (Fig. 2). We observed high connectivity among cardiometabolic and respiratory diseases including CHD, heart failure, T2D, cerebral stroke, PAD, renal and liver diseases, COPD and lung cancer across different biochemical classes of metabolites (Fig. 2). Plasma levels of the nonclassical carbohydrate N-acetylneuraminate were positively associated with 14, partly unrelated, diseases, including incident stomach, esophageal and lung cancer as well as major cardiovascular events and metabolic diseases (Fig. 2). Highly pleiotropic metabolites, that is, those associated with multiple diseases, showed wide biochemical and biological diversity (Fig. 2) and included N-acetylated amino acids (for example, N-acetylphenylalanine), surrogate markers of smoking (for example, cotinine), modified nucleotides (for example, pseudouridine), glycerophospholipids (for example, 1-palmitoyl-2-oleoyl-GPC), catabolites of vitamin C (for example, threonate), products of microbial metabolism (for example, indole propionate), sulfated steroids (for example, epiandrosterone sulfate), heme degradation products (for example, bilirubin (E,E)), proteinogenic amino acids (for example, serine) and several compounds of yet unknown identity (for example, X-11429).
Fig. 1 |. Connectivity between incident diseases established based on associated metabolites.
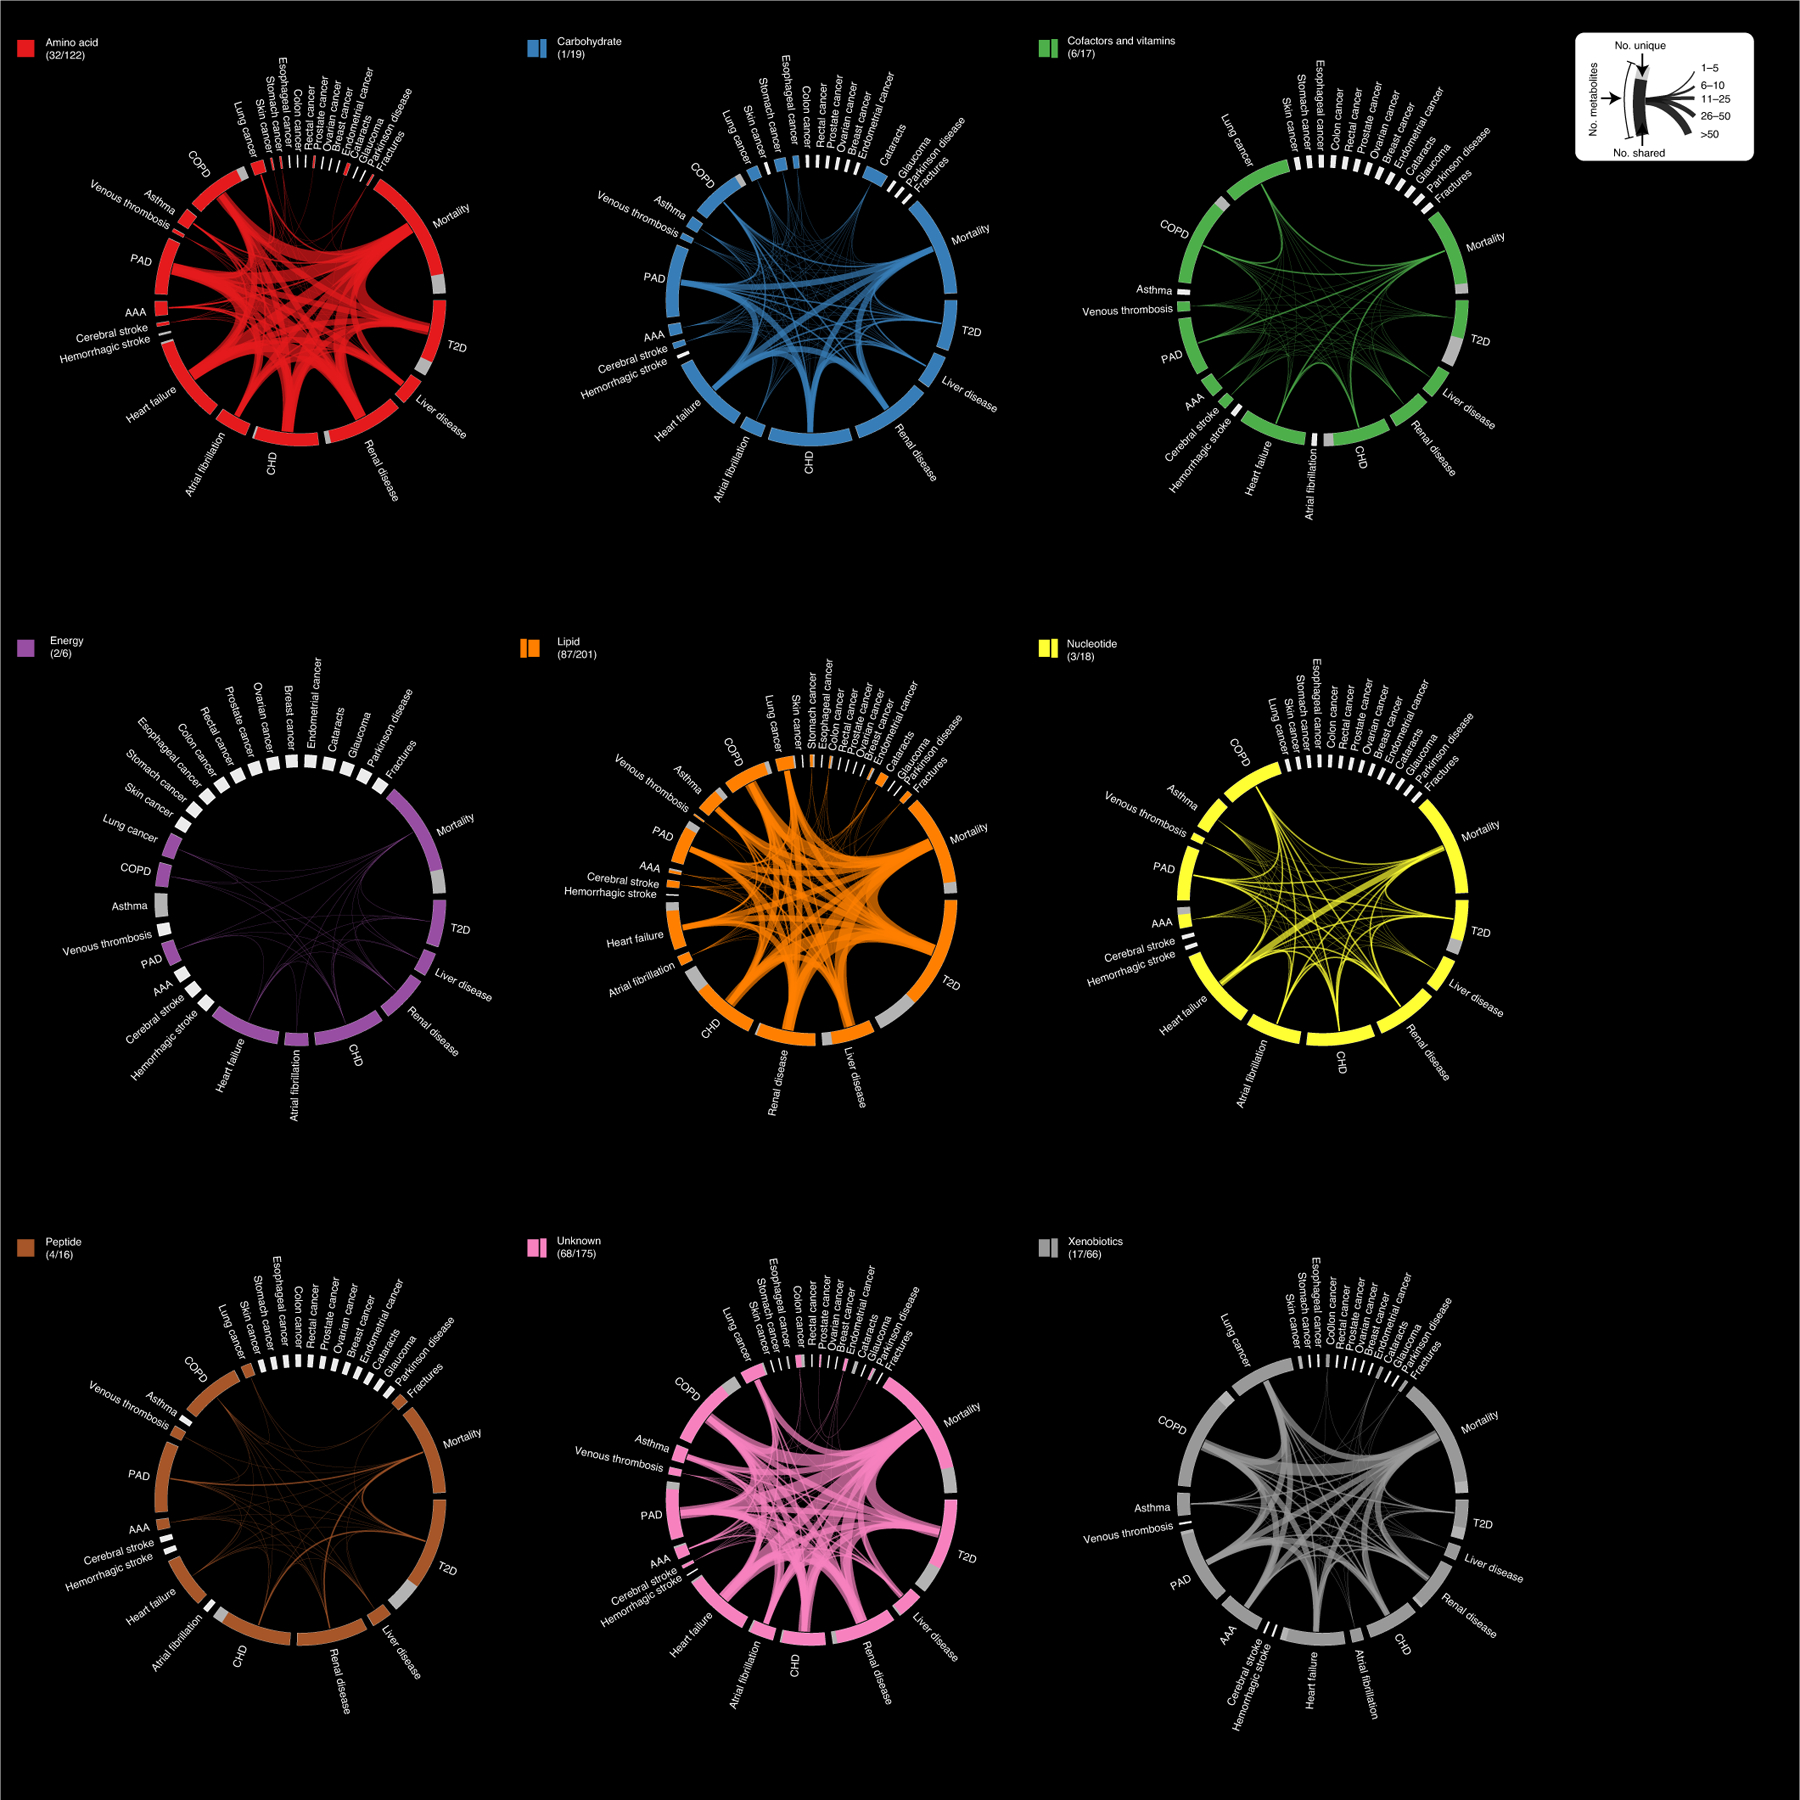
The outer ring illustrates the number of metabolites associated with each individual disease. Each disease fragment is split to represent associations with at least one other disease (colored) or associations specific to that disease (gray). The lines across the circle connecting two outcomes illustrate the number of metabolites associated with both outcomes, where line width is proportional to the number of metabolites. The outer ring fragments in white indicate that there were no associations with this disease and are proportional to half the size of at least one associated metabolite. Metabolite–disease associations are based on Cox proportional hazards models with age as the underlying timescale adjusting for sex. P < 0.001 was considered significant accounting for 28 diseases tested for each metabolite. Graphs were grouped and colored according to biochemical entities, for example, the graph Amino acid contains only metabolite associations originating from amino acid-related compounds. The numbers in parentheses indicate the number of uniquely associated metabolites and the total number of associated metabolites.
Fig. 2 |. Brick plot showing the ranking of metabolites based on the number of associated incident end points.

Metabolite–disease associations are based on Cox proportional hazards models with age as the underlying timescale adjusting for sex. P < 0.001 was considered significant accounting for 28 diseases tested for each metabolite. The x axis displays the rank of each metabolite according to the number of associated metabolites, counting inverse associations as negative numbers to ease representation of the results. The y axis counts the number of associated metabolites, whereby positive numbers indicate positive associations and negative numbers indicate inverse associations. The colors of each box indicate the associated end point. Selected metabolites with multiple associated end points have been annotated. The single asterisk indicates metabolites that were annotated based on in silico prediction. An interactive version of this figure is available on our web server.
We identified some metabolites with shared associations among seemingly unrelated diseases. Plasma levels of the unknown compound X-11305 were inversely associated with the risk of colon cancer, heart failure, PAD, COPD and mortality. In another example, plasma levels of maltose were positively associated with stomach cancer, T2D, heart failure, CHD, PAD, venous thrombosis, COPD and mortality.
The vast majority (93%) of metabolites associated with multiple outcomes showed consistent effect directions across all significantly associated diseases, that is, being either positively or inversely associated with all diseases. Exceptions included N-acetylmethionine, which was inversely associated with incident T2D and liver diseases but positively with incident AAA, heart failure, PAD, renal diseases, COPD and mortality, and the unknown compound X-23997, which was inversely associated with prostate cancer but positively with Parkinson disease. In-depth exploration of these and other examples, along with additional results, is possible via our webserver.
Integration of diverse traits at baseline identifies actionable antecedents.
To put the identified small molecule profiles into context and identify actionable antecedents, that is, possible targets for intervention or management, we quantified the explained variance for each metabolite using information on more than 50 diverse participant baseline characteristics. Prevalent conditions, anthropometric and lifestyle markers, as well as comprehensive clinical chemistry markers (Extended Data Fig. 7a) were included in the analysis. Almost every measured metabolite (972 out of 1,014) was significantly associated (P < 4.93 × 10⁻⁵) with at least 1 trait in cross-sectional analyses (Extended Data Fig. 7b).
To identify dependencies among specific risk factors, metabolites and diseases of interest, we utilized a formal mediation analysis framework. To match triplets among risk factors, metabolites and outcomes, we ran Cox models for 21 baseline characteristics that were selected based on clinical utility and to minimize redundancy (Extended Data Fig. 8). Out of 6,364 possible paths (significant and directionally consistent triangles between risk factor–metabolite–disease; Methods), 1,084 (17.0%) had a significant indirect effect (P < 7.8 × 10⁻⁶) indicating a relationship between a risk factor and a metabolite with respect to a specific disease. Thereby, we identified common antecedents, that is, exposures associated with multiple metabolites and outcomes, such as obesity (waist-to-hip ratio or body mass index), inflammation (fibrinogen), measures of liver (liver enzyme levels) and kidney function (uric acid and creatinine), blood lipids, systolic blood pressure, smoking behavior and glucose homeostasis (Fig. 3a). The median proportion mediated was 15.7% (interquartile range = 11.0–26.6%; Extended Data Fig. 9 and Supplementary Table 4) and effects largely mediated by metabolites appeared to be exposure-specific, for example, N-formylmethionine was estimated to mediate 47.3% of the effect of uric acid or creatinine on renal disease, CHD and mortality on average (Fig. 3b). We identified a few metabolites possibly mediating the associations of multiple exposures (n ≥ 10) on multiple outcomes (n ≥ 5), including X-12117 (Fig. 3c), C-glycosyl tryptophan, N-acetylneuraminate, N-acetylglucoseamine, mannose, 1-palmitoyl-2-oleoyl-GPE (16:0/18:1) and X-11429, representing antecedents such as kidney function, inflammation and glucose and lipid metabolism.
Fig. 3 |. Summary of mediation analysis.
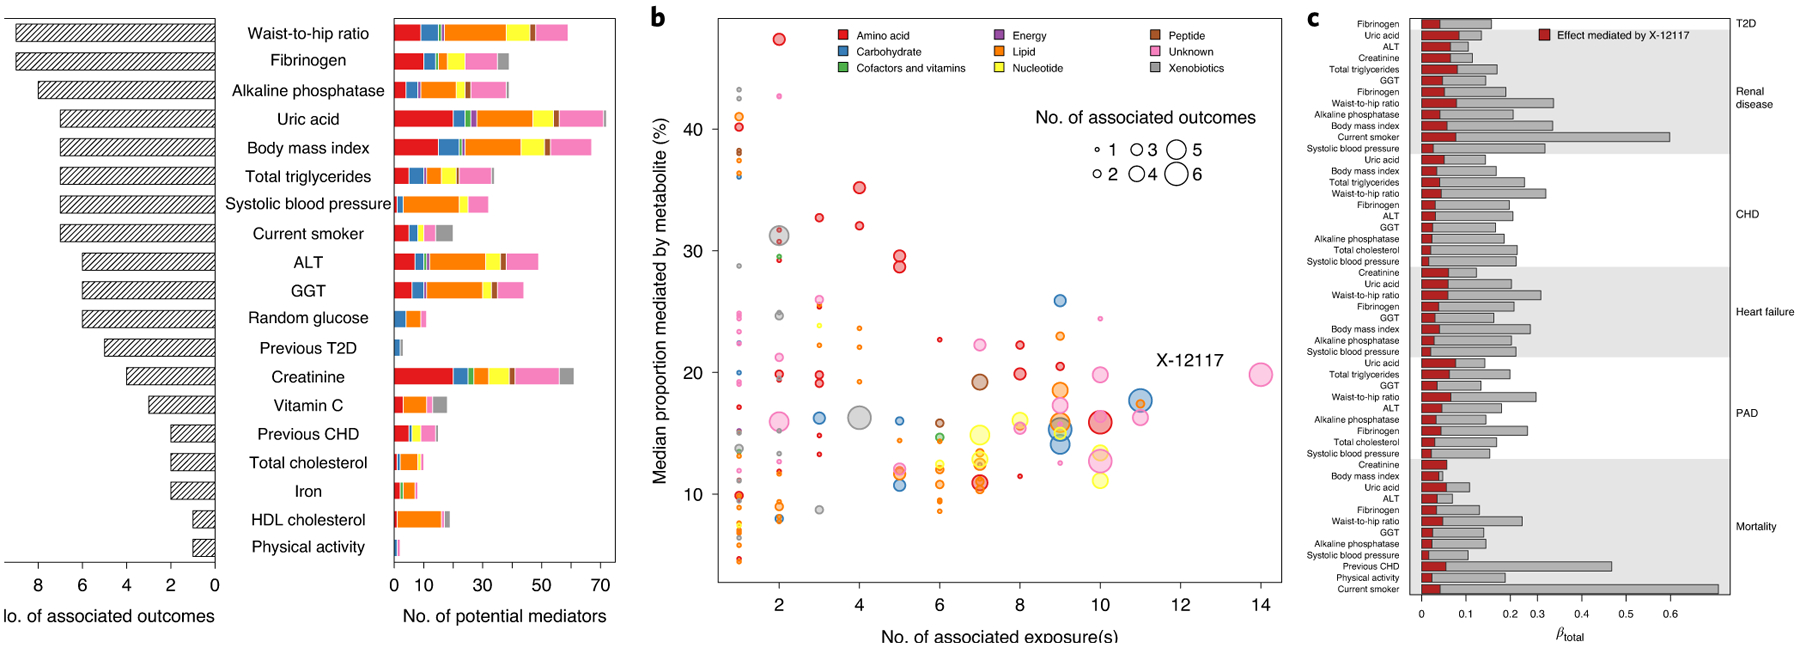
a, Bar chart showing for each exposure the number of putative mediating metabolites (colored bar indicating the composition of metabolite species) and number of associated incident outcomes (shaded bar). Only exposures with at least one associated incident outcome are listed and have been sorted by the number of outcomes. b, For each metabolite, the number of source exposures is plotted against the median proportion mediated by the metabolite. The dot sizes indicate the number of associated outcomes for which the metabolite mediated at least some percentage of the effect of an exposure. c, Detailed listing for the effect estimated to be significantly mediated by X-12117 from the exposures on the left on the risk for a disease listed on the right.
We note that for some exposures metabolite associations superseded exposure associations as indicated by complete attenuation of risk factor associations or a proportion of mediated effect larger than 100%, for example, metabolites such as C-glycosyl tryptophan or pseudouridine might be better markers to judge the risk associated with kidney function decline on all-cause mortality. Furthermore, X-12117 almost completely mediated the increased risk associated with body mass index on all-cause mortality (Supplementary Table 4).
To validate the effect of identified antecedents, we included those (that is, body mass index, waist-to-hip ratio, smoking behavior, serum uric acid concentrations, total triglycerides, HDL cholesterol, random glucose, serum alkaline phosphatase concentrations, serum vitamin C concentrations, systolic blood pressure and plasma fibrinogen concentrations) as additional covariates to the initial Cox regression models. Consequently, the number of associated metabolites more than halved (361 compared to 640 with P < 0.001; Supplementary Table 5) and the proportion of uniquely associated metabolites increased to 56.2% (203 out of 361).
Metabolites specifically associated with diseases.
A total of 79 metabolites (Supplementary Table 6) showed evidence of being uniquely associated with incident T2D (n = 36), all-cause mortality (n = 21), COPD (n = 10), CHD (n = 10) or liver disease (n = 2). The metabolite with the strongest association was γ-glutamylglycine, for which 1 s.d. increase in plasma levels was associated with a 37% lower risk for incident T2D (hazard ratio (HR) per s.d. increase in metabolite levels: 0.63; 95% confidence interval (CI): 0.58–0.68; P < 1.6 × 10⁻²⁸). Formation of γ-glutamyl amino acids is facilitated at the plasma membrane by γ-glutamyl transpeptidase activity and contributes to amino acid influx and formation of the essential antioxidant glutathione17. Our cross-disease comparison revealed two distinct subgroups of γ-glutamyl peptides. In addition to γ-glutamylglycine, γ-glutamylthreonine and γ-glutamyltyrosine were uniquely associated with incident T2D (Supplementary Table 5) whereas γ-glutamylglutamine or γ-glutamylisoleucine were associated with multiple phenotypes, including incident T2D, and have been previously suggested as markers of liver injury18. Such systematic investigations can pinpoint disease-characterizing perturbations in amino acid flux.
Other examples of uniquely associated metabolites included plasma levels of 7-methylxanthine (HR for COPD: 1.24, 95% CI 1.14–1.34, P < 1.9 × 10⁻⁸), 1-palmitoyl-2-stearoyl-GPC (16:0/18:0) (HR for CHD: 1.12, 95% CI 1.07–1.17, P < 6.6 × 10⁻⁷) and 2-palmitoleoylglycerol (16:1) (HR for liver disease: 1.28, 95% CI 1.14–1.43, P < 2.0 × 10⁻⁵).
From multiple outcome associations to NCD multimorbidity.
We identified 1,858 (32.6%) participants who developed multiple chronic conditions during follow-up; Fig. 4 displays a detailed composition of disease counts.
Fig. 4 |. Percentage of each disease acquired during follow-up.
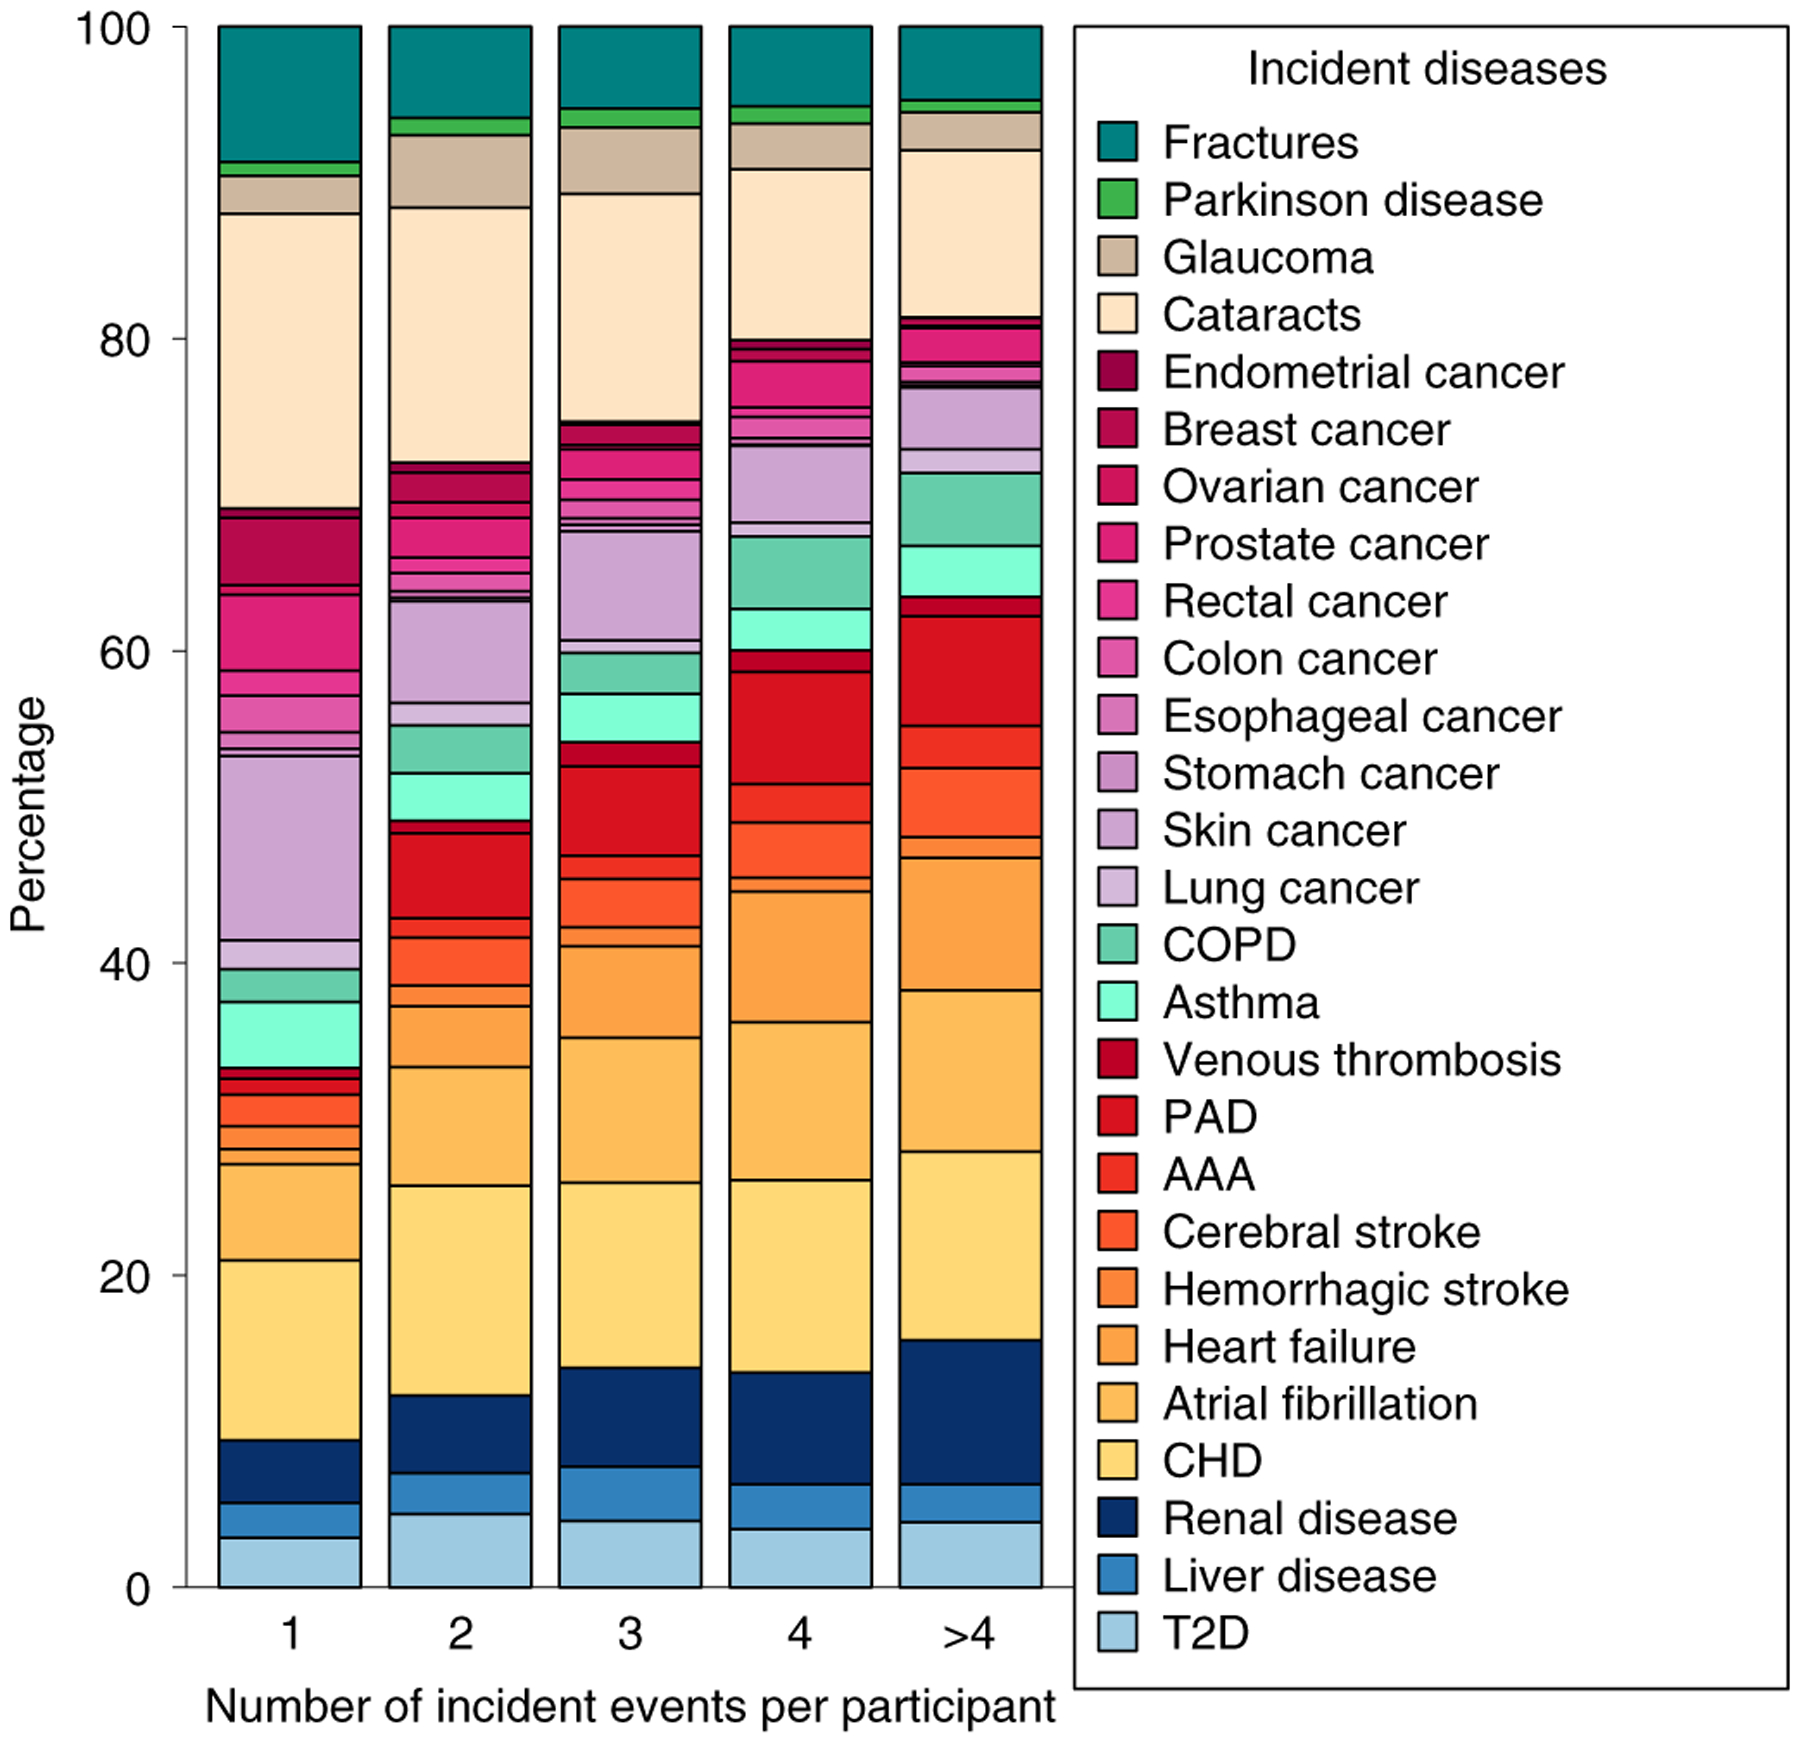
Counts were normalized to the total number of diseases each participant developed. Only participants without any of these diseases at baseline were included (n = 5,699).
The plasma levels of 30 metabolites were significantly associated (P < 4.93 × 10⁻⁵) with the risk of NCD multimorbidity (defined as developing ≥2 chronic conditions during follow-up) (Figs. 4 and 5 and Supplementary Table 7). Odds ratios (ORs) ranged between 1.29 (cotinine; 95% CI 1.16–1.42) and 0.82 (β-cryptoxanthin, 95% CI 0.77–0.87) per 1 s.d. increase in metabolite levels and were comparable to those from other baseline characteristics, such as C-reactive protein (1.28, 95% CI 1.20–1.37) or the waist-to-hip ratio (1.27, 95% CI 1.15–1.40) (Supplementary Table 8). Most metabolites that were associated with NCD multimorbidity were also associated with multiple chronic conditions in disease-wise Cox models (Pearson correlation coefficient: 0.41, P < 2.2 × 10⁻¹⁶).
Fig. 5 |. Metabolites associated with multimorbidity.
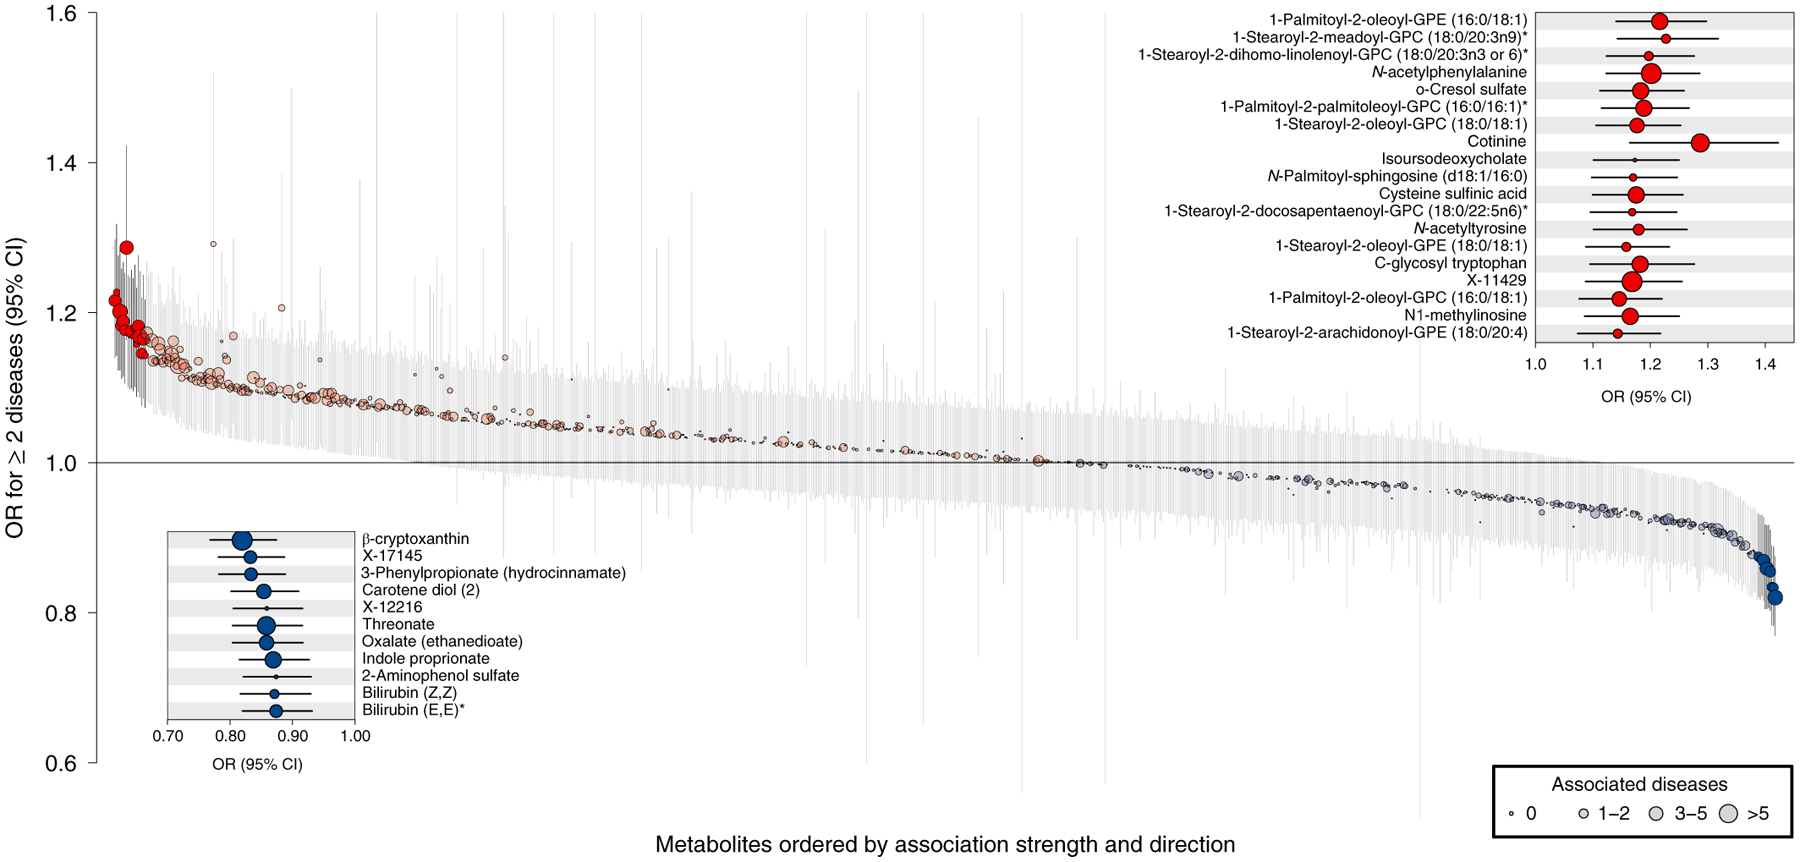
ORs and 95% CIs from logistic regression analysis with plasma metabolites as the exposure and a binary NCD multimorbidity variable (onset of two or more diseases during follow-up) as the outcome adjusting for age and sex. Metabolites were ordered by association strength and direction (from left to right). Coloring indicates the association direction (red, positively; blue, inversely) and statistical significance correcting for multiple testing (darker colors, P < 4.93 × 10⁻⁵). The size of the dots indicates the number of associated diseases in disease-specific Cox models. The single asterisk indicates that metabolites were annotated based on in silico prediction.
To identify common traditional clinical measures that are antecedents of NCD multimorbity, we first clustered the 30 multimorbidity-associated metabolites to account for their correlated structure and derived 9 different clusters (Extended Data Fig. 10). From each of the clusters, we chose the metabolite with the largest effect size as a representative. Some antecedents were immediately apparent, including smoking behavior via cotinine, lipoprotein metabolism via 1-stearoyl-2-meadoyl-GPC, kidney function via C-glycosyl tryptophan and vitamin C metabolism via cysteine sulfinic acid, all indicated by a large amount (>10%) of variance explained in metabolite levels through those risk factors (Fig. 6). Plasma levels of N-acetylphenylalanine were again best explained by surrogate markers of kidney function but seemed to also reflect body composition, given that the waist-to-hip ratio explained 5.7% of its variance. Furthermore, heme degradation, which is tightly linked to sufficient iron supply, might be the most likely explanation for the pattern seen with bilirubin (Z,Z).
Fig. 6 |. Variance explained in the plasma levels of selected metabolites associated with multimorbidity.
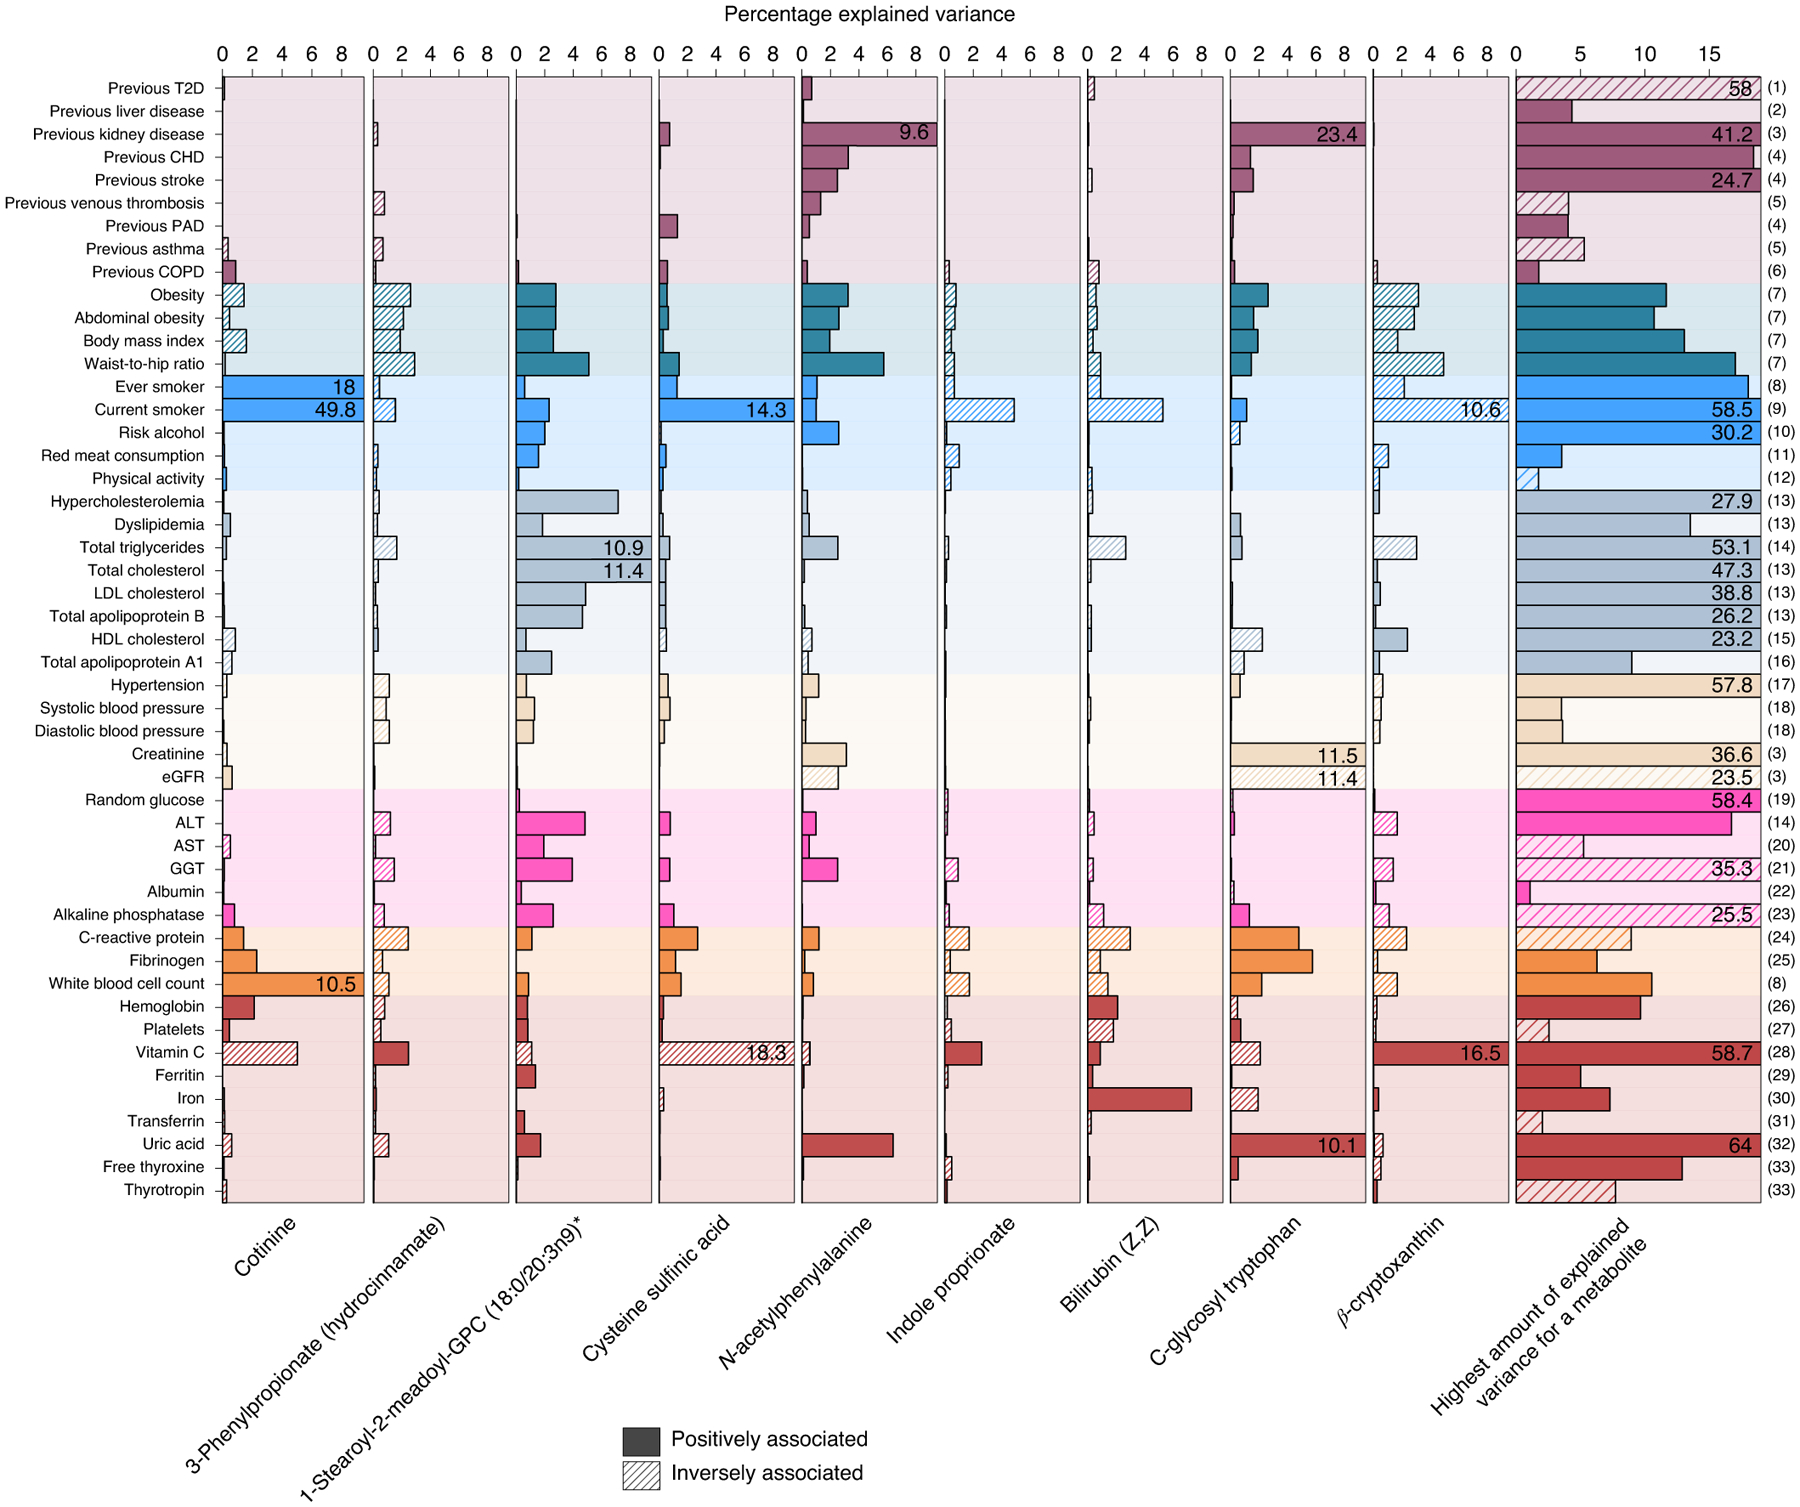
Amount of variance explained by risk factors and other continuous traits on selected metabolites, which are representative of metabolites associated with incident NCD multimorbidity (see main text). Solid colors indicate positive associations with metabolite levels, whereas shading indicates inverse associations. The column on the far right indicates the maximum amount of variance for any metabolite by each risk factor: (1) 1,5-anhydroglucitol (1,5-AG); (2) X-14662; (3) creatinine; (4) 2-hydroxyhippurate (salicylurate); (5) X-21364; (6) X-23291; (7) X-12063; (8) cotinine; (9) o-cresol sulfate; (10) X-24293; (11) 1-(1-enyl-stearoyl)- 2-arachidonoyl-GPE (P-18:0/20:4)*; (12) 1-(1-enyl-palmitoyl)-2-linoleoyl-GPC (P-16:0/18:2)*; (13) cholesterol; (14) palmitoyl-linoleoyl-glycerol (16:0/18:2)*; (15) 1-(1-enyl-palmitoyl)-2-oleoyl-GPC (P-16:0/18:1)*; (16) 1-(1-enyl-stearoyl)-2-oleoyl-GPC (P-18:0/18:1); (17) atenolol; (18) glycerol; (19) glucose; (20) N-acetylmethionine; (21) cysteine-glutathione disulfide; (22) retinol (vitamin A); (23) choline phosphate; (24) serine; (25) N-acetylneuraminate; (26) citrate; (27) γ-glutamylglutamine; (28) threonate; (29) perfluorooctanesulfonic acid; (30) bilirubin (Z,Z); (31) betaine; (32) urate; (33) thyroxine; the single asterisk indicates that metabolites were annotated based on in silico prediction. eGFR, estimated glomerular filtration rate.
We identified other potential new antecedents of NCD multimorbidity, such as plasma levels of 3-phenylpropionate and indole propionate since variation in plasma levels of these metabolites was only partly explained by traditional clinical measures.
Possible biochemical pathways related to the onset of NCD multimorbidity.
Metabolomics profiling allows for comprehensive characterization of pathways shared among multiple diseases and contributing to NCD multimorbidity in conjunction with established risk factors. Prominent associations for N-acetylated amino acids, in particular N-acetylalanine, were consistently present in all analyses performed and variance in plasma levels was best explained by estimated baseline glomerular filtration rate (inversely associated). Expression of aminoacylase 1, the most abundant aminoacylase that catabolizes N-acetylated amino acids, is highest in the cytosol of tubular cells of the kidneys19. Impaired kidney function over and above a reduced glomerular filtration rate, indicated by altered aminoacylase activity, is likely to be a major disease driver, emphasizing the importance of kidney function and management of kidney disease for the prevention of NCD multimorbidity. Associations with N-acetylated amino acids were not limited to major cardiovascular events—for which chronic kidney disease is a known independent risk factor20—but also included lung cancer, COPD, T2D and liver disease.
Inflammation or so-called inflammaging21 has been suggested to be an important risk factor for diverse diseases and we observed a related molecular signature among the metabolites associated with multiple outcomes. N-acetylneuraminate and N-acetylglucosamine are part of the glycocalyx surrounding the apical membrane of epithelial cells contributing to vascular integrity by regulating permeability22. Shedding in response to inflammatory stimuli23 of the glycocalyx leads to higher concentrations of its components, like N-acetylneuraminate, in the circulation. A functional role of N-acetylneuraminate during myocardial infarction has been suggested and pharmacological suppression of the producing enzyme neuraminidase-1 using influenza medication was shown to preserve cardiomyocytes from injury during infarction24. It remains to be established whether N-acetylneuraminate has a functional role in mediating the effect of low-grade inflammation on the risk of chronic conditions such as cardiovascular and pulmonary diseases, including lung cancer and T2D.
Our results highlight putative new antecedents of NCD multimorbidity, including 3-phenylpropionate (hydrocinnamic acid) and indole propionate, plasma level of which were only weakly explained by established risk factors. Both metabolites have previously been linked to greater diversity of the gut microbiome as measured by the Shannon index25. Circulating levels in the blood might therefore act as an indirect readout for the relative abundance of species such as Clostridium in the gut26. Cross-sectional studies have shown a variety of associations between the abundance of microbial species in the gut and several prevalent chronic conditions27,28. The microbial-derived metabolite trimethylamine N-oxide29 has been shown to be a candidate mediator for the adverse effect of red meat consumption on cardiovascular disease risk and was associated with an increased risk of heart failure and mortality in our study. However, high red meat consumption explained only little (0.2%) in the variance of trimethylamine N-oxide plasma levels compared with markers of kidney function (3.2%).
The etiology of gut dysbiosis is to be established but a diet poor in fiber has been suggested to contribute to overgrowth of harmful species, such as Clostridium or Bacteroides, diminishing overall diversity and production of microbial metabolites beneficial for the host, such as short-chain fatty acids30. The ability to characterize individual disease trajectories in depth using microbial profiling along with other high-resolution ‘omics’ data was demonstrated in a small pioneering study of around 100 individuals at high risk for metabolic diseases2,4. In this study, we show that plasma levels of surrogates of microbial diversity are inversely associated with several common severe incident NCDs, including T2D, renal diseases, heart failure, CHD, asthma, COPD, lung cancer and all-cause mortality as well as multimorbidity using objectively ascertained outcomes from a long-term prospective population-based study. We cannot, however, exclude that other factors related to diet not investigated in the present study, such as a healthier lifestyle, might have contributed to our observations.
Discussion
Multimorbidity is becoming the rule rather than the exception in clinical practice and the identification of shared disease mechanisms and modifiable drivers is high priority31. Through systematic, data-driven integration of the metabolome and phenome with near-complete follow-up using externally derived electronic health record data for 27 major diseases and all-cause mortality, we identified common and possibly actionable antecedents related to the onset of multiple NCDs and multimorbidity. In-depth molecular profiling together with detailed baseline characterization of participants highlights mediating pathways through the characterization of triangles of clinical risk factor–metabolite–disease links.
We identified obesity, smoking, impaired glucose homeostasis, low-grade inflammation, lipoprotein metabolism, liver and kidney function as common actionable antecedents of NCD multimorbidity, that is, there are already established treatment or prevention strategies to attenuate the associated disease risk. These common risk factors account for the majority of premature deaths worldwide32 and our results now highlight their central role for the potential prevention and management of multimorbidity in health-care systems, together with previous studies33,34.
Patients at greatest risk for multimorbidity are those with a preexisting chronic condition. Effective prevention strategies focused on multimorbidity need to be anchored within primary care and secondary prevention efforts35. Our data-driven approach suggests that a focus on the monitoring of kidney and liver function and glycemic control, together with weight loss and smoking cessation support, are essential for the prevention and management of multimorbidity in middle-aged and older individuals with chronic conditions.
The diverse nature of the antecedents identified in the current study, including the gut microbiome, calls for the consideration of a broad and new range of risk factors in the care of patients with chronic conditions who are at risk of multimorbidity, which may go beyond the single-disease focus of specialist care36. Linkage of the molecular patterns or antecedents that we have identified with the incidence of specific subtypes of multimorbidity37, that is, clusters of more frequently co-occurring diseases, can help to inform successful prevention and intervention strategies managed in general practice. Furthermore, integration of molecular pathways shared across multiple diseases, as identified in the present study, can guide the identification of subtypes of multimorbidity by investigating how those molecules or pathways associate with or even determine co-occurrence of seemingly unrelated diseases, for instance, guided by comorbidity networks38,39, in independent studies.
We found sparse evidence for discordant directions of associations of specific metabolites across different diseases, which suggests that intervening on identified shared pathways has the potential to convey benefit in a consistent way and to not increase the risk of developing other conditions.
Our systematic comparison across NCDs allowed us to untangle associations between closely related molecules, such as a liver function-independent association between certain γ-glutamyl amino acids and incident T2D. To our knowledge, we have provided the most comprehensive catalog of risk factor–metabolite associations reported to date, which helped us contextualize our findings and can inform future metabolomics studies. Our data-driven and hypothesis-free approach allowed us to challenge current concepts of the most important host factors explaining variation in the plasma levels of microbial metabolites; for instance, the estimated glomerular filtration explained more variance in the plasma levels of trimethylamine N-oxide compared with high meat intake. Our mediation approach to triangulate risk factors, metabolites and diseases does not prove causality and strong correlations between metabolites and risk factors make it almost impossible to pinpoint the true underlying relation from observational data and complementary methods, for instance, incorporating genetic techniques might help to identify key mechanisms.
We have generated an easily accessible web server to enable the interrogation of these results in an interactive way and have provided an intuitive graphical representation of the results. The web server allows the identification of factors explaining the variance of specific plasma metabolites of interest and querying individual disease summary statistics for future meta-analyses and power calculations, specifically for some of the less common outcomes. It also enables comparison with diseases not studied for the purpose of this analysis and may help other investigators to prioritize metabolomics approaches, for example, lipidomics for in-depth investigation of specific diseases in new studies.
To our knowledge, this is the first study integrating comprehensive metabolomic and phenotypic profiling with detailed assessment of multiple incident diseases at the same time. Our study stands out by having near-complete follow-up of 219,415 person years, which maximizes power and minimizes selection bias. The application of Cox models was appropriate for most of the investigated metabolite–end point associations but we cannot completely rule out the possibility that some relationships might be better modeled with other statistical strategies. Despite being the largest study of its kind to date and having long-term follow-up, we could not provide coverage of rare and infectious diseases and the less severe spectrum of the diseases included, which would be better covered by the inclusion of primary care data. Large-scale biobank studies with hundreds of thousands of participants linked with electronic health records from primary care, such as the UK Biobank, could provide such opportunities in the future, especially if they cover not only metabolomics as a comprehensive snapshot of human physiology, but other ‘omics’ data (for example, proteomics40) that provide distinct and complementary information to extend the findings from the present study.
Methods
Study cohort.
The EPIC-Norfolk study is a cohort of 25,639 middle-aged individuals from the general population of Norfolk a county in Eastern England15, which is a component of EPIC. The EPIC-Norfolk study was approved by the Norfolk Research Ethics Committee (ref. 05/Q0101/191); all participants gave their informed written consent before entering the study.
All participants were flagged for mortality at the UK Office of National Statistics and vital status was ascertained for the entire cohort. Death certificates were coded by trained nosologists according to the International Statistical Classification of Diseases and Related Health Problems, 10th Revision (ICD-10). Hospitalization data were obtained using National Health Service numbers through linkage with the East Norfolk Health Authority (ENCORE) database, which contains information on all hospital contacts throughout England and Wales. Participants were identified as having experienced an event if the corresponding ICD-10 code was registered on the death certificate (as the underlying cause of death or as a contributing factor) or as the cause of hospitalization (Supplementary Table 2). Since the long-term follow-up of EPIC-Norfolk comprised the ICD-9 and ICD-10 coding system, codes were consolidated. The current study is based on follow-up to 31 March 2016. Information on lifestyle factors and medical history was obtained from questionnaires as reported previously15. Supplementary Table 2 summarizes the methods for all characteristics investigated in the present study.
Metabolite measurements.
We used non-fasted plasma samples stored in liquid nitrogen since baseline in 1993–1997 from a total of 11,966 men and women from the EPIC-Norfolk prospective cohort to perform untargeted metabolomic measurements using the Discovery HD4 platform (Metabolon). Measurements were undertaken in two sub-cohorts of 5,989 and 5,977 participants, respectively, quasi-randomly selected from the full cohort after the exclusion of a T2D case cohort. We note that by comparing the effect estimates from Cox models from the sample used in the present study and the T2D cohort, they were strongly correlated (Pearson r = 0.85). In total, 1,015 metabolites were measured in both sub-cohorts, of which 1,014 were included in the statistical analyses since they were present in at least 10 cases for at least 1 of the outcomes under investigation. Those metabolites cover a broad spectrum of chemical entities, including lipids, amino acids or nucleotides, that is, products of human metabolism but also substances of exogenous origin, such as drugs or markers of nutrition and lifestyle. Due to this broad coverage and the hypothesis-free nature of the approach, several metabolites are of yet unknown identity and referred to by an X followed by a unique number.
Plasma samples were prepared using the automated MicroLab STAR system (Hamilton Company). Several recovery standards were added before the first step in the extraction process for quality control purposes. Plasma proteins were precipitated with methanol under vigorous shaking for 2 min (Glen Mills GenoGrinder 2000) followed by centrifugation. The resulting extract was divided into five fractions: two for analysis by two separate reverse phase/ultra-performance liquid chromatography (UPLC)-tandem mass spectrometry (MS/MS) methods with positive ion mode electrospray ionization (ESI), one for analysis by reverse phase/UPLC-MS/MS with negative ion mode ESI, one for analysis by hydrophilic interaction liquid chromatography (HILIC)/UPLC-MS/MS with negative ion mode ESI and one sample reserved for backup. Samples were placed briefly on a TurboVap (Zymark) to remove the organic solvent. The sample extracts were stored overnight under nitrogen before preparation for analysis.
Several types of controls were analyzed in concert with the experimental samples: a pool of well-characterized human plasma served as a technical replicate throughout the dataset; extracted water samples served as process blanks; and a cocktail of quality control standards that were carefully chosen not to interfere with the measurement of endogenous compounds were spiked into every analyzed sample, allowed instrument performance monitoring and aided chromatographic alignment. Instrument variability was determined by calculating the median relative s.d. for the standards that were added to each sample before injection into the mass spectrometers. Overall process variability as determined by calculating the median relative s.d. for all endogenous metabolites (that is, noninstrument standards) present in 100% of the pooled matrix samples was 10%. Experimental samples were randomized across the platform run with quality control samples spaced evenly among the injections.
All methods utilized a Waters ACQUITY UPLC and a Thermo Fisher Scientific Q Exactive high-resolution/accurate mass spectrometer interfaced with a heated electrospray ionization source and Orbitrap mass analyzer operated at 35,000 mass resolution. The sample extract was dried then reconstituted in solvents compatible to each of the four methods. Each reconstitution solvent contained a series of standards at fixed concentrations to ensure injection and chromatographic consistency. One aliquot was analyzed using acidic positive ion conditions, chromatographically optimized for more hydrophilic compounds. In this method, the extract was gradient eluted from a C18 column (Waters UPLC BEH C18 2.1 × 100 mm, 1.7 μm) using water and methanol, containing 0.05% perfluoropentanoic acid (PFPA) and 0.1% formic acid. Another aliquot was also analyzed using acidic positive ion conditions; however, it was chromatographically optimized for more hydrophobic compounds. In this method, the extract was gradient eluted from the same aforementioned C18 column using methanol, acetonitrile, water, 0.05% PFPA and 0.01% formic acid and was operated at an overall higher organic content. Another aliquot was analyzed using basic negative ion optimized conditions using a separate dedicated C18 column. The basic extracts were gradient eluted from the column using methanol and water, however, with 6.5 mM of ammonium bicarbonate at pH 8. The fourth aliquot was analyzed via negative ionization after elution from a HILIC column (Waters UPLC BEH Amide 2.1 × 150 mm, 1.7 μm) using a gradient consisting of water and acetonitrile with 10 mM of ammonium formate, pH 10.8. The MS analysis alternated between MS and data-dependent MSn scans using dynamic exclusion. The scan range varied slightly between methods but covered 70–1,000 m/z.
Raw data were extracted, peak-identified and quality control-processed using Metabolon’s hardware and software. Compounds were identified by comparison to library entries of purified standards or recurrent unknown entities. Metabolon maintains a library based on authenticated standards that contains the retention time/index, mass to charge ratio (m/z) and chromatographic data (including MS/MS spectral data) on all molecules present in the library. Furthermore, biochemical identifications are based on three criteria: retention index within a narrow retention index window of the proposed identification, accurate mass match to the library ±10 parts per million and the MS/MS forward and reverse scores between the experimental data and authentic standards. The MS/MS scores are based on a comparison of the ions present in the experimental spectrum to the ions present in the library spectrum. While there may be similarities between these molecules based on one of these factors, the use of all three data points can be utilized to distinguish and differentiate biochemicals. More than 3,300 commercially available purified standard compounds have been acquired for analysis on all platforms to determine their analytical characteristics. Additional mass spectral entries have been created for structurally unnamed biochemicals, which have been identified by virtue of their recurrent nature (both chromatographic and mass spectral). These compounds have the potential to be identified by future acquisition of a matching purified standard or by classical structural analysis. Library matches for each compound were checked for each sample and corrected if necessary. All named compounds fulfill tier 1 or tier 2 (indicated by an asterisk) criteria according to the metabolomics reporting standards outlined in Sumner et al.41.
Peaks were quantified using the area under the curve. We performed run day normalization to correct variation resulting from instrument inter-day tuning differences. Essentially, each compound was corrected in run day blocks by registering the medians to equal one (1.00) and normalizing each data point proportionately.
Before the statistical analyses, metabolite levels were transformed using the natural logarithm; values at the tail of the distribution, defined by the mean ± 5 × s.d., were replaced by the respective lower/upper bound. Metabolite measures were then rescaled to a mean of zero and s.d. of one. Processing steps were performed for each of the two batches separately. To achieve comparable estimates, all continuous cross-sectional traits at baseline (Supplementary Table 2) were processed in the same way as the metabolome data except for log-transformation for most of the traits.
Statistical analyses.
Cox proportional hazards models and multiple testing correction.
We first used Cox proportional hazards models to estimate HRs for the association of metabolite levels (log-transformed and standardized) with each incident disease, with age as the underlying timescale adjusting for sex unless otherwise noted. In the case of prostate (males), endometrial, ovarian and breast cancer (females) only participants of that specific sex were included in the analyses. Cox models were constructed separately for each sub-cohort and the associations were meta-analyzed using the R package metafor (v2.4.0). Participants who reported diseases at baseline or who had incident cancer within the first six months of follow-up were excluded from the analyses for that specific disease.All participants who reported a previous diagnosis of cancer at baseline were excluded from all cancer analyses. A modifying effect of sex was tested by inclusion of an interaction term in the Cox models. For each metabolite–end point model separately, we excluded participants with missing values in any of the two variables.
We applied a two-stage approach to define first shared and subsequently disease-specific associations. To increase power to detect shared associations with rare outcomes, such as stomach cancer, we applied a threshold of P < 0.001 (accounting for 28 outcomes per metabolite). We report significant associations for each outcome based on a stringent Bonferroni threshold accounting for the number of metabolites tested (P < 0.05/1,014) and declare a metabolite to be specifically associated with a disease if the association passed the more stringent threshold (P < 0.05/1,014) and was not associated with any other outcome at a liberal level of significance (P < 0.001).
We used logistic regression models to test for possible misspecifications of time-to-event data. To test whether participants already diseased but yet undiagnosed at baseline might have influenced the effect estimates, we (1) rerun all Cox models while subsequently excluding participants experiencing any event within the first 5 years in 1-year steps and (2) excluding all participants who died within the first 5 years of follow-up (n = 469).
Linear regression analysis and variance decomposition for baseline characteristics.
We assessed the relevance of clinical risk factors and traits measured at baseline in two ways: (1) we used linear regression models to test for an association between traits as exposure and metabolite levels as outcome adjusting for age, sex, fasting time and time of blood sampling; and (2) obtained the variance in metabolite levels explained by each trait using variance partitioning as implemented in the R package variancePartition (v1.14.1).
Extended Cox proportional hazards models and mediation analyses.
We evaluated the effects of confounders in longitudinal analyses using two different approaches. First, following the establishment of metabolite–disease onset and risk factor–metabolite associations, we performed formal mediation analysis assuming a linear dependency among risk factor–metabolite–diseases onset to test for a possible role of metabolites in mediating the association between risk factors and diseases42. We used Cox models to identify significant risk factor–disease onset associations in our data (P < 0.01) and tested only those triangles with consistent association directions along the putative path (n = 6,364). We computed the proportion of effect mediated from the risk factor through the metabolite (indirect effect of the risk factor) as the quotient between the indirect and total effect of the risk factor on the disease. An indirect effect with P < 7.8 × 10⁻⁶ was considered significant to account for the number of tests. The proposed relationship might not hold true for every tested association and in particular mediation analysis is not suited to distinguish mediation from confounding. However, by using this approach we linked and quantified the effects of risk factors on the presented metabolite–disease onset associations. None of the presented significant findings imply causality but from an etiological perspective such analysis can provide hints on putative disease pathways that otherwise would have been missed using a resolute prediction framework. We then used a set of most common exposures as additional covariates in multivariable adjusted Cox models to test for the persistence of associations, including body mass index, waist-to-hip ratio, smoking behavior, serum uric acid concentrations, total triglycerides, HDL cholesterol, random glucose, serum alkaline phosphatase concentrations, serum vitamin C concentrations, systolic blood pressure and plasma fibrinogen concentrations. Due to missing availability of confounder data for some individuals, the total number of included individuals included in this analysis dropped to a maximum of 9,427.
Logistic regression models for multimorbidity.
We defined NCD multimorbidity as developing two or more ICD-10-coded diseases during follow-up; logistic regression models were used to test for an association between metabolite levels and this binary outcome. To avoid confounding by diseases present at baseline, we excluded all participants reporting at least one of the diseases under investigation at baseline, leaving 5,699 participants to be included in these analyses. Models were adjusted for age and sex.
We used hierarchical clustering analysis (with complete linkage) to group metabolites based on absolute Pearson correlations as measure of similarity. The number of clusters was determined using silhouette coefficients.
Figures were created using the basic plot functions of R as well as the R package circlize (v0.4.9). All statistical analyses were done using R v.3.5.1.
Reporting Summary.
Further information on research design is available in the Nature Research Reporting Summary linked to this article.
Data availability
We have provided open access to all summary statistics for academic use through an interactive web server. The EPIC-Norfolk data can be requested by bona fide researchers for specified scientific purposes via the study website (https://www.mrc-epid.cam.ac.uk/research/studies/epic-norfolk/). Data will either be shared through an institutional data sharing agreement or arrangements will be made for analyses to be conducted remotely without the need for data transfer.
Code availability
Any code used in the present analysis is freely available to academic researchers upon request from the corresponding author.
Extended Data
Extended Data Fig. 1 |. Summary of event distribution during follow-up.
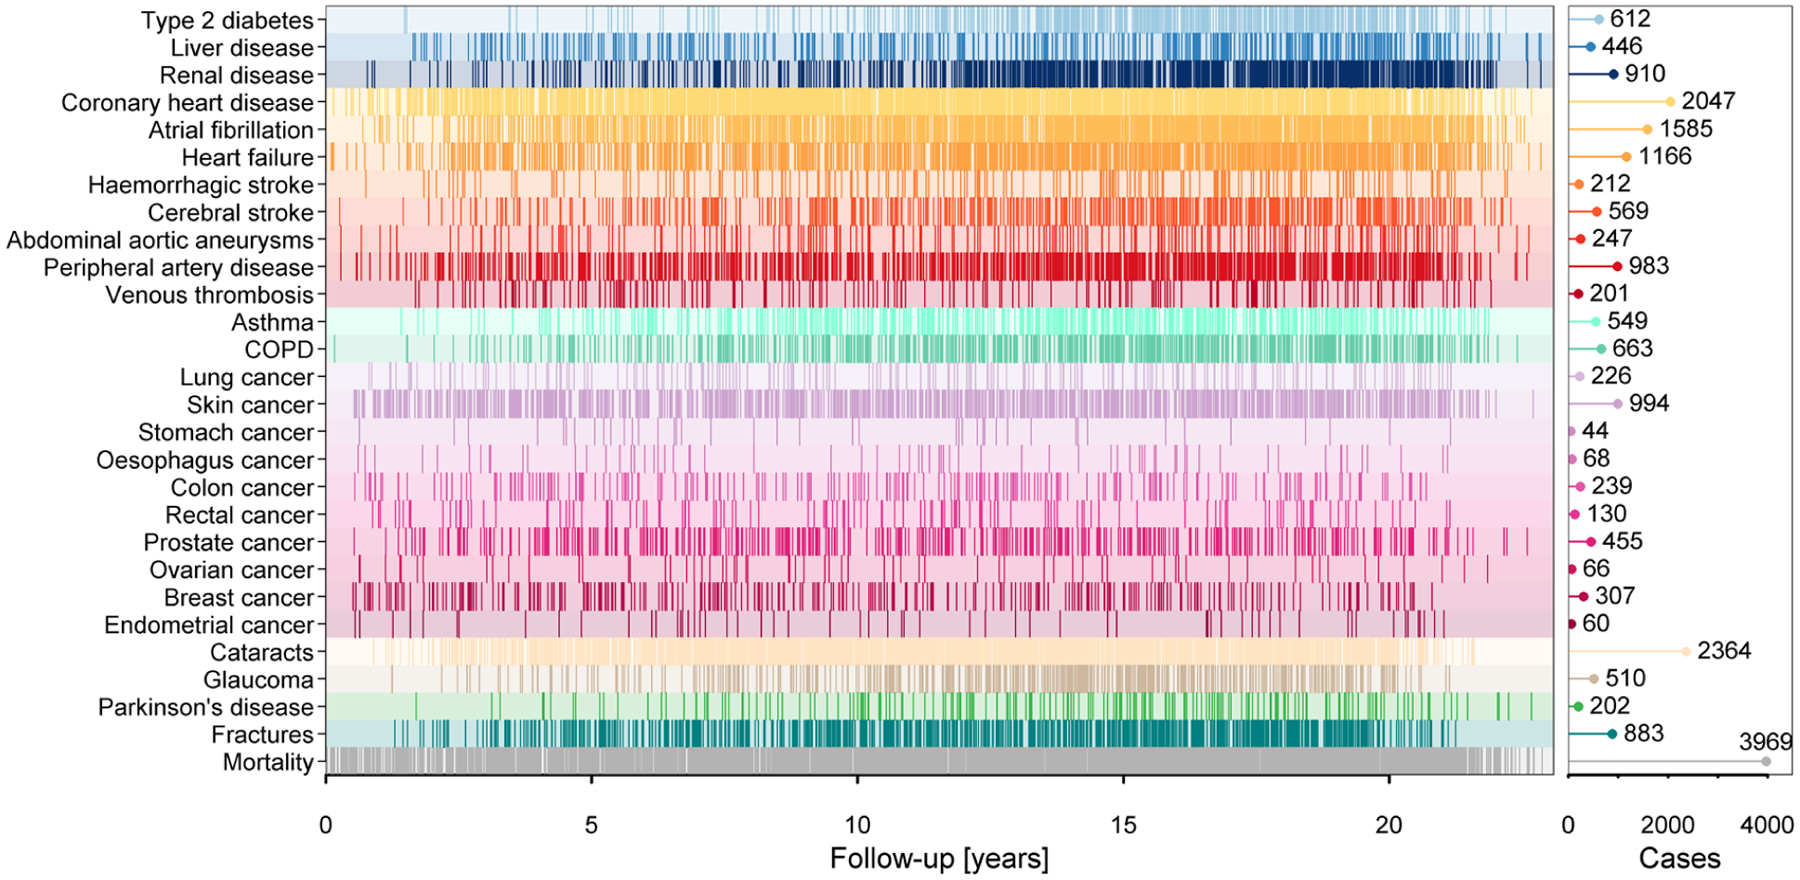
Occurrence of events during follow-up. Each line indicates an event. The pin plot on the right gives the total number of cases for each disease. COPD=chronic obstructive pulmonary disease.
Extended Data Fig. 2 |. Manhattan-like plot summarizing results from Cox proportional hazard models.

Mirrored Manhattan-like plot showing the p-values from Cox proportional hazard models using metabolite levels as exposure and disease onset as outcome adjusting for age and sex. Colours indicate metabolite classes (see Fig. 1 in main text for a legend) and numbers on top indicate number of significantly associated metabolites (p < 4.93 × 10⁻⁵). Grey dots indicate associations not reaching significance. Positive associations are displayed in the upper panel and inverse associations in the lower. COPD=chronic obstructive pulmonary disease.
Extended Data Fig. 3 |. Top five associated metabolites with each outcome.
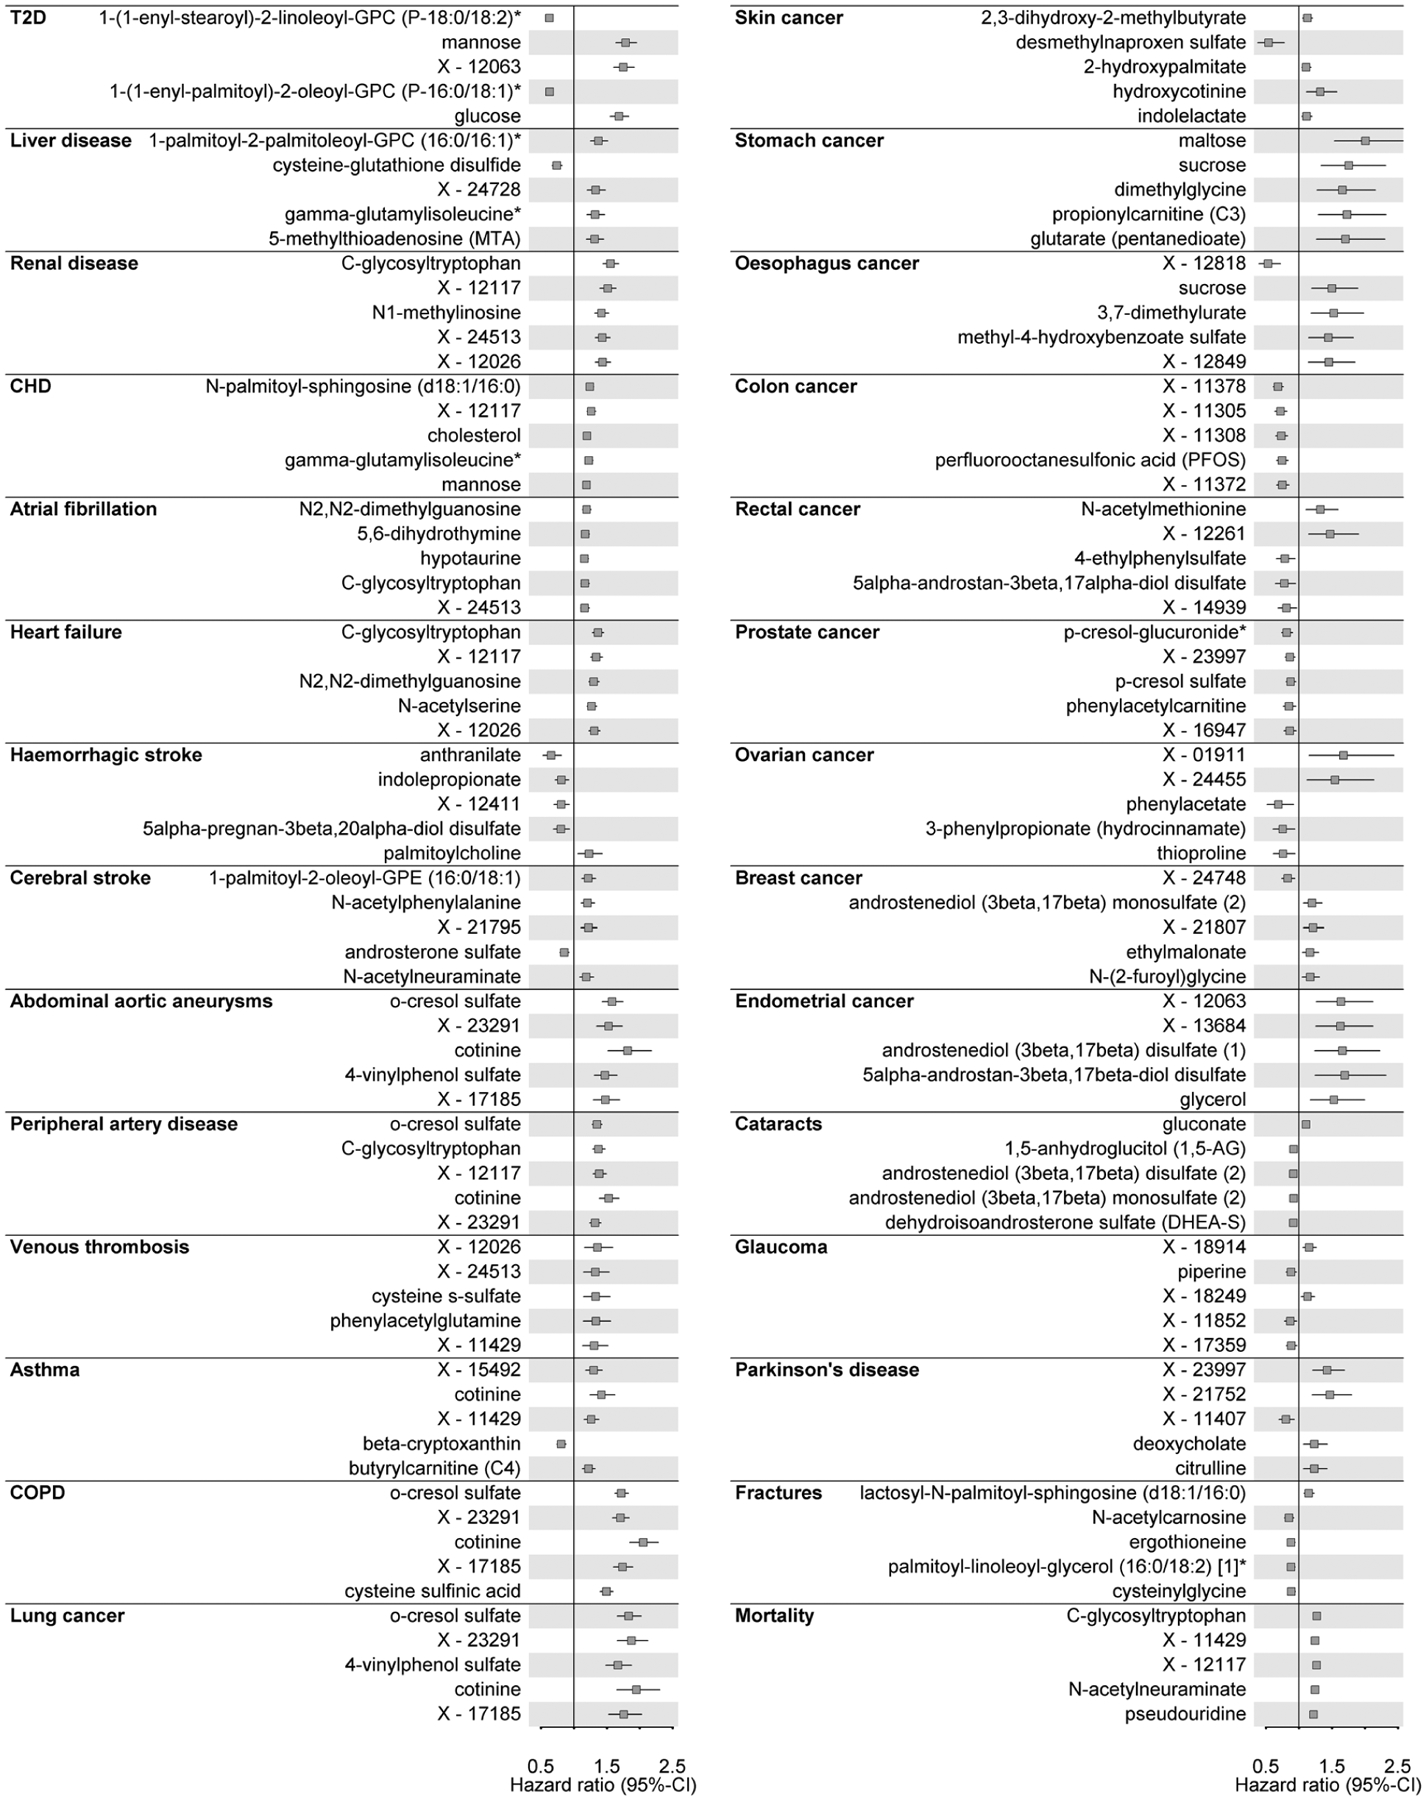
For each incident disease under investigation hazard ratios with 95%-confidence intervals for the five metabolites with the lowest p-value are shown. Cox models with age as underlying scale were adjusted for sex. T2D=type 2 diabetes mellitus; CHD=coronary heart disease.
Extended Data Fig. 4 |. Relation between cases numbers and associated metabolites.
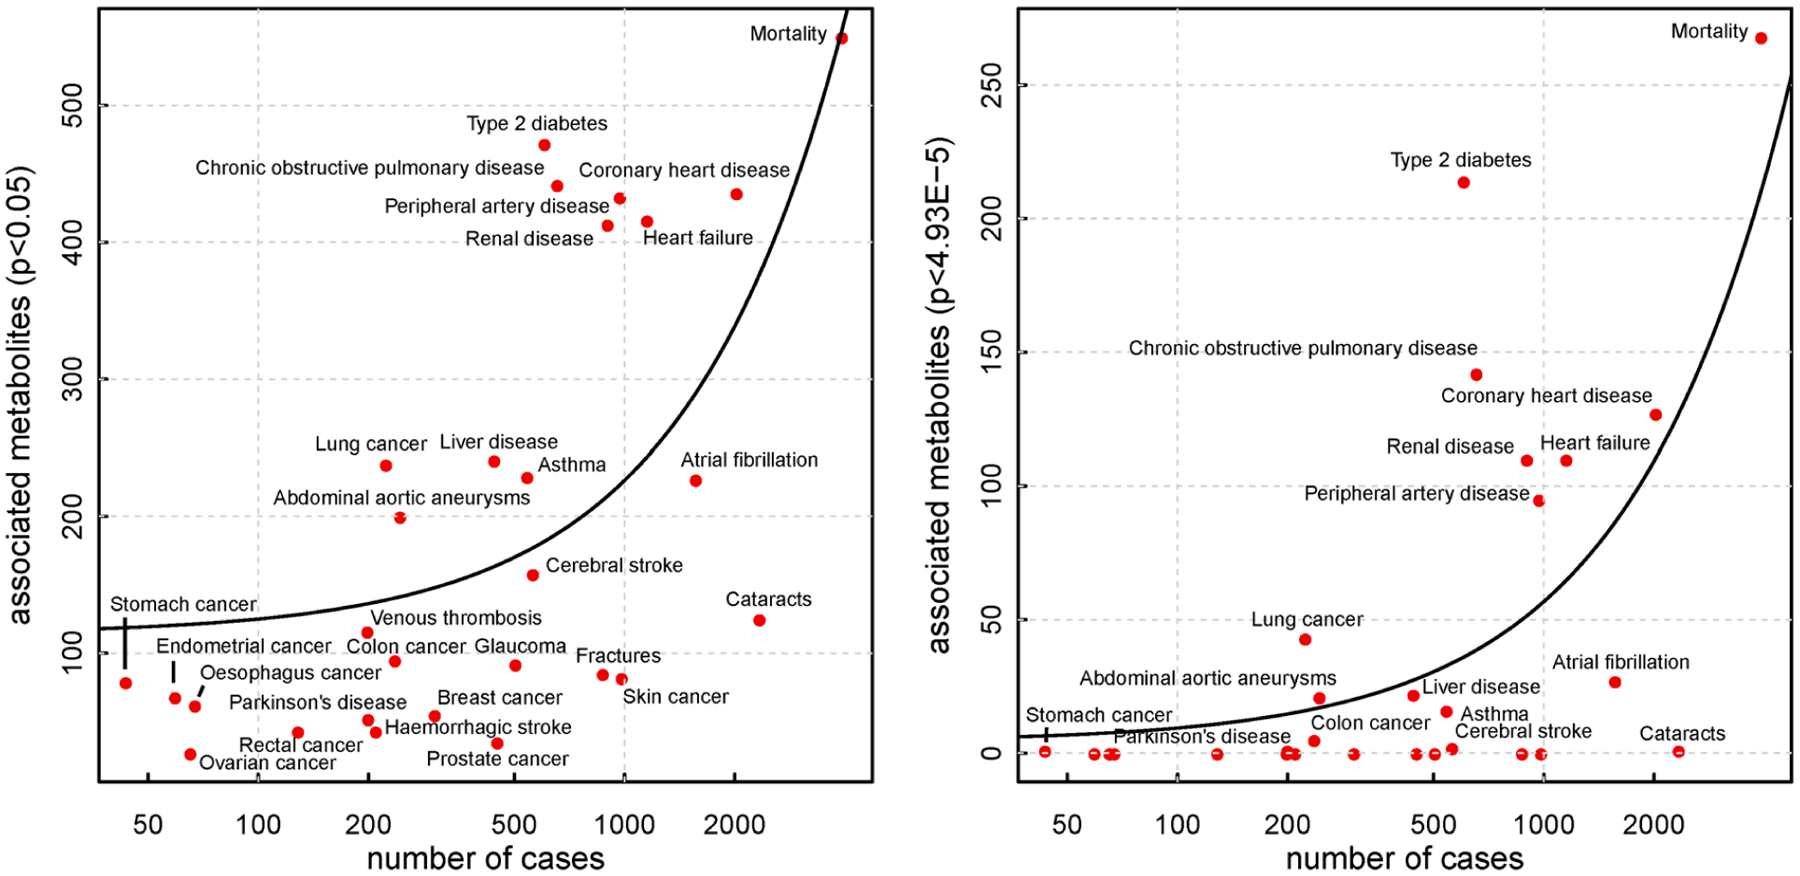
Number of cases against number of significantly associated metabolites for all incident diseases and all-cause mortality, for associations with nominal significance (left) and Bonferroni corrected significance (right panel). The black line indicates a linear fit between both.
Extended Data Fig. 5 |. Summary of sensitivity analysis.
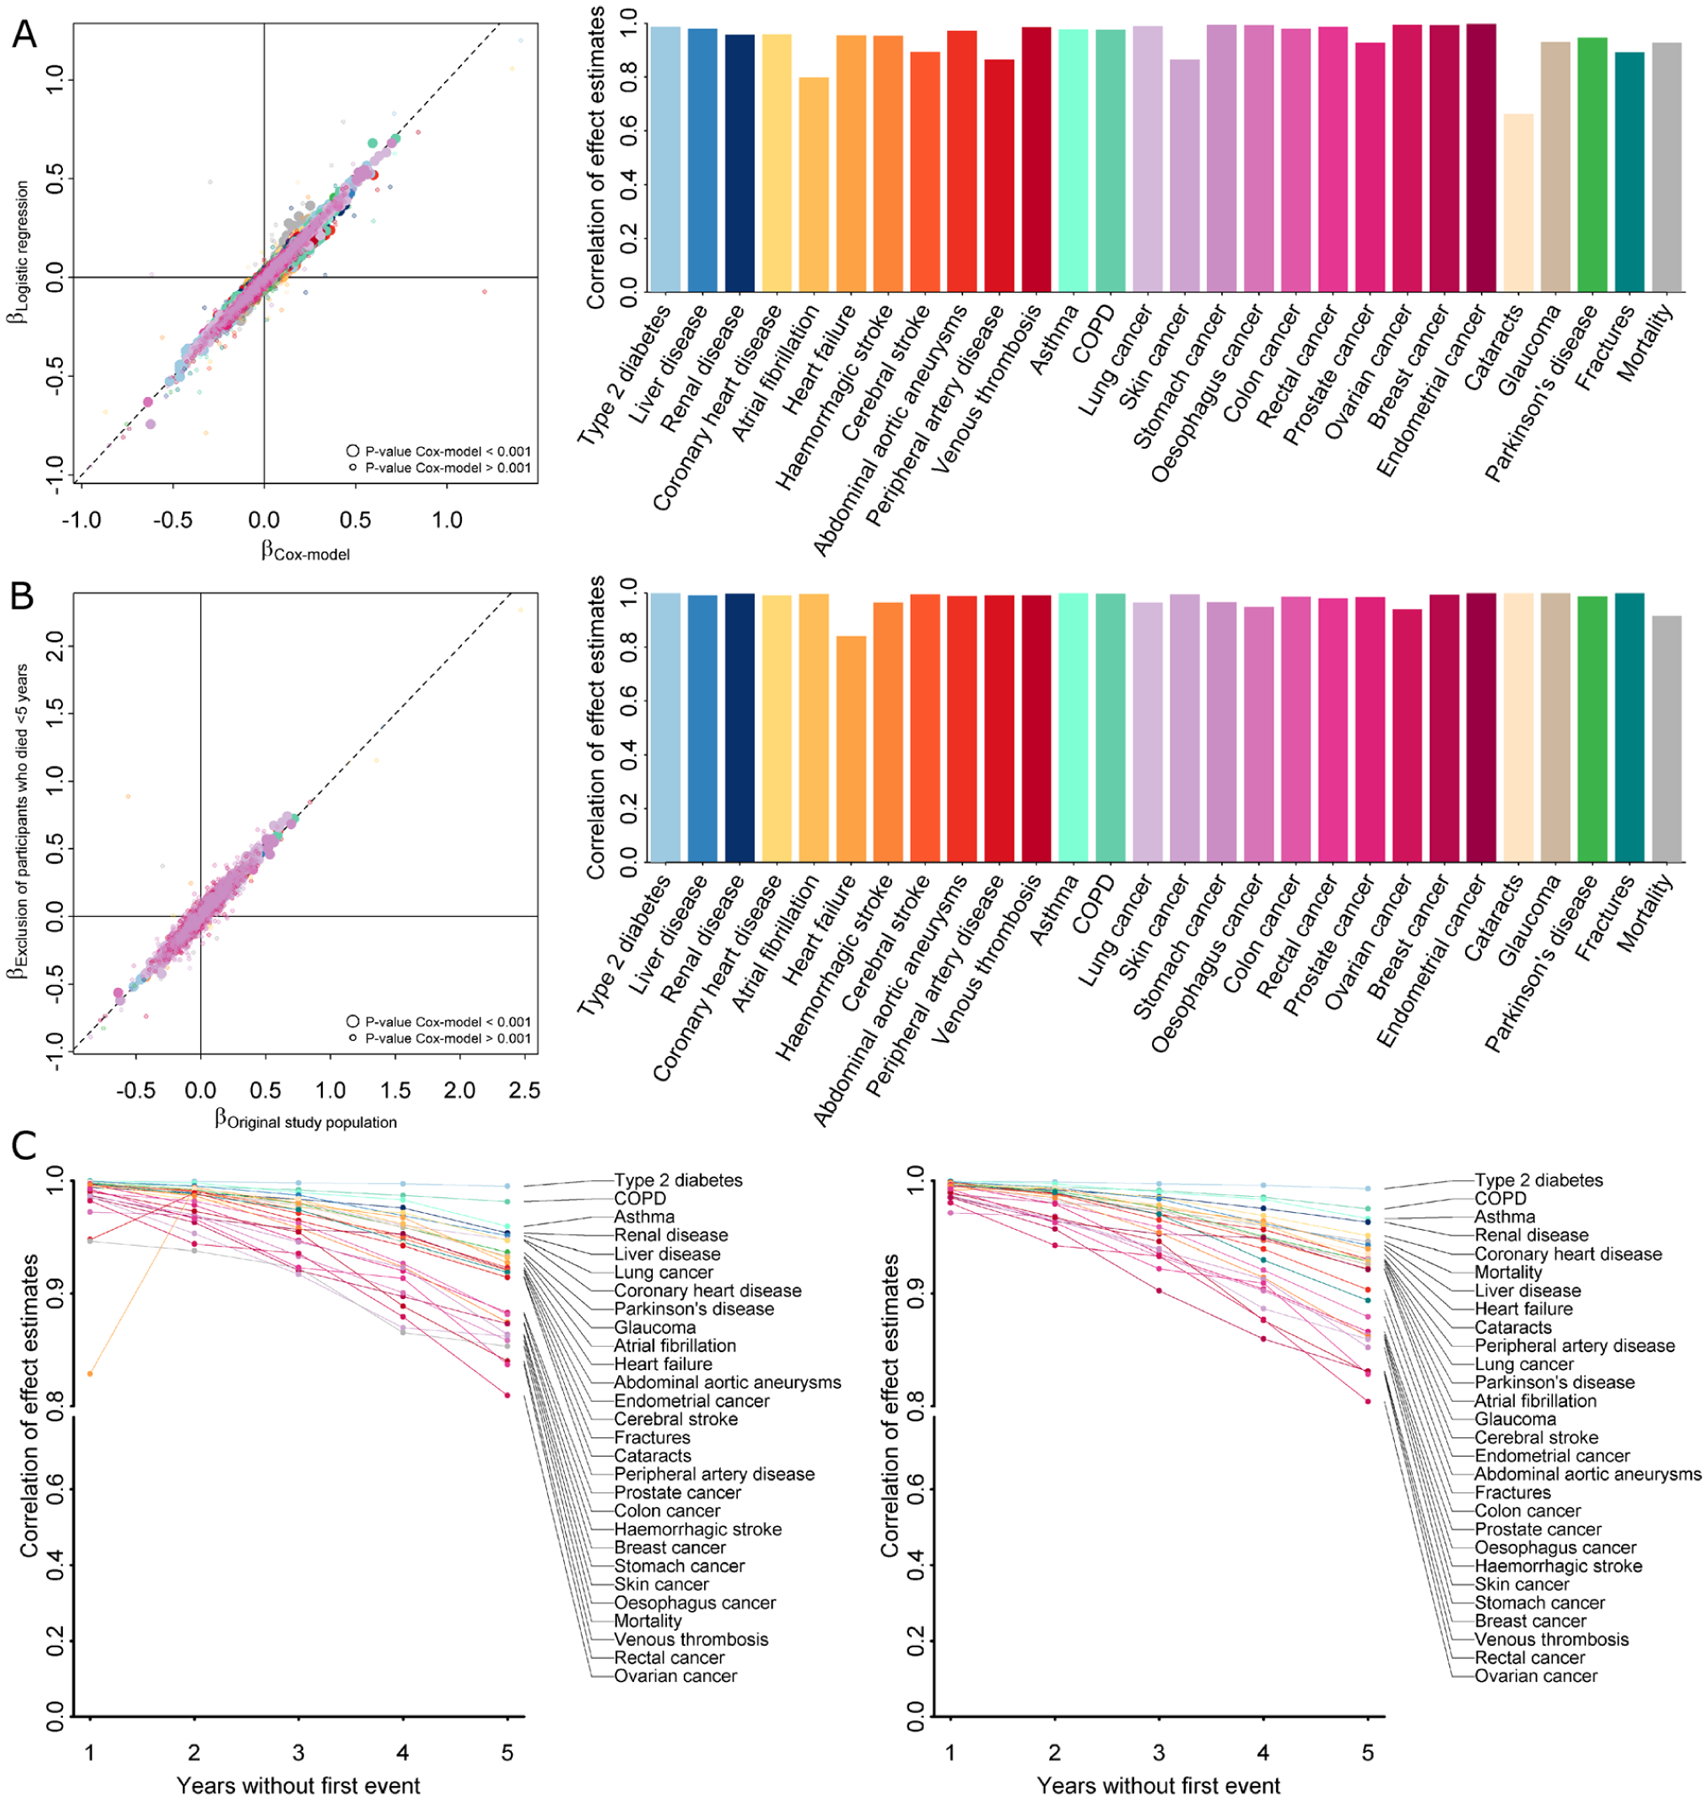
A Left panel opposes effect estimates from Cox proportional hazard models (x-axis) with those from logistic regression models (y-axis) using binary event data only. Points are coloured by incident endpoints as labelled on the right and larger points indicate metabolite—disease pairs with p < 0.001. The right panel shows correlation coefficients for effect estimates across all metabolites for a given incident endpoint. B Left panel opposes effect estimates from Cox proportional hazard models (x-axis) including the whole study population with exclusion criteria applied as mentioned in the main text with those from further excluding 469 participants who have died within the first five years after baseline examinations (y-axis). Points are coloured by incident endpoints as labelled on the right and larger points indicate metabolite—disease pairs with p < 0.001. The right panel shows correlation coefficients for effect estimates across all metabolites for a given incident endpoint. C Pearson (left) and Spearman (right) correlation coefficients of effect estimates from Cox proportional hazard models comparing initial results as described in the main text with successive exclusion of participants experiencing any event (excluding all-cause mortality) within the first five years of follow-up.
Extended Data Fig. 6 |. Results testing for a modulating effect of sex.
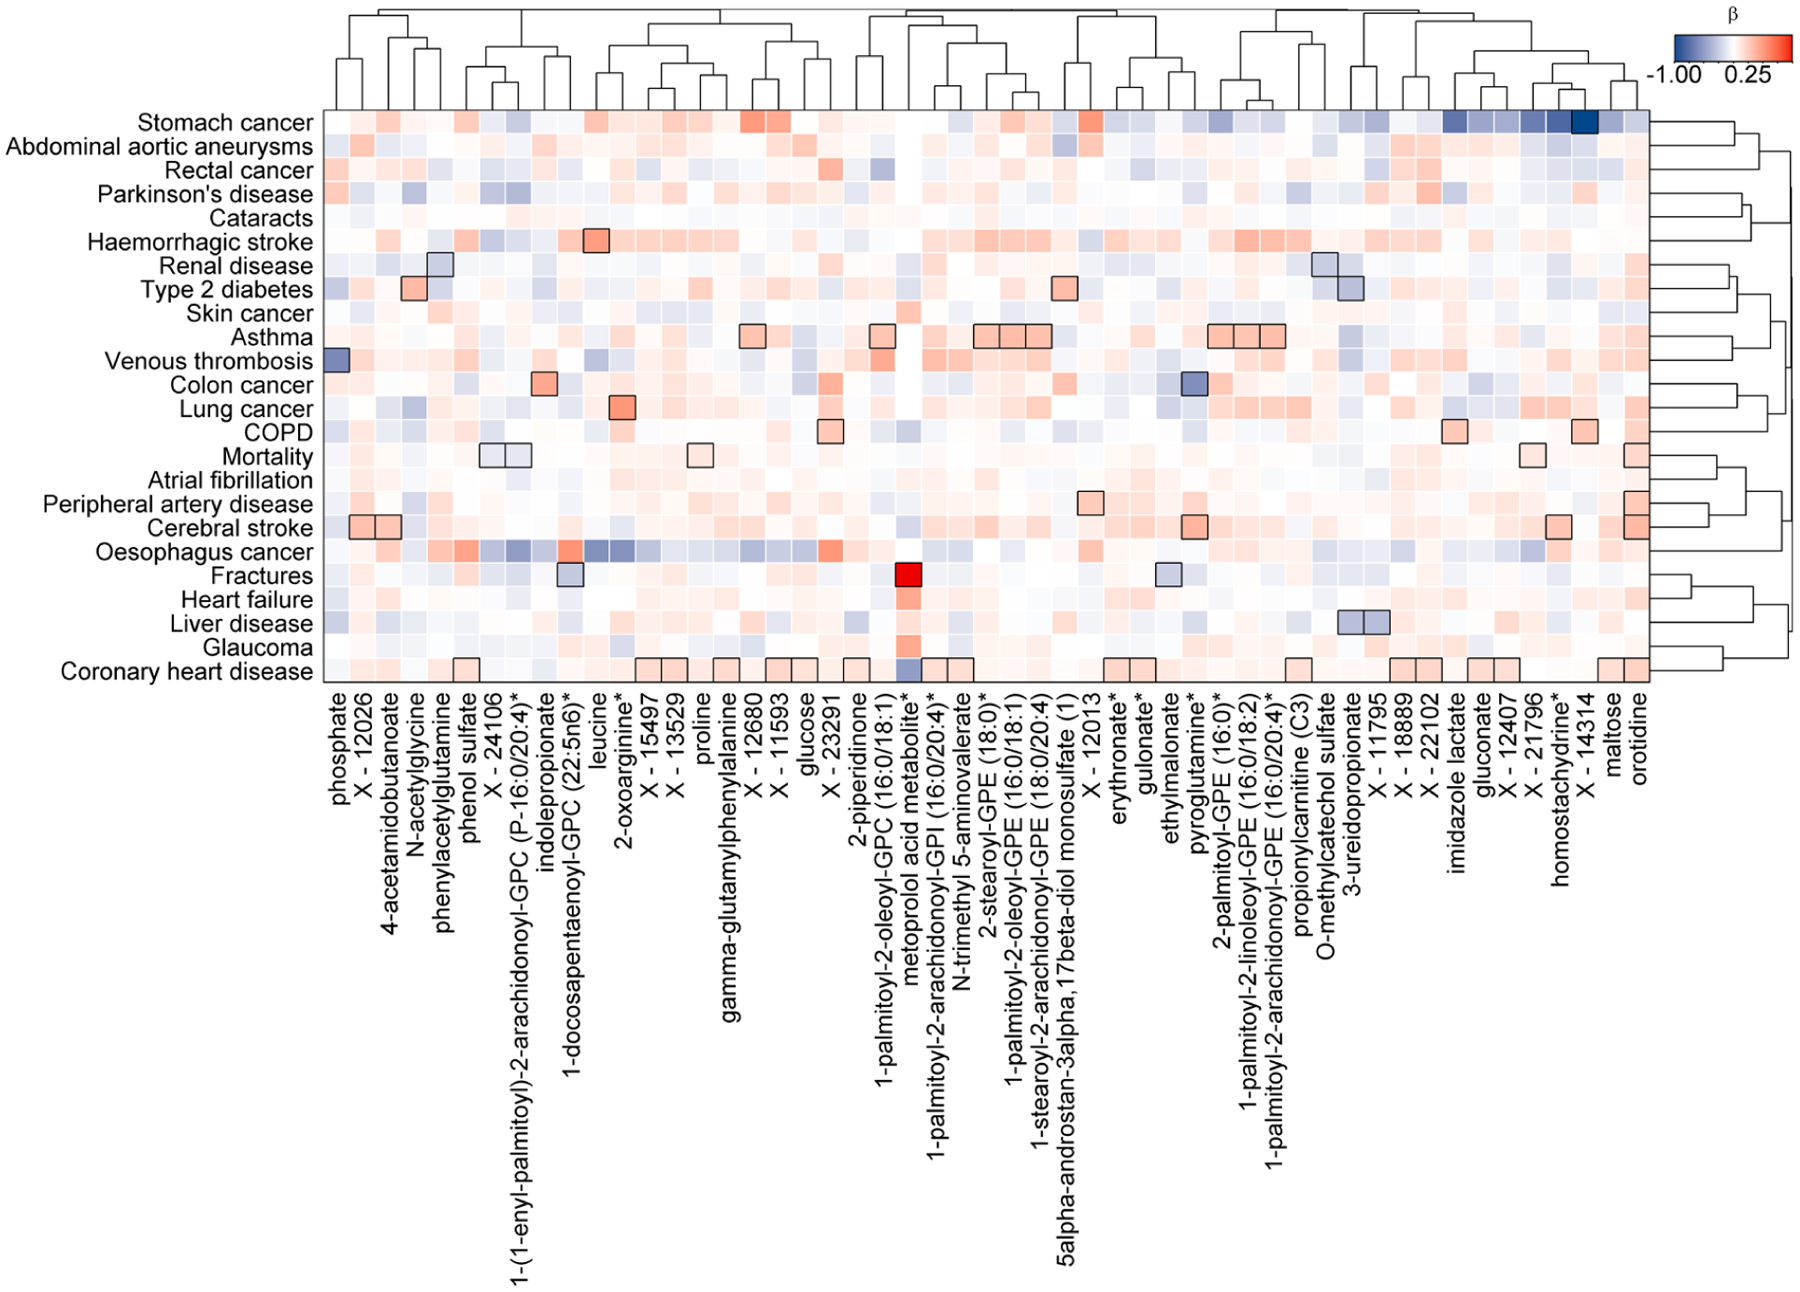
Colour coded heatmap of β-estimates for a sex-metabolite interaction term in Cox proportional hazard models. Cox models were run with the metabolite, sex, and a sex-metabolite interaction term as exposure and disease onset as outcome with age as the underlying time scale. Red shades indicate a stronger effect among women, whereas blue indicates the opposite. Rectangles surrounded with a black frame indicate a p-value<0.001 correcting for 28 outcomes tested for each metabolite.
Extended Data Fig. 7 |. Amount of variance explained in plasma levels of metabolites by different risk factors at baseline.
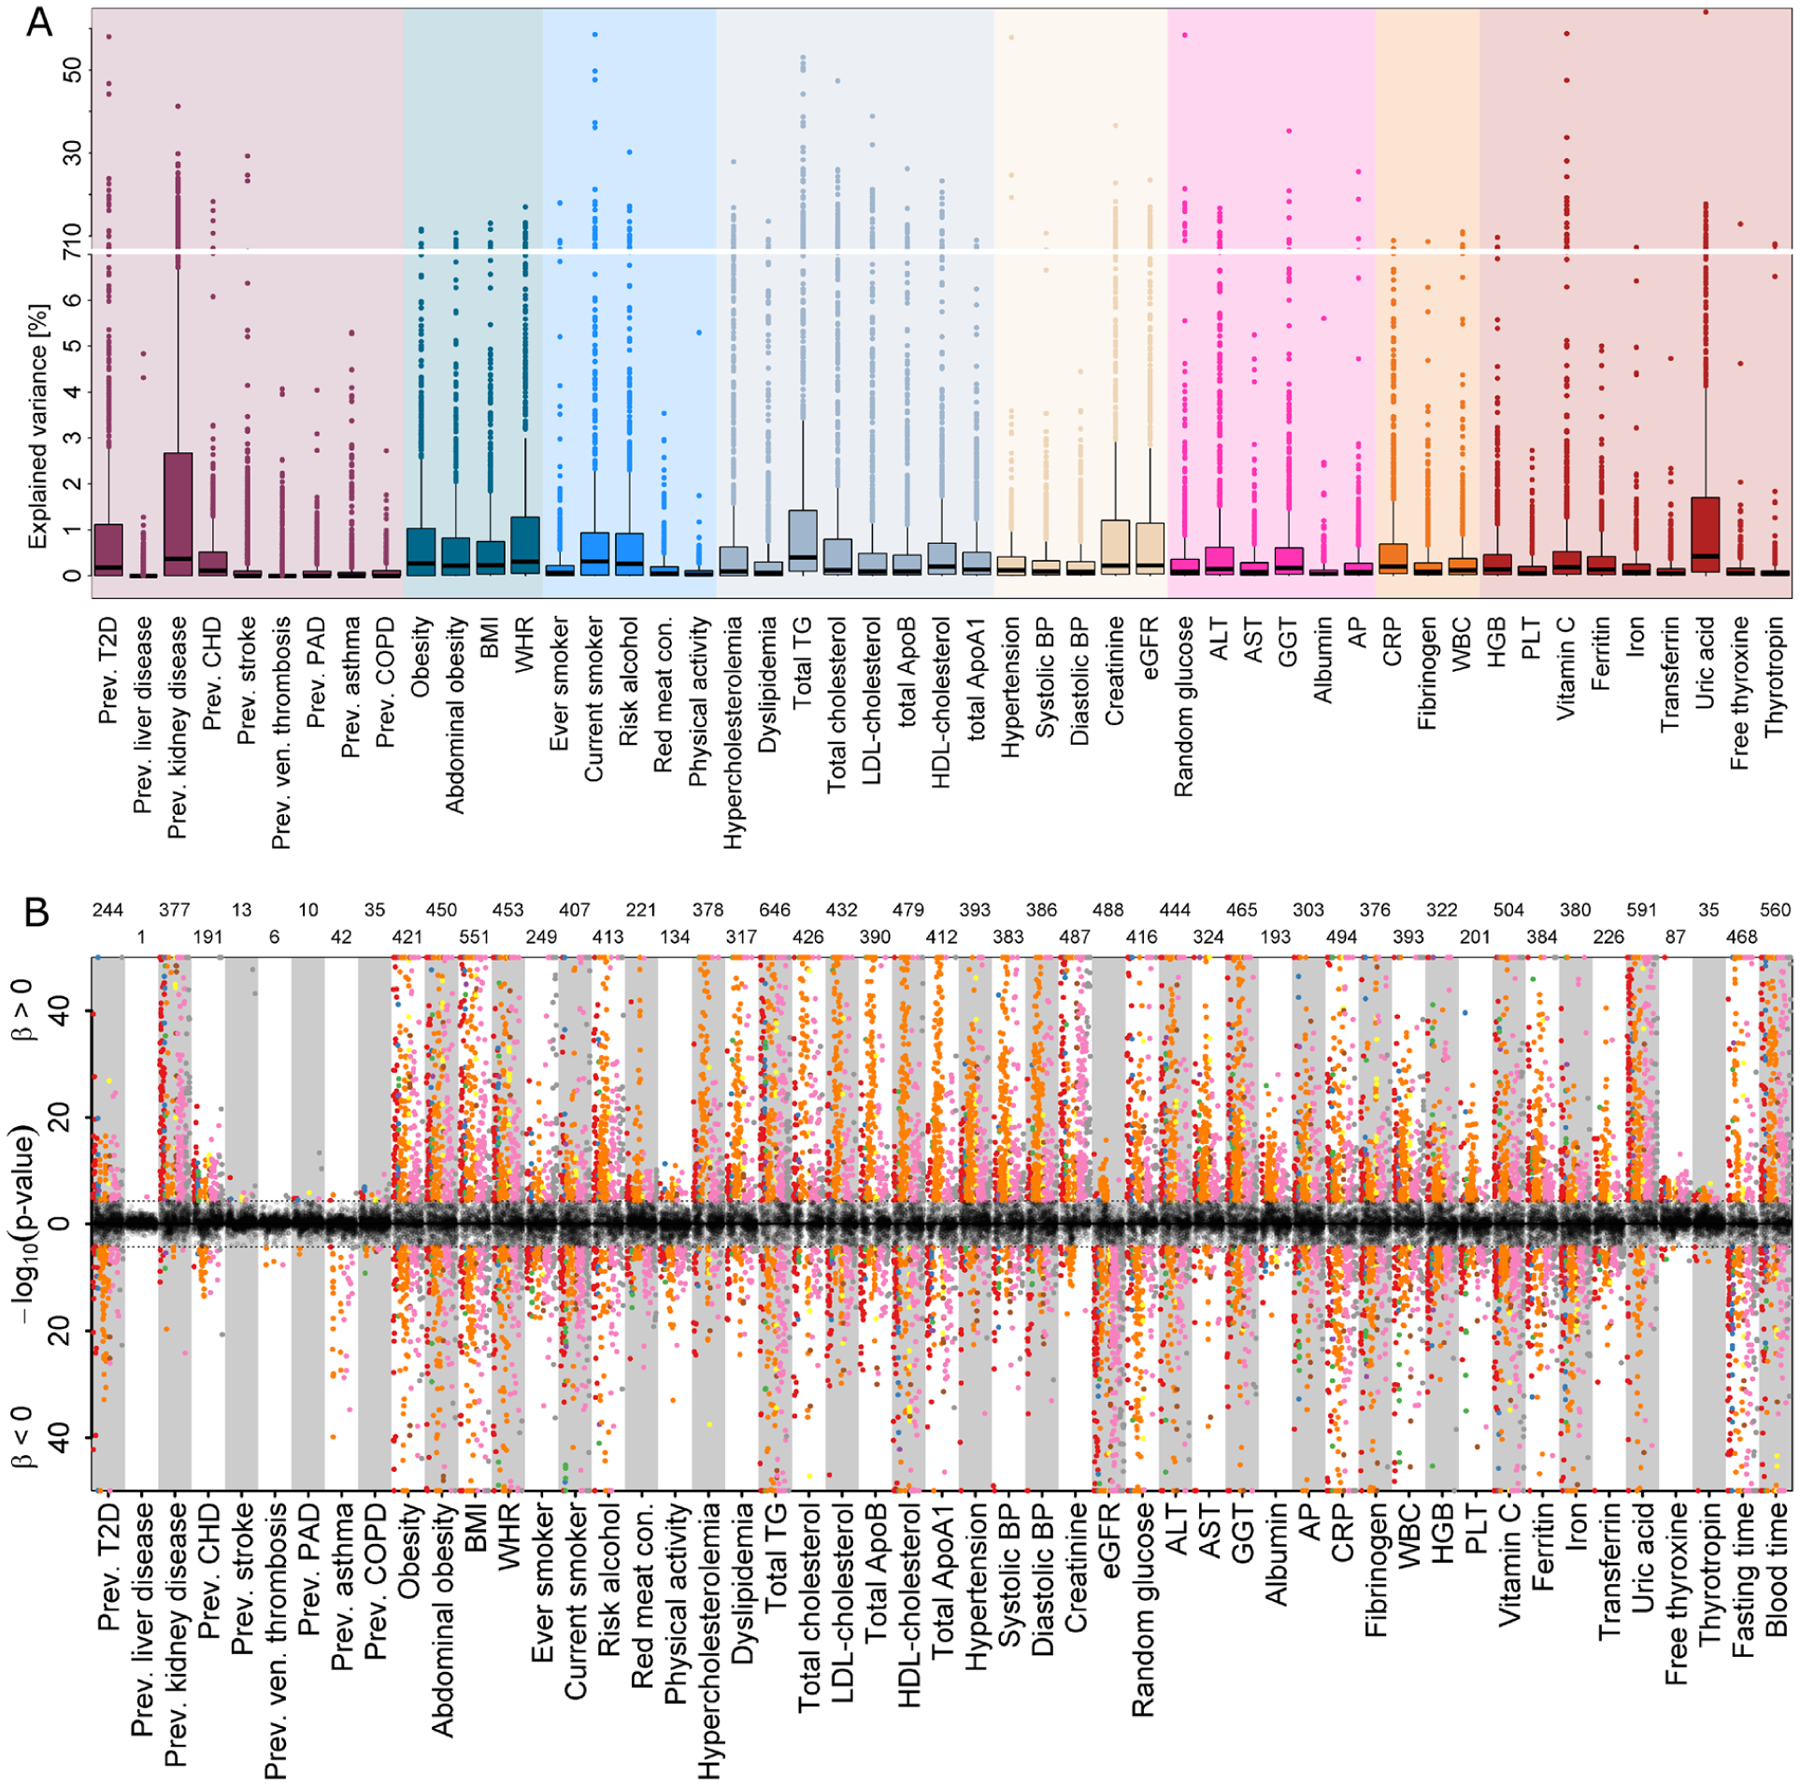
A Results from variance decomposition analysis of plasma metabolites levels using information on 50 baseline characteristics. Each trait was treated separately to avoid collinearity in a model comprising age, sex, blood sampling time, and fasting duration. B Mirrored Manhattan-like plot showing the p-values from linear regression models using one of the traits on the x-axis as exposure and metabolite levels as outcome adjusting for age and sex. Colours indicate metabolite classes and numbers on top indicate number of significantly associated metabolites (p < 4.93 × 10⁻⁵). Grey dots indicate associations not reaching significance. Positive associations are displayed in the upper panel and inverse associations in the lower. Labels are explained in Supplementary Table 2.
Extended Data Fig. 8 |. Results from Cox models testing risk factors and outcomes.
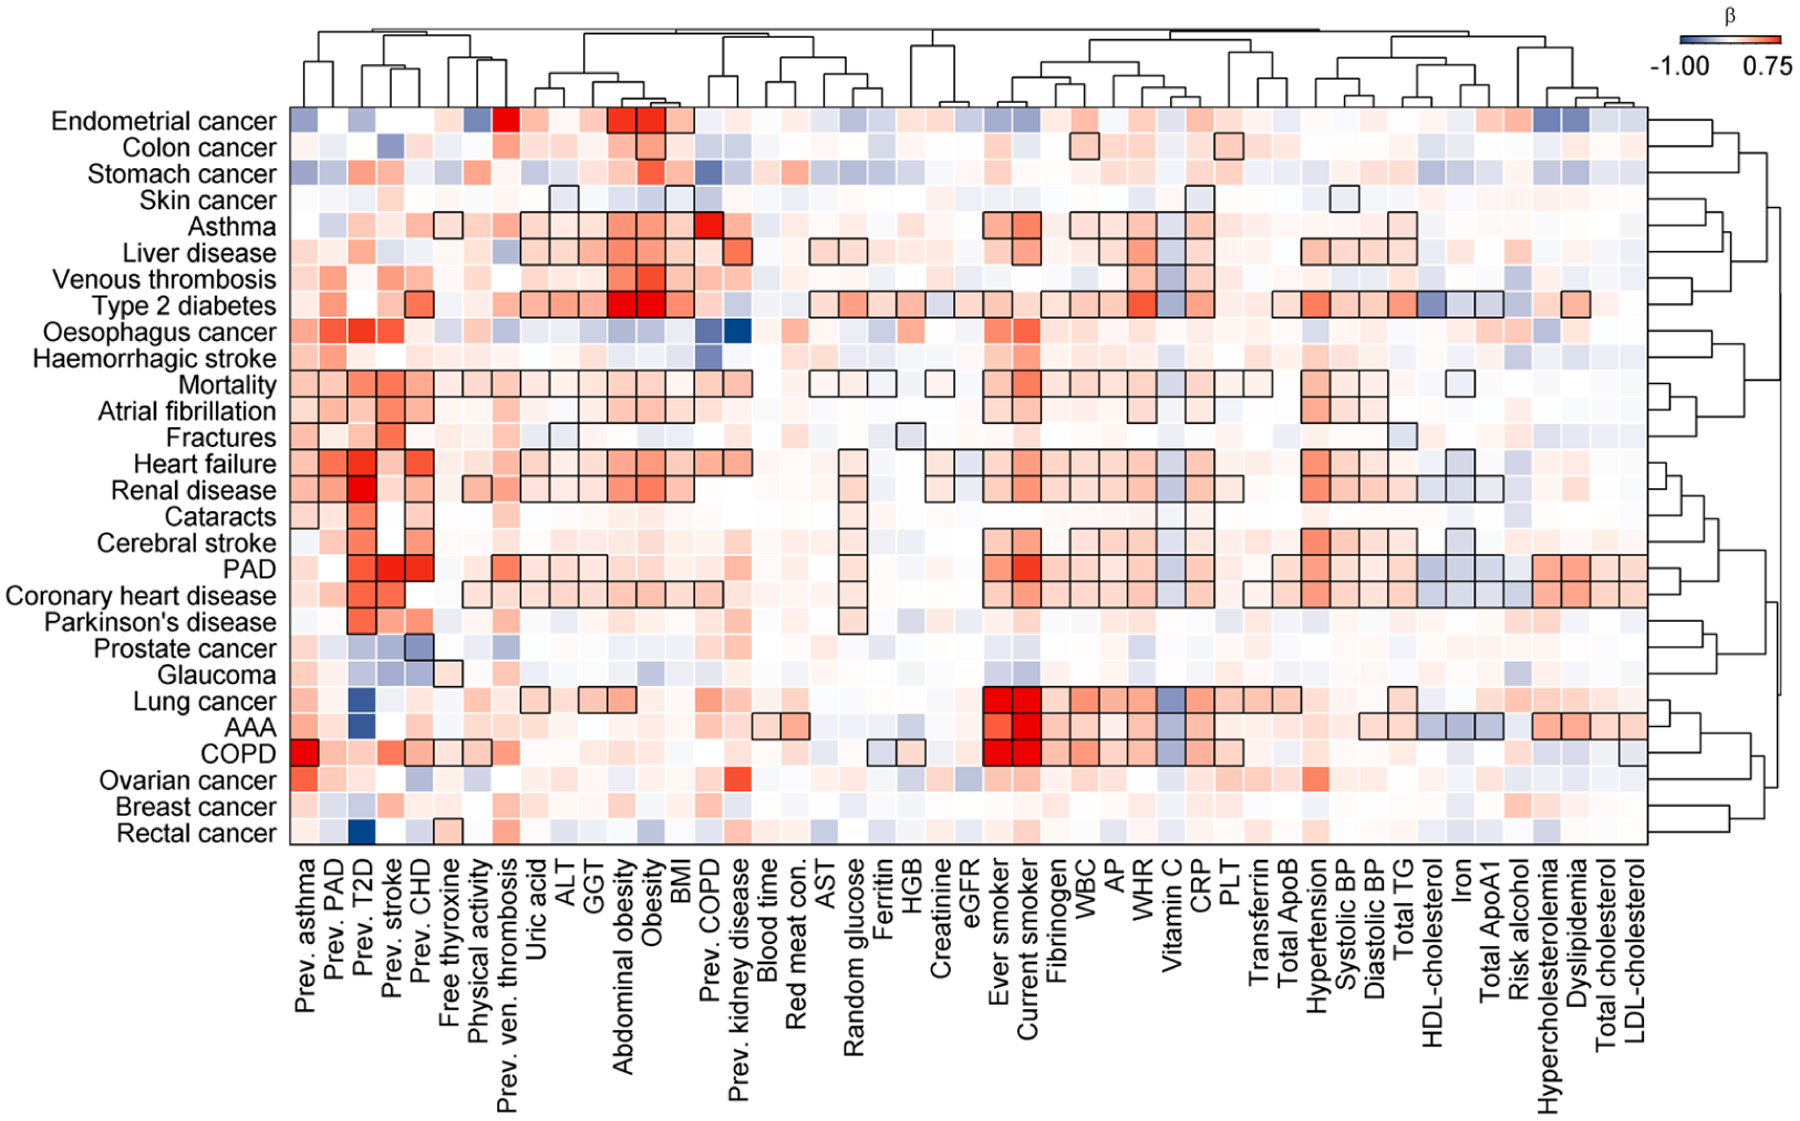
Colour coded heatmap of β-estimates from Cox proportional hazard models. Results are restricted to significantly associated (p < 0.01; black frames) cross-sectional traits of at least one incident disease. Positive associations are indicated in red, whereas inverse associations are blue. Diseases and cross-sectional traits were ordered using hierarchical clustering with absolute correlations as distance. All abbreviations are listed in Supplementary Table 2.
Extended Data Fig. 9 |. Amount of effect mediated from a risk factor onto an outcome through a specific metabolite.
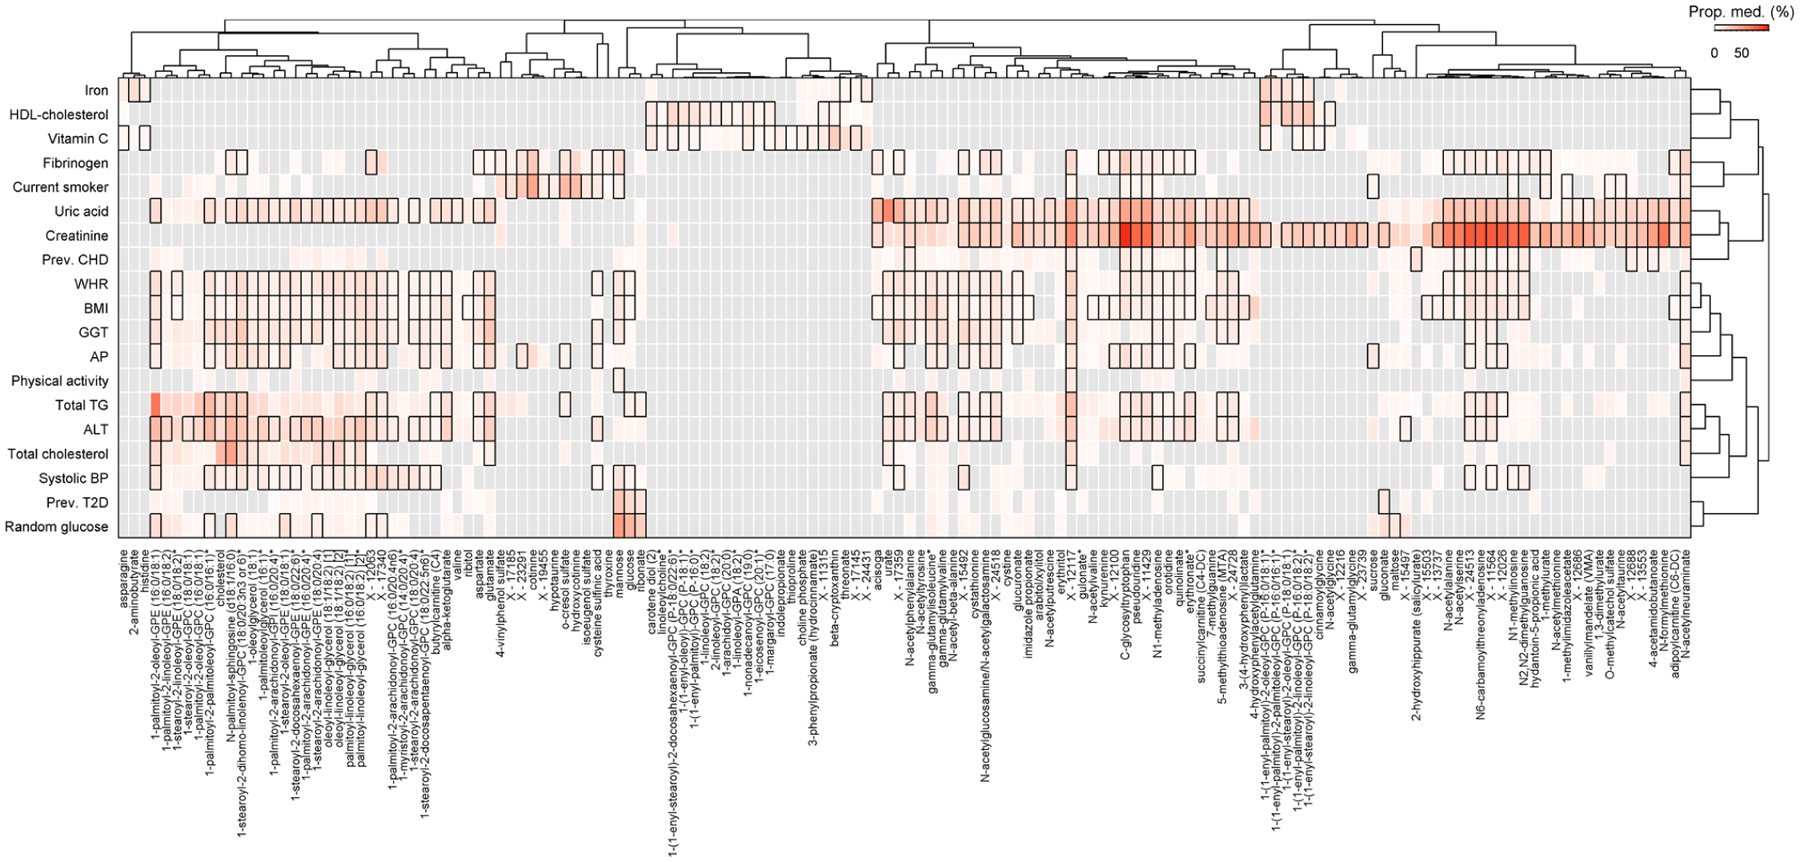
Heatmap of risk factor—metabolite pairs with a significant indirect effect of the risk factor on at least one of the diseases under investigation. Colouring was done based on the median proportion mediated by a metabolite across all diseases. The proportion mediated was derived as quotient of the main effect from two different Cox proportional hazed models, one with and one without adjusting for the metabolite and both including the risk factor as main exposure. Boxes indicate corrected statistical significance with at least one disease (p < 0.05/6,364) and grey shades indicate not tested due to missing requirements for mediation analysis.
Extended Data Fig. 10 |. Pairwise correlation heatmap of multimorbidity candidate metabolites.

Pairwise correlation matrix of plasma metabolites significantly associated with the incidence of NCD multimorbidity. Colours indicate positive (red) or inverse (blue) correlations and black frames indicate statistical significance after correction for multiple testing. Metabolites were clustered based on correlation profiles using hierarchical clustering.
Supplementary Material
Acknowledgements
We thank all the participants who have been part of the project and the many members of the study teams at the University of Cambridge who enabled this research. The EPIC-Norfolk study (https://doi.org/10.22025/2019.10.105.00004) has received funding from the Medical Research Council (nos. MR/N003284/1 and MC-UU_12015/1) and Cancer Research UK (no. C864/A14136). Metabolite measurements in the EPIC-Norfolk study were supported by the MRC Cambridge Initiative in Metabolic Science (no. MR/L00002/1) and the Innovative Medicines Initiative Joint Undertaking under European Medical Information Framework grant agreement no. 115372. M.P. was supported by a fellowship of the German Research Foundation (no. 1446/2-1). J.R. is supported by the German Federal Ministry of Education and Research within the framework of the e:Med research and funding concept (grant no. 01ZX1912D). G.K. is supported by grants from the National Institute on Aging (NIA): R01 AG057452, RF1 AG058942, RF1 AG059093, U01 AG061359 and U19 AG063744 and by a grant from the German Federal Ministry of Education and Research (BMBF): 01GM1906C.
Footnotes
Online content
Any methods, additional references, Nature Research reporting summaries, source data, extended data, supplementary information, acknowledgements, peer review information; details of author contributions and competing interests; and statements of data and code availability are available at https://doi.org/10.1038/s41591-021-01266-0.
Competing interests
G.A.M. is an employee of Metabolon. All other authors declare no competing interests.
Extended data is available for this paper at https://doi.org/10.1038/s41591-021-01266-0.
Supplementary information The online version contains supplementary material available at https://doi.org/10.1038/s41591-021-01266-0.
Peer review information Jennifer Sargent was the primary editor on this article and managed its editorial process and peer review in collaboration with the rest of the editorial team.
References
- 1.Karczewski KJ & Snyder MP Integrative omics for health and disease. Nat. Rev. Genet 19, 299–310 (2018). [DOI] [PMC free article] [PubMed] [Google Scholar]
- 2.Zhou W et al. Longitudinal multi-omics of host–microbe dynamics in prediabetes. Nature 569, 663–671 (2019). [DOI] [PMC free article] [PubMed] [Google Scholar]
- 3.Alpert A et al. A clinically meaningful metric of immune age derived from high-dimensional longitudinal monitoring. Nat. Med 25, 487–495 (2019). [DOI] [PMC free article] [PubMed] [Google Scholar]
- 4.Schüssler-Fiorenza Rose SM et al. A longitudinal big data approach for precision health. Nat. Med 25, 792–804 (2019). [DOI] [PMC free article] [PubMed] [Google Scholar]
- 5.Hoyles L et al. Molecular phenomics and metagenomics of hepatic steatosis in non-diabetic obese women. Nat. Med 24, 1070–1080 (2018). [DOI] [PMC free article] [PubMed] [Google Scholar]
- 6.Barnett K et al. Epidemiology of multimorbidity and implications for health care, research, and medical education: a cross-sectional study. Lancet 380, 37–43 (2012). [DOI] [PubMed] [Google Scholar]
- 7.Yao S-S et al. The prevalence and patterns of multimorbidity among community-dwelling older adults in China: a cross-sectional study. Lancet 392, S84 (2018). [Google Scholar]
- 8.Lebenbaum M, Zaric GS, Thind A & Sarma S Trends in obesity and multimorbidity in Canada. Prev. Med 116, 173–179 (2018). [DOI] [PubMed] [Google Scholar]
- 9.van Oostrom SH et al. Time trends in prevalence of chronic diseases and multimorbidity not only due to aging: data from general practices and health surveys. PLoS ONE 11, e0160264 (2016). [DOI] [PMC free article] [PubMed] [Google Scholar]
- 10.Hussin NM et al. Incidence and predictors of multimorbidity among a multiethnic population in Malaysia: a community-based longitudinal study. Aging Clin. Exp. Res 31, 215–224 (2019). [DOI] [PubMed] [Google Scholar]
- 11.Guasch-Ferré M et al. Metabolomics in prediabetes and diabetes: a systematic review and meta-analysis. Diabetes Care 39, 833–846 (2016). [DOI] [PMC free article] [PubMed] [Google Scholar]
- 12.Whitty CJM et al. Rising to the challenge of multimorbidity. BMJ 368, l6964 (2020). [DOI] [PMC free article] [PubMed] [Google Scholar]
- 13.Partridge L, Deelen J & Slagboom PE Facing up to the global challenges of ageing. Nature 561, 45–56 (2018). [DOI] [PubMed] [Google Scholar]
- 14.Nicholson JK et al. Metabolic phenotyping in clinical and surgical environments. Nature 491, 384–392 (2012). [DOI] [PubMed] [Google Scholar]
- 15.Day N et al. EPIC-Norfolk: study design and characteristics of the cohort. European Prospective Investigation of Cancer. Br. J. Cancer 80, 95–103 (1999). [PubMed] [Google Scholar]
- 16.Liu J et al. Integration of epidemiologic, pharmacologic, genetic and gut microbiome data in a drug–metabolite atlas. Nat. Med 26, 110–117 (2020). [DOI] [PubMed] [Google Scholar]
- 17.Griffith OW & Meister A Glutathione: interorgan translocation, turnover, and metabolism. Proc. Natl Acad. Sci. USA 76, 5606–5610 (1979). [DOI] [PMC free article] [PubMed] [Google Scholar]
- 18.Soga T et al. Serum metabolomics reveals γ-glutamyl dipeptides as biomarkers for discrimination among different forms of liver disease. J. Hepatol 55, 896–905 (2011). [DOI] [PubMed] [Google Scholar]
- 19.Sommer A et al. The molecular basis of aminoacylase 1 deficiency. Biochim. Biophys. Acta 1812, 685–690 (2011). [DOI] [PubMed] [Google Scholar]
- 20.Gansevoort RT et al. Chronic kidney disease and cardiovascular risk: epidemiology, mechanisms, and prevention. Lancet 382, 339–352 (2013). [DOI] [PubMed] [Google Scholar]
- 21.Ferrucci L & Fabbri E Inflammageing: chronic inflammation in ageing, cardiovascular disease, and frailty. Nat. Rev. Cardiol 15, 505–522 (2018). [DOI] [PMC free article] [PubMed] [Google Scholar]
- 22.Varki A Glycan-based interactions involving vertebrate sialic-acid-recognizing proteins. Nature 446, 1023–1029 (2007). [DOI] [PubMed] [Google Scholar]
- 23.Jourde-Chiche N et al. Endothelium structure and function in kidney health and disease. Nat. Rev. Nephrol 15, 87–108 (2019). [DOI] [PubMed] [Google Scholar]
- 24.Zhang L et al. Functional metabolomics characterizes a key role for N-acetylneuraminic acid in coronary artery diseases. Circulation 137, 1374–1390 (2018). [DOI] [PubMed] [Google Scholar]
- 25.Pedersen HK et al. Human gut microbes impact host serum metabolome and insulin sensitivity. Nature 535, 376–381 (2016). [DOI] [PubMed] [Google Scholar]
- 26.Rowland I et al. Gut microbiota functions: metabolism of nutrients and other food components. Eur. J. Nutr 57, 1–24 (2018). [DOI] [PMC free article] [PubMed] [Google Scholar]
- 27.Jackson MA et al. Gut microbiota associations with common diseases and prescription medications in a population-based cohort. Nat. Commun 9, 2655 (2018). [DOI] [PMC free article] [PubMed] [Google Scholar]
- 28.Zhernakova A et al. Population-based metagenomics analysis reveals markers for gut microbiome composition and diversity. Science 352, 565–569 (2016). [DOI] [PMC free article] [PubMed] [Google Scholar]
- 29.Heianza Y, Ma W, Manson JE, Rexrode KM & Qi L Gut microbiota metabolites and risk of major adverse cardiovascular disease events and death: a systematic review and meta-analysis of prospective studies. J. Am. Heart Assoc 6, e004947 (2017). [DOI] [PMC free article] [PubMed] [Google Scholar]
- 30.Canfora EE, Meex RCR, Venema K & Blaak EE Gut microbial metabolites in obesity, NAFLD and T2DM. Nat. Rev. Endocrinol 15, 261–273 (2019). [DOI] [PubMed] [Google Scholar]
- 31.Academy of Medical Sciences. Multimorbidity: A Priority for Global Health Research (Academy of Medical Sciences, 2018). [Google Scholar]
- 32.Stanaway JD et al. Global, regional, and national comparative risk assessment of 84 behavioural, environmental and occupational, and metabolic risks or clusters of risks for 195 countries and territories, 1990–2017: a systematic analysis for the Global Burden of Disease Study 2017. Lancet 392, 1923–1994 (2018). [DOI] [PMC free article] [PubMed] [Google Scholar]
- 33.Wikström K, Lindström J, Harald K, Peltonen M & Laatikainen T Clinical and lifestyle-related risk factors for incident multimorbidity: 10-year follow-up of Finnish population-based cohorts 1982–2012. Eur. J. Intern. Med 26, 211–216 (2015). [DOI] [PubMed] [Google Scholar]
- 34.Freisling H et al. Lifestyle factors and risk of multimorbidity of cancer and cardiometabolic diseases: a multinational cohort study. BMC Med. 18, 5 (2020). [DOI] [PMC free article] [PubMed] [Google Scholar]
- 35.Smith SM, Wallace E, O’Dowd T & Fortin M Interventions for improving outcomes in patients with multimorbidity in primary care and community settings. Cochrane Database Syst. Rev 1, CD006560 (2016). [DOI] [PMC free article] [PubMed] [Google Scholar]
- 36.Tinetti ME, Fried TR & Boyd CM Designing health care for the most common chronic condition—multimorbidity. JAMA 307, 2493–2494 (2012). [DOI] [PMC free article] [PubMed] [Google Scholar]
- 37.Busija L, Lim K, Szoeke C, Sanders KM & McCabe MP Do replicable profiles of multimorbidity exist? Systematic review and synthesis. Eur. J. Epidemiol 34, 1025–1053 (2019). [DOI] [PubMed] [Google Scholar]
- 38.Jensen AB et al. Temporal disease trajectories condensed from populationwide registry data covering 6.2 million patients. Nat. Commun 5, 4022 (2014). [DOI] [PMC free article] [PubMed] [Google Scholar]
- 39.Marx P et al. Comorbidities in the diseasome are more apparent than real: what Bayesian filtering reveals about the comorbidities of depression. PLoS Comput. Biol 13, e1005487 (2017). [DOI] [PMC free article] [PubMed] [Google Scholar]
- 40.Williams SA et al. Plasma protein patterns as comprehensive indicators of health. Nat. Med 25, 1851–1857 (2019). [DOI] [PMC free article] [PubMed] [Google Scholar]
- 41.Sumner LW et al. Proposed minimum reporting standards for chemical analysis Chemical Analysis Working Group (CAWG) Metabolomics Standards Initiative (MSI). Metabolomics 3, 211–221 (2007). [DOI] [PMC free article] [PubMed] [Google Scholar]
- 42.Huang Y-T & Yang H-I Causal mediation analysis of survival outcome with multiple mediators. Epidemiology 28, 370–378 (2017). [DOI] [PMC free article] [PubMed] [Google Scholar]
Associated Data
This section collects any data citations, data availability statements, or supplementary materials included in this article.
Supplementary Materials
Data Availability Statement
We have provided open access to all summary statistics for academic use through an interactive web server. The EPIC-Norfolk data can be requested by bona fide researchers for specified scientific purposes via the study website (https://www.mrc-epid.cam.ac.uk/research/studies/epic-norfolk/). Data will either be shared through an institutional data sharing agreement or arrangements will be made for analyses to be conducted remotely without the need for data transfer.


