Abstract
Serum interleukin-8 (IL-8) levels and tumor neutrophil infiltration are associated with worse prognosis in advanced cancers. Here, using a large-scale retrospective analysis, we show that elevated baseline serum IL-8 levels are associated with poor outcome in patients (n = 1,344) with advanced cancers treated with nivolumab and/or ipilimumab, everolimus or docetaxel in phase 3 clinical trials, revealing the importance of assessing serum IL-8 levels in identifying unfavorable tumor immunobiology and as an independent biomarker in patients receiving immune-checkpoint inhibitors.
Immunostimulatory therapies targeting programmed cell death 1 (PD-1) and cytotoxic T-lymphocyte-associated protein 4 (CTLA-4) can produce prominent and lasting antitumor effects and are standard treatment for numerous malignancies1. However, clinical benefits vary across tumor types, and most patients progress despite treatment2,3. Early identification of patients who are insensitive to treatment could avoid ineffective therapies with potentially serious adverse effects. Diverse tumor and host factors associated with primary sensitivity and resistance to immune-checkpoint inhibitors include protein expression of programmed cell death 1 ligand 1 (PD-L1) in pretreatment tumor biopsy specimens, mismatch repair deficiency, microsatellite instability, number of somatic DNA mutations and/or tumor mutational burden (TMB), T-cell infiltration metrics (for example, the level of CD8+ tumor-infiltrating lymphocytes or interferon-γ (IFNγ)-related mRNA signatures), gut microbiota composition and deleterious somatic variants (for example, STK11 (also known as LKB1) and PBRM1)2,4. However, clinical implementation of these markers is challenging; to date, only PD-L1 detection in tumor or immune cells using immunohistochemistry (IHC), mismatch repair deficiency using IHC and microsatellite instability using polymerase chain reaction assays have received regulatory companion diagnostic approval for immune-checkpoint inhibitors2. Additional nonredundant and minimally invasive biomarkers are required.
C-X-C motif chemokine ligand 8 (CXCL8, also known as IL-8), the first chemokine to be discovered, is an angiogenic polypeptide expressed in multiple cancers5. IL-8 potently regulates the chemotaxis of human neutrophils6,7 and exerts direct protumorigenic effects, including the promotion of angiogenesis, tumor cell dedifferentiation (for example, epithelial–mesenchymal transition) and invasion and/or metastasis8. The impact of IL-8 chemoattractant activity for neutrophils and other T-cell-suppressive myeloid cells in cancer has been poorly understood until recently9. We reported early increases in serum IL-8 levels as a strong predictor of poor outcome in small retrospective cohorts of patients with advanced melanoma or non-small-cell lung cancer (NSCLC) who were treated with immune-checkpoint inhibitors, suggesting a link between IL-8 expression and ineffective antitumor immune reinvigoration10. Here we evaluated the effect of serum IL-8 levels on antitumor outcomes in patients with advanced cancer from four randomized phase 3 clinical trials. Associations between serum IL-8 levels and known immunotherapy biomarkers (for example, PD-L1 and TMB) and the tumor immune contexture were also investigated.
We measured baseline serum IL-8 levels in samples from 1,344 patients treated with nivolumab monotherapy or nivolumab plus ipilimumab in four phase 3 clinical studies: CheckMate 067 (melanoma); CheckMate 017 (squamous NSCLC (sqNSCLC)); CheckMate 057 (nonsquamous NSCLC (nsqNSCLC)); and CheckMate 025 (renal-cell carcinoma (RCC)). The objective response rate (ORR), progression-free survival (PFS) and overall survival (OS) of patients were assessed using receiver operator characteristic (ROC) curves. OS was used to derive 23 pg ml−1 as a clinically relevant stratification cut-off (Extended Data Fig. 1). Patients who received immune-checkpoint inhibitors were independently stratified by this cut-off in each trial cohort. Baseline serum IL-8 levels of ≥23 pg ml−1 were identified in 27.1–34.3% of patients and were associated with shorter OS across treatments and tumor types (Fig. 1a–f, Extended Data Figs. 2, 3). The most detrimental survival effect occurred in patients with melanoma treated with nivolumab plus ipilimumab in CheckMate 067: hazard ratio (HR) of 3.06 (95% confidence interval (CI), 2.13–4.41) between patients with high (≥23 pg ml−1) and low (<23 pg ml−1) baseline serum IL-8 levels. An HR of 1.84 (95% CI, 1.19–2.83) was detected in patients with advanced sqNSCLC from CheckMate 017. Similarly, a lower ORR was observed in patients with high (≥23 pg ml−1) versus low (<23 pg ml−1) baseline serum IL-8 levels across most trials and treatment arms investigated (Extended Data Fig. 4, Supplementary Data 1). The association between elevated baseline serum IL-8 level and reduced survival was also observed in non-immunotherapy trial arms, including patients with RCC treated with single-agent everolimus (CheckMate 025) and patients with nsqNSCLC treated with docetaxel (CheckMate 057; Extended Data Fig. 3). The interaction term analysis between the outcome effect of IL-8 levels and immune-checkpoint inhibitors versus non-immunotherapies was not statistically significant, supporting the idea that elevated baseline serum IL-8 levels are associated with negative prognosis.
Fig. 1 |. Association between baseline serum IL-8 level and survival and baseline PD-L1 level in patients treated with immune-checkpoint inhibitors.
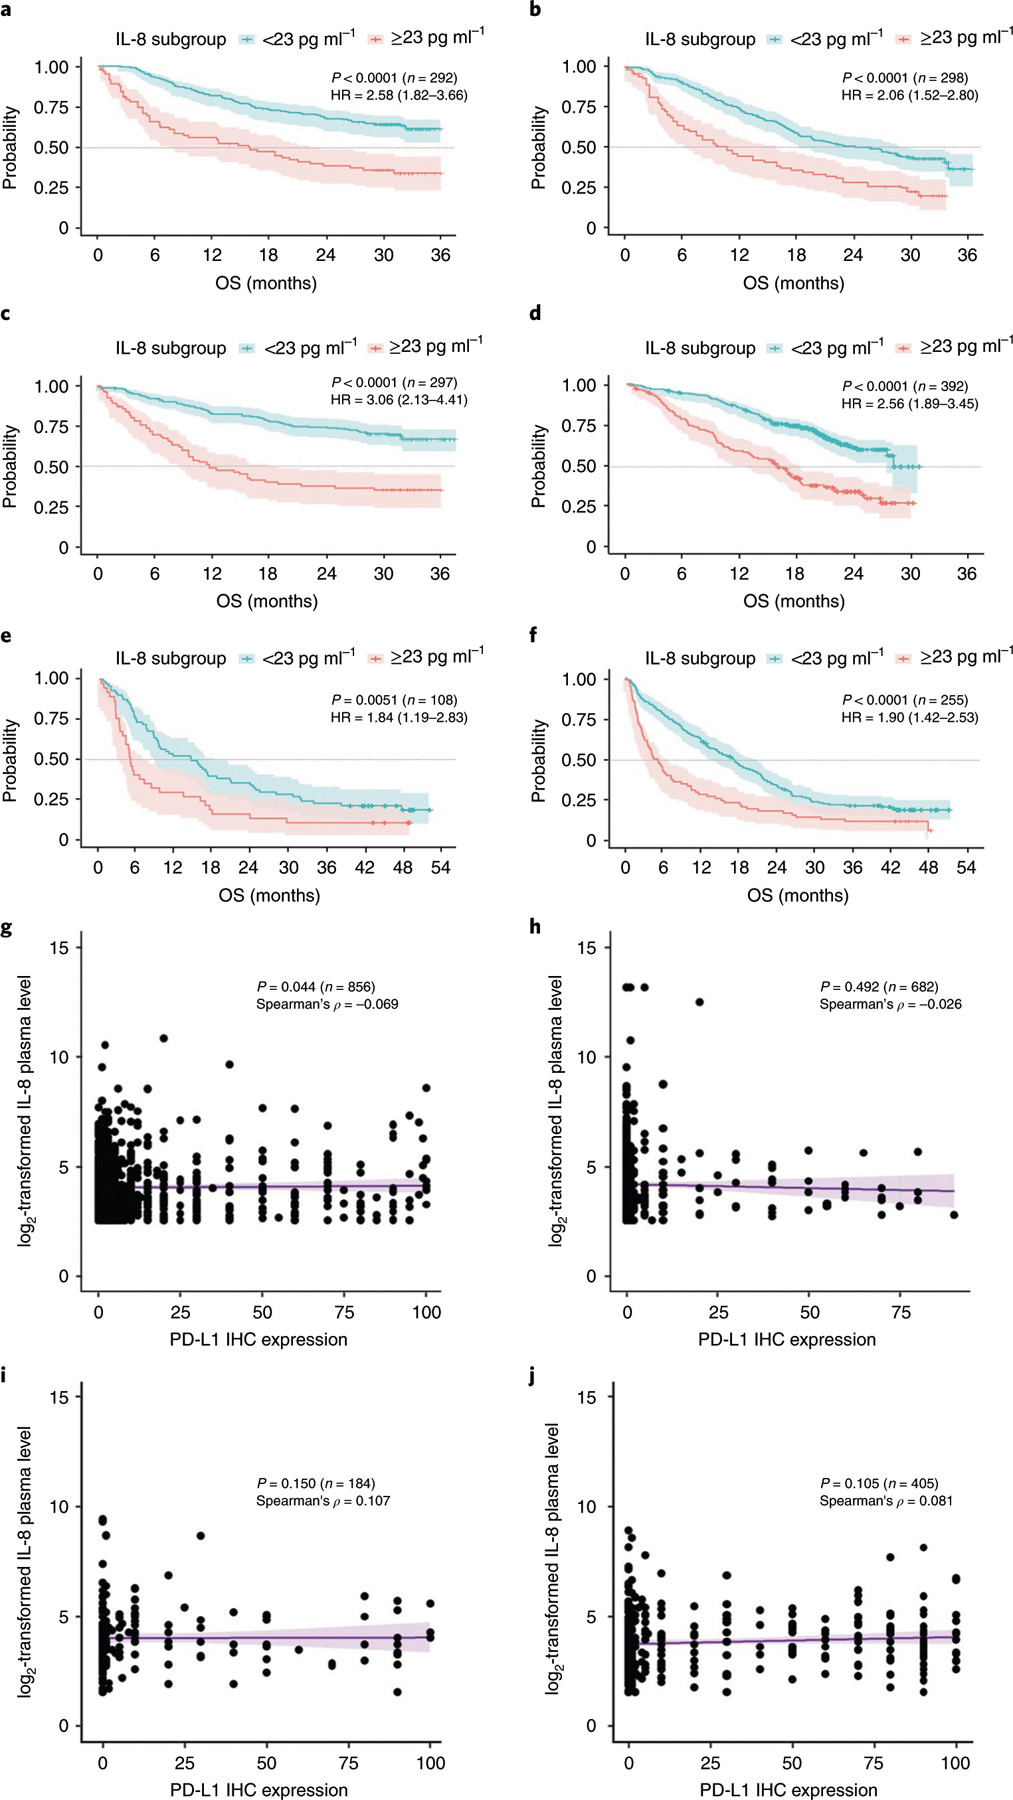
a–f, Exploratory Kaplan–Meier analysis of the OS probability (with 95% confidence intervals) in patients with melanoma (CheckMate 067) (a–c; a, nivolumab; b, ipilimumab; c, nivolumab and ipilimumab), RCC (CheckMate 025) (d; nivolumab), sqNSCLC (CheckMate 017) (e; nivolumab) and nsqNSCLC (CheckMate 057) (f; nivolumab) treated with PD-1 and CTLA-4 blockers in four prospective phase 3 clinical trials. Patients were stratified using a serum IL-8 level of 23 pg ml−1. The specific study, two-sided log-rank test P values for the survival analysis, the number of independent patients with available IL-8 and OS data (n) and the OS HR (based on Cox proportional hazard models) between IL-8 subgroups (≥23 pg ml−1 versus <23 pg ml−1) are shown. The dotted lines indicate the 50% probability of OS. g–j, The association between the tumor PD-L1 level by IHC analysis and the log2-transformed serum IL-8 level in patients with melanoma (CheckMate 067, n = 856; Spearman’s correlation coefficient, ρ = −0.069) (g), RCC (CheckMate 025, n = 682; ρ = −0.026) (h), sqNSCLC (CheckMate 017, n = 184; ρ = 0.107) (i) and nsqNSCLC (CheckMate 057, n = 405; ρ = 0.081) (j). P values for the two-sided Spearman’s test (based on t-distribution approximation with n − 2 degrees of freedom) of the association between tumor PD-L1 level and the log2-transformed serum IL-8 level, the number of independent patients (n) with paired PD-L1 and serum IL-8 data for each study and Spearman’s correlation coefficients (ρ) are shown. PD-L1 levels were determined using IHC with the DAKO PD-L1 IHC 28–8 pharmDx assay (Agilent), read by a pathologist and expressed as the percentage of positive tumor cells. Baseline serum IL-8 levels were determined by immunoassay and expressed as log2-transformed values of the protein concentration. Each dot indicates an individual patient; the purple line shows the linear regression line (with 95% confidence intervals). There are no multiplicity adjustments made for all statistical analyses.
The proportion of patients with elevated baseline serum IL-8 levels was similar between patients with positive and negative PD-L1 expression (1% cut-off) (Extended Data Fig. 5). The correlation between PD-L1 expression level and baseline serum IL-8 level was low across tumor types (Spearman’s correlation coefficient (ρ), −0.069–0.107; ρ for all studies combined, −0.028) (Fig. 1g–j). Therefore, the IL-8-mediated effect on survival is independent of PD-L1 IHC positivity.
To address the possible association between tumor IL-8 levels and TMB, we studied CXCL8 mRNA levels and somatic mutation numbers in select tumor cohorts from The Cancer Genome Atlas (TCGA) dataset. The low correlation between CXCL8 transcript expression and TMB across tumor types (Spearman’s ρ, 0.0073– 0.1458) (Extended Data Fig. 6) supports a limited association.
To evaluate the relationship between IL-8 and inflammatory responses, we studied the association between serum IL-8 levels, tumor expression of key immune transcripts, and selected circulating immune-cell populations. Circulating IL-8 level was positively correlated with tumor CXCL8 gene expression and blood neutrophil and monocyte counts (Fig. 2a). Increased tumor IL-8 level was negatively associated with tumor IFNγ- and T-cell infiltration-related transcript signatures. A positive association between local IL-8 protein expression in the tumor and increased tumor infiltration by myeloperoxidase (MPO)+ and/or CD15+ monocytes and neutrophils was identified using multiplexed quantitative and spatially resolved immunofluorescence analyses of retrospective tumor specimens from NSCLC (Fig. 2b–d), melanoma (Fig. 2e–g) and RCC (Fig. 2h–j). These data provide evidence of IL-8 production in tumor cells, support an adaptive immune suppressive effect of IL-8 and suggest a strong association between tumor-derived IL-8 and tolerogenic myeloid-cell infiltration in the tumor microenvironment.
Fig. 2 |. Association between IL-8 levels and monocytes and neutrophils in human malignancies.
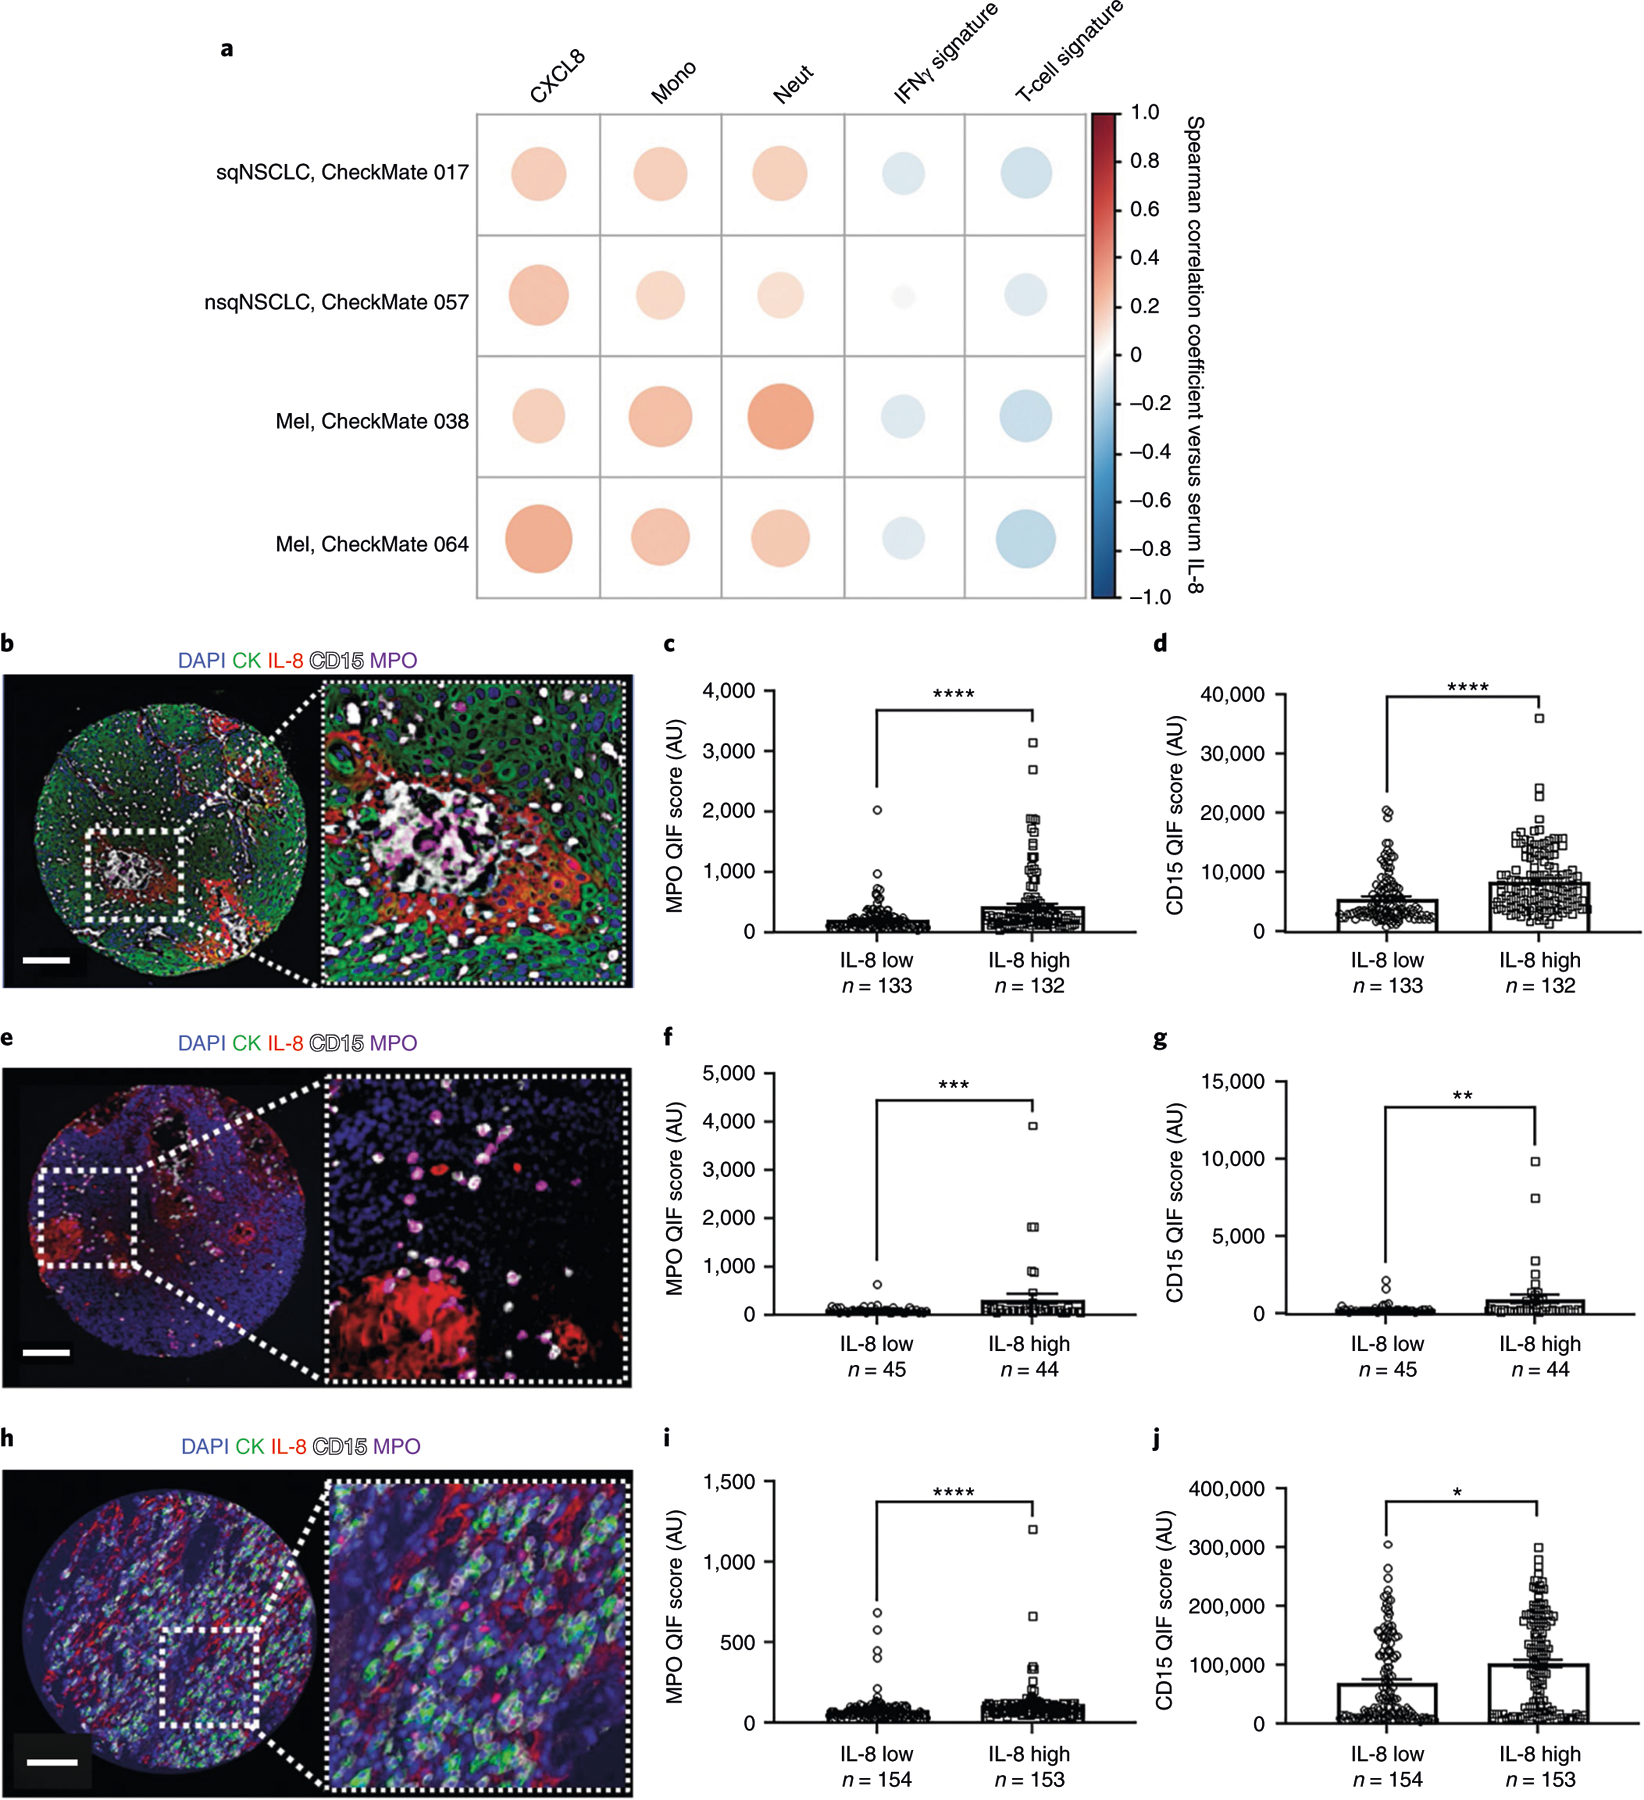
a, Association between serum IL-8 levels and tumor mRNA expression of CXCL8, peripheral monocyte counts (Mono), blood neutrophil counts (Neut), IFNγ-related gene signature18 and the T-cell-related mRNA signature19 in patients with sqNSCLC (CheckMate 017, n = 113), nsqNSCLC (CheckMate 057, n = 248) or melanoma (Mel; CheckMate 038, n = 142; CheckMate 064, n = 127). The color intensity of the circles indicates the Spearman’s correlation coefficient of the association. Darker red, larger dots represent a greater correlation between serum IL-8 level and the indicated factor; darker blue, larger dots represent a greater negative correlation between serum IL-8 level and the indicated factor. b, Representative fluorescence image of 265 samples from one tumor showing the simultaneous detection of 4′,6-diamidino-2-phenylindole (DAPI; blue), cytokeratin (CK; green), IL-8 (red), CD15 (white) and MPO (magenta) in human NSCLC. c,d, Association between tumor IL-8 protein and MPO (c) or CD15 (d) levels in NSCLC (independent biological samples). e, Representative fluorescence image of 99 samples from one tumor showing the simultaneous detection of DAPI (blue), cytokeratin (green), IL-8 (red), CD15 (white) and MPO (magenta) in human melanoma. f,g, Association between tumor IL-8 protein and MPO (f) or CD15 (g) levels in melanoma (independent biological samples). h, Representative fluorescence image of 307 samples from one tumor showing the simultaneous detection of DAPI (blue), cytokeratin (green), IL-8 (red), CD15 (white) and MPO (magenta) in human RCC. i,j, Association between tumor IL-8 protein and MPO (i) or CD15 (j) levels in RCC (independent biological samples). Patients were stratified using the median score as the cut-off. The number of patients (n) is indicated. P values for the 2-sided Mann–Whitney U-test: *P < 0.0001; ***P = 0.0195; **P = 0.0129; *P = 0.0003. Error bars indicate standard of error of the mean. Scale bars, 100 µm. AU, arbitrary units; QIF, quantitative immunofluorescence.
These results validate and expand the strong prognostic influence of IL-8 in multiple tumor types across treatment settings. Our analyses demonstrate an independent survival effect of serum IL-8 levels across four tumor types from randomized clinical trial data and show a consistent association with tumor-infiltrating neutrophils and/or monocytes. We also propose a clinically meaningful cut-off level of 23 pg ml−1. Serum IL-8 level is a simple quantitative parameter that can be easily measured in conventional blood specimens in clinical settings.
IL-8 is a powerful chemoattractant for neutrophils and other potentially immune-suppressive myeloid leukocytes9. We observed that IL-8 expression correlated with neutrophil and monocyte abundance in IL-8-producing tumors, consistent with evidence from gene signatures indicating that polymorphonuclear leukocyte proliferation, or increased circulating neutrophils over lymphocytes, is associated with poor prognosis in patients with cancer11,12. High CXCL8 mRNA expression negatively correlated with T-cell markers and IFNγ-dependent gene signatures in the tumor microenvironment. These associations suggest that mechanisms of T-cell exclusion and immunosuppression involve myeloid-derived suppressor cells, as observed in mice13,14. Baseline serum IL-8 levels likely reflect tumor IL-8 production and a unique, unfavorable tumor microenvironment characterized by prominent myeloid-cell infiltration, including neutrophils and monocytes, and limited adaptive T-cell responses. Distinct from known immune-checkpoint inhibitor-associated biomarkers, IL-8 could be part of and complement robust multiparameter immunotherapy biomarker signatures. Ongoing studies are assessing differences in IL-8 levels and dynamics across diseases and clinical settings.
Elevated baseline serum IL-8 levels were associated with adverse outcomes in melanoma, sqNSCLC, nsqNSCLC and RCC. To date, biomarkers such as microsatellite instability and TMB have not shown a survival effect or predictive value in RCC. Assessment of serum IL-8 levels could expand the biomarker arsenal for optimal immune-checkpoint inhibitor use in tumors that currently lack clinically useful biomarkers. Analysis of the potential mechanistic role of IL-8 with respect to immune-checkpoint inhibitor response (by neutralizing IL-8 or inhibiting IL-8 receptors) is needed.
We determined that 23 pg ml−1 is a clinically relevant stratification cut-off using pooled analyses. Despite differences in median survival across individual studies, the 23 pg ml−1 cut-off produces a comparable Youden’s index to its maximum value for nivolumab-containing arms in both individual and pooled studies, demonstrating that this cut-off could be applied to melanoma, sqN-SCLC, nsqNSCLC and RCC. The numerical values of IL-8 measurements may vary slightly depending on the analytical method used.
Our results show that elevated IL-8 levels are associated with adverse tumor features and can be used as a negative prognostic marker in patients treated with different therapies including immune-checkpoint inhibitors. We cannot exclude a role for IL-8 in predicting resistance to specific anticancer immunotherapies in tumor types or treatment settings not included in our study. The unfavorable outcome associated with elevated IL-8 is likely mediated by its negative immunomodulatory effect. Other anticancer treatments, such as cytotoxic chemotherapy and targeted agents, have also been shown to induce immune stimulation, and an intact adaptive immune response is one of the factors required to mediate their therapeutic effect15. Although the contribution of the prognostic and a possible negative predictive effect of IL-8 cannot be fully resolved due to the retrospective design and statistical considerations of this study, patients with high pretreatment IL-8 levels are less likely to benefit from immune-checkpoint inhibitors.
In addition to its possible role as a prognostic biomarker, IL-8 is being considered as a candidate therapeutic target16. IL-8 reportedly exerts proangiogenic functions that may underlie escape from vascular endothelial growth factor–vascular endothelial growth factor receptor inhibitors and mediates direct effects on malignancy-sustaining cancer stem cells and the epithelial–mesenchymal transition of tumor cells5,17. Agents targeting IL-8 or IL-8 receptors are in clinical development16; selective inhibitors of the IL-8 receptor CXCR2 are in late preclinical or clinical development in combination with immune-checkpoint inhibitors (ClinicalTrials. gov identifiers NCT02499328, NCT03473925 and NCT03161431). Anti-IL-8 therapies could complement immune-checkpoint inhibitors by suppressing immuno-oncology-resistance pathways. A fully human monoclonal anti-IL-8 antibody (BMS-986253) has been shown to be safe in patients with advanced cancers16. Ongoing studies are evaluating the safety and efficacy of BMS-986253 in combination with nivolumab (NCT03400332).
Methods
Analyzed studies.
Exploration of the association between serum IL-8 level and survival.
Patients (n = 1,344) treated with nivolumab or nivolumab and ipilimumab (immune-checkpoint inhibitors) in four phase 3 clinical trials (CheckMate 067, melanoma20; CheckMate 017, sqNSCLC21; CheckMate 057, nsqNSCLC22; CheckMate 025, RCC23) (Extended Data Fig. 8) were included for analyses. Serum IL-8 levels were measured at baseline using the human multianalyte profile (MAP) immunoassay platform (Myriad RBM)24 (Fig. 1, Supplementary Data 1, Extended Data Fig. 7). The total number of cases for exploration of the association between serum IL-8 level and survival—including the ipilimumab arm of CheckMate 067 and non-immune-checkpoint inhibitor arms of CheckMate 057 and CheckMate 025—was 2,243 patients.
Gene-expression analyses.
The association between serum IL-8 levels and tumor CXCL8 mRNA expression at baseline was analyzed in samples for which serum IL-8 levels, gene expression and complete blood count data were available. The following numbers of unique cases were analyzed: CheckMate 017, n = 113; CheckMate 038 (refs. 25,26), n = 142 and n = 248, respectively; CheckMate 064 (ref. 27), n = 127.
Outcome measures.
The primary objective of this exploratory analysis was to assess the association between baseline serum IL-8 levels and antitumor activity; efficacy measures included ORR, PFS and OS.
Statistical methods.
To determine a clinically relevant cut-off for baseline serum IL-8 levels, we conducted time-dependent ROC curve analyses28 on OS (12 months), ORR and PFS (6 months) for all patients treated with nivolumab-containing therapies combined across the four studies (Extended Data Fig. 1). Because the OS ROC curve produces the highest area under the curve (AUC = 0.685) among OS, ORR and PFS, the Youden’s index (sensitivity + specificity − 1) for the OS ROC curve was the only metric considered to select the cut-off of 23 pg ml−1 (Supplementary Data 1). OS ROC analyses were also conducted to assess the cut-off of 23 pg ml−1 for the immune-checkpoint inhibitor arms of individual studies (Extended Data Fig. 7). We used Kaplan–Meier analyses to assess OS stratified by serum IL-8 levels (cut-off, 23 pg ml−1) and compared the OS between IL-8 subgroups (≥23 pg ml−1 versus <23 pg ml−1) using two-sided log-rank tests for each study (Fig. 1a–f). Kaplan–Meier curves of OS stratified by serum IL-8 quartiles for nivolumab-containing therapies combined across the four studies (Extended Data Fig. 9) were also obtained. In addition, we evaluated the Spearman’s correlation coefficient between PD-L1 IHC scores (Fig. 1g–j), determined using the DAKO PD-L1 IHC 28–8 pharmDx assay (Agilent) and expressed as the percentage of positive tumor cells and (log2-transformed) serum IL-8 levels. The Spearman’s correlation coefficient was then tested using a two-sided Spearman’s test (based on t-distribution approximation with n − 2 degrees of freedom, where n is the number of independent patients with paired PD-L1 and IL-8 data) for each study. To assess the association between serum IL-8 level and OS, accounting for tumor PD-L1 expression, we also conducted a Cox proportional hazards model of OS, adjusting for baseline serum IL-8 level, PD-L1 IHC score and baseline tumor burden estimated as the sum of target lesion size.
IL-8 expression and TMB in TCGA.
We collected gene-expression and somatic-variant data for 1,424 samples over four cancer types, including sqNSCLC, nsqNSCLC, RCC and melanoma29. We used the somatic variants as determined by and passed through the filtering by TCGA and gene-expression level-3 data represented as fragments per kilobase per million mapped reads (FPKM). TMB was defined by whole-exome sequencing, as previously described30, including all base substitutions and small insertions or deletions in the coding region of targeted genes. To calculate the TMB per megabase, the total number of somatic mutations counted was divided by the total size of the exonic region of the human genome.
where n is the raw somatic variant count as determined by TCGA. We used 33 Mb as the estimate of the size of the exome. To test for the correlation between CXCL8 mRNA expression levels and TMB, we transformed the FPKM value of IL-8 and total mutational counts to a log10 scale, and the Spearman’s correlation coefficients were calculated (Extended Data Fig. 6).
Gene-expression analyses.
Gene-expression data (HTG EdgeSeq Oncology Biomarker Panel; HTG Molecular Diagnostics) were generated from archival biopsy specimens or biopsy specimens obtained at screening before baseline serum sample acquisition. Monocyte and neutrophil counts were generated using standard complete blood counts. Correlations and figures were generated with R v.3.5.1 and corrplot package v.0.84. Gene-expression signature scores were calculated based on a list of genes using the median z-scores of the normalized values of all genes in a given list (for example, IFNγ-related gene signature18 or T-cell gene signature19) for each sample. The z-scores of normalized gene expression values for CXCL8 were used for correlative analyses. Spearman’s correlation coefficients between baseline serum IL-8 levels and other baseline biomarker measurements were calculated as indicated (Fig. 2a; CXCL8 data and gene-expression scores are included in Supplementary Data 1).
Retrospective patient cohorts and tissue microarrays.
We included retrospectively collected formalin-fixed, paraffin-embedded tumor samples from 265 primary NSCLCs, 99 primary melanomas and 307 RCCs collected at Yale University/Yale New Haven Hospital, provided in tissue microarray (TMA) format (Fig. 2b,e,h). As previously described31, TMAs were constructed by selecting areas containing viable tumor cells and stromal elements without enriching for specific tumor regions, tissue structures or immune-related features on preparations stained with hematoxylin and eosin (as assessed by a pathologist). All tissue and clinical QIF information were used after approval from the Yale Human Investigation Committee (protocols 9505008219 and 1608018220), which approved the patient consent forms or waivers of consent.
Multiplexed immunofluorescence analysis.
Using previously validated and standardized multiplexed immunofluorescence protocols and TMA sections32,33, we simultaneously measured the levels of 4′,6-diamidino-2-phenylindole (DAPI), pan-cytokeratin clone AE1/AE3 (1:100 dilution; 53–9003-82, eBioscience), IL-8 clone 807 (1:5,000 dilution; ab18672, Abcam), myeloperoxidase clone E1E7I (1:1,000 dilution; 14569, Cell Signaling Technology) and CD15 clone MC480 (1:2,000 dilution; 4744S, Cell Signaling Technology) (Fig. 2b–j, source data are provided in Supplementary Data 1). In brief, TMA sections were deparaffinized, and antigens were recovered with EDTA (1 mmol l−1, pH 8; Sigma-Aldrich) and boiling for 20 min at 97 °C (Lab Vision PT module; Thermo Fisher Scientific)31. Endogenous peroxidase was inactivated by the addition of a DAKO endoperoxidase inhibitor solution for 10 min, and the slides were incubated with a blocking solution containing 0.3% bovine serum albumin in 0.05% Tween-20 and Tris-buffered saline for 30 min. Primary antibody dilution and incubation were carried out simultaneously using the optimal dilution for each assay. Isotype-specific horseradish peroxidase-conjugated antibodies and tyramide-based amplification systems (PerkinElmer) were used for signal detection. The secondary antibodies and fluorescent reagents used were anti-rabbit EnVision (K4003, DAKO) with fluorescein–tyramide (PerkinElmer), anti-mouse IgG2a antibody (Abcam) with Cy3 plus (PerkinElmer), goat anti-rabbit (Abcam) with biotinylated tyramide/streptavidin–Alexa750 conjugate (PerkinElmer) and anti-mouse Envision (K40001; DAKO) with Cy5–tyramide (PerkinElmer). Residual horseradish peroxidase activity between sequential detection protocols was eliminated by incubating the slides twice with a solution containing benzoic hydrazide (100 mmol l−1) and hydrogen peroxide (50 mmol l−1) in phosphate-buffered saline. The fluorescence signal was measured in marker-selected tissue compartments using the automated AQUA platform (Navigate BioPharma).
Reporting Summary.
Further information on research design is available in the Nature Research Reporting Summary linked to this article.
Extended Data
Extended Data Fig. 1 |. Statistical identification of a baseline serum IL-8 cutoff below which patients were more likely to benefit from Nivo-based therapy.
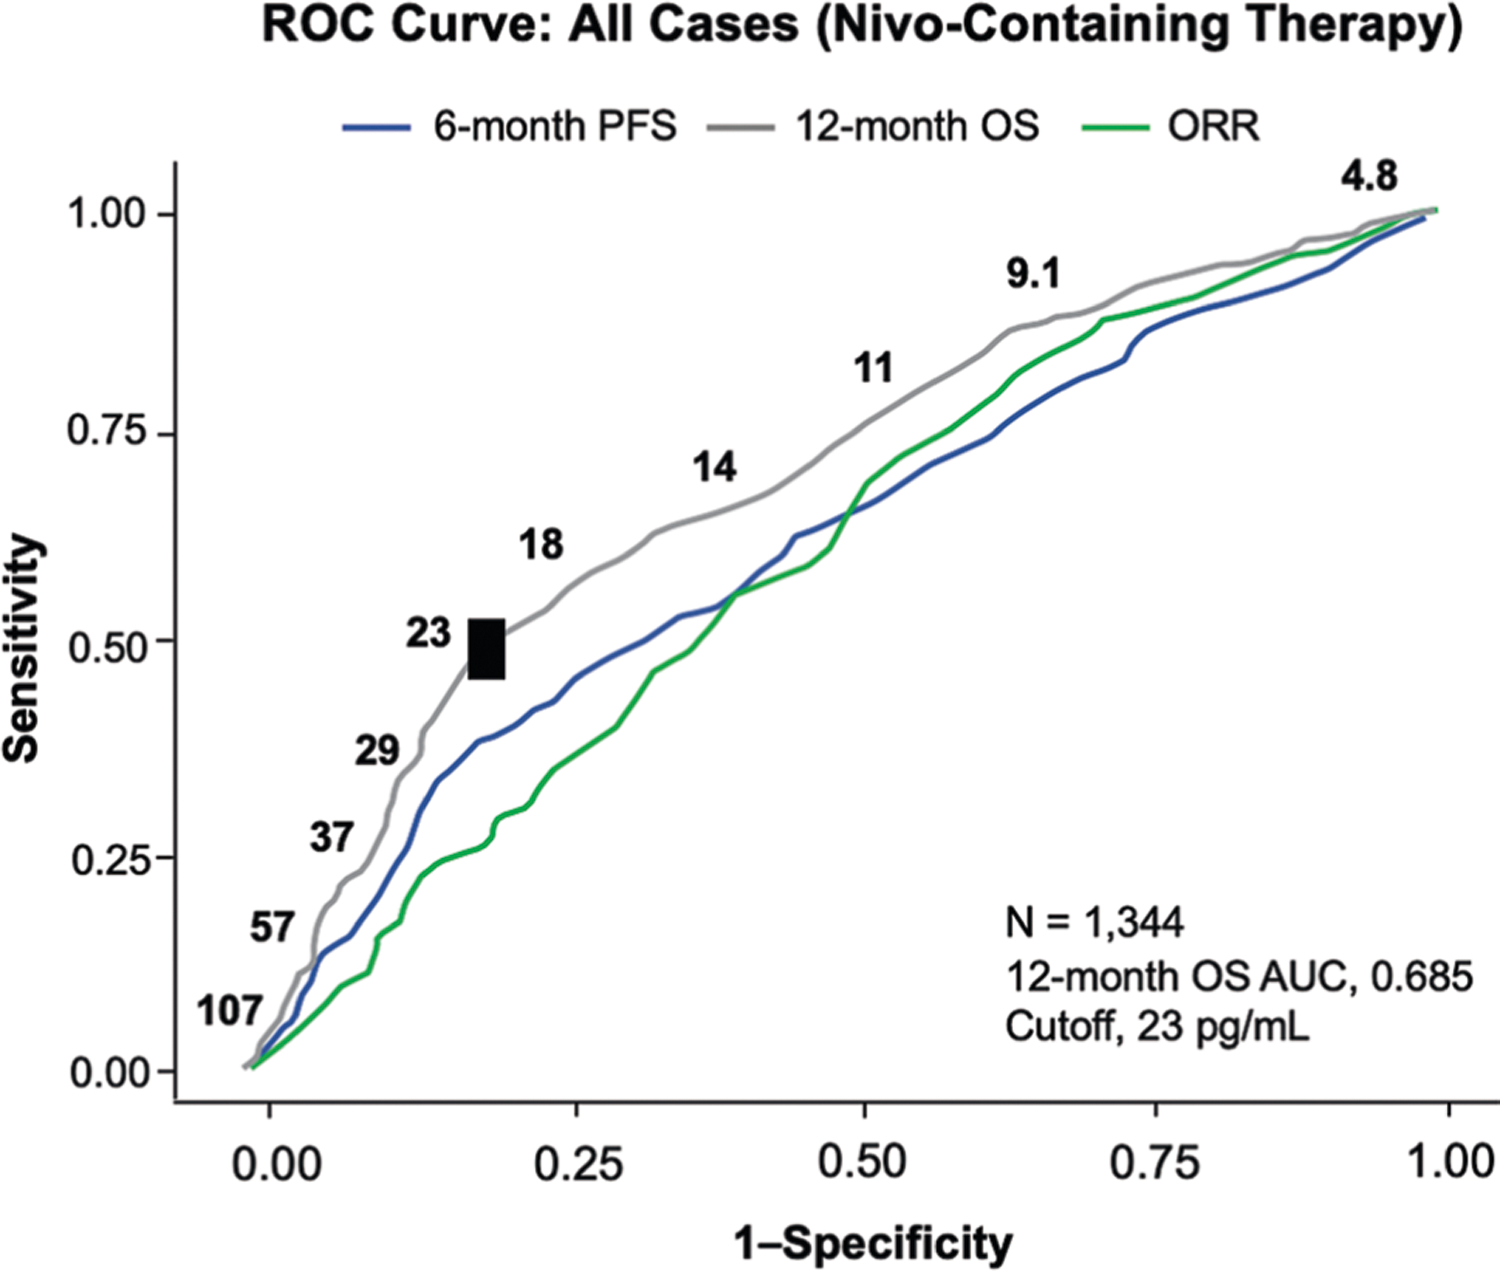
ROC curve analyses were used to assess ORR, 6-month PFS, and 12-month OS. OS AUC (12-month) is indicated and identifies ≥23 pg/ml as a cutoff. All cases with nivolumab-containing therapies were analyzed. AUC, area under the curve; Nivo, nivolumab; ORR, objective response rate; OS, overall survival; PFS, progression-free survival; ROC, receiver operator characteristic.
Extended Data Fig. 2 |. Association between elevated IL-8 and survival across treatments and tumor types.
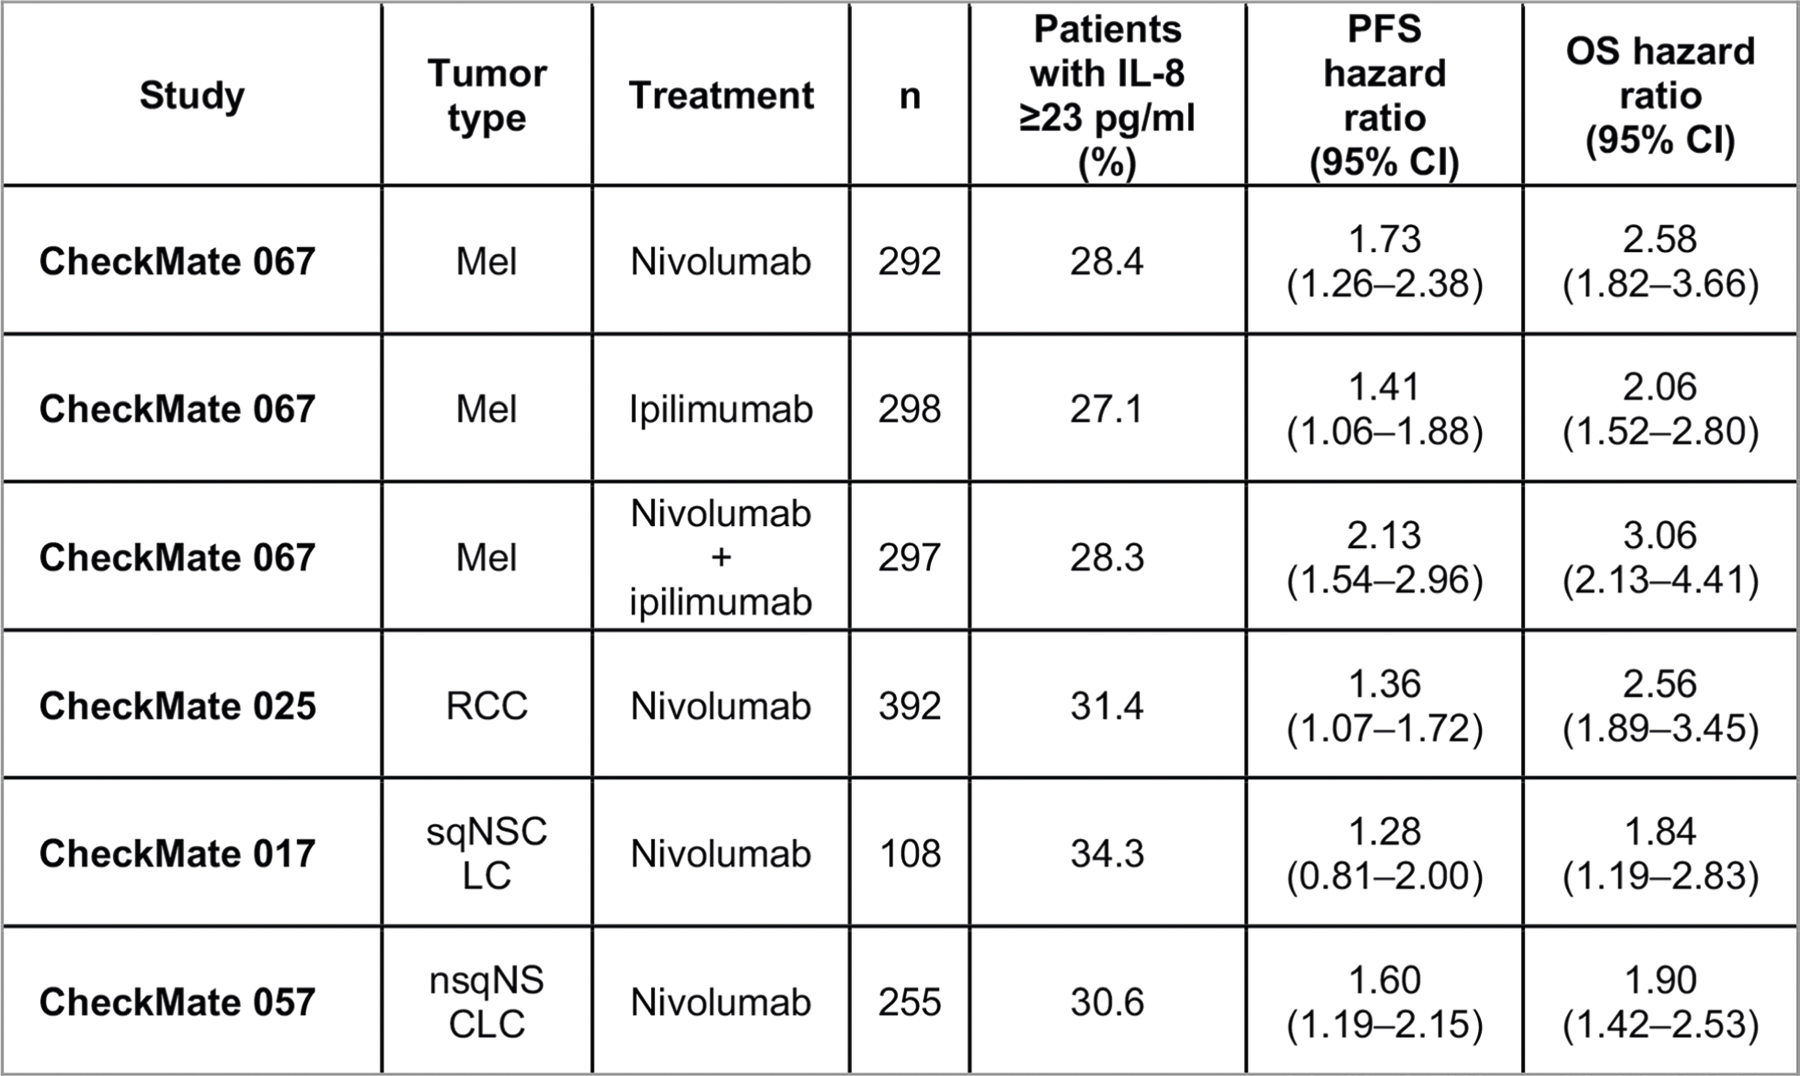
Percentage of patients with baseline serum IL-8 levels ≥23 pg/ml across Mel (CheckMate 067: nivolumab, n = 292; ipilimumab, n = 298; nivolumab plus ipilimumab, n = 297), RCC (CheckMate 025, n = 392), sqNSCLC (CheckMate 017, n = 108), and nsqNSCLC (CheckMate 057, n = 255) with nivolumab monotherapy, ipilimumab monotherapy, or nivolumab plus ipilimumab combination therapy, as indicated. PFS and OS hazard ratios (IL-8 ≥ 23 pg/ml versus IL-8 < 23 pg/mL) are also presented (95% CI). HR, hazard ratio; IL, interleukin; Mel, melanoma; nsqNSCLC, nonsquamous non-small cell lung cancer; OS, overall survival; PFS, progression-free survival; RCC, renal cell carcinoma; sqNSCLC, squamous NSCLC.
Extended Data Fig. 3 |. Association between elevated IL-8 level and reduced survival was also seen in the non-immunotherapy trial arms.
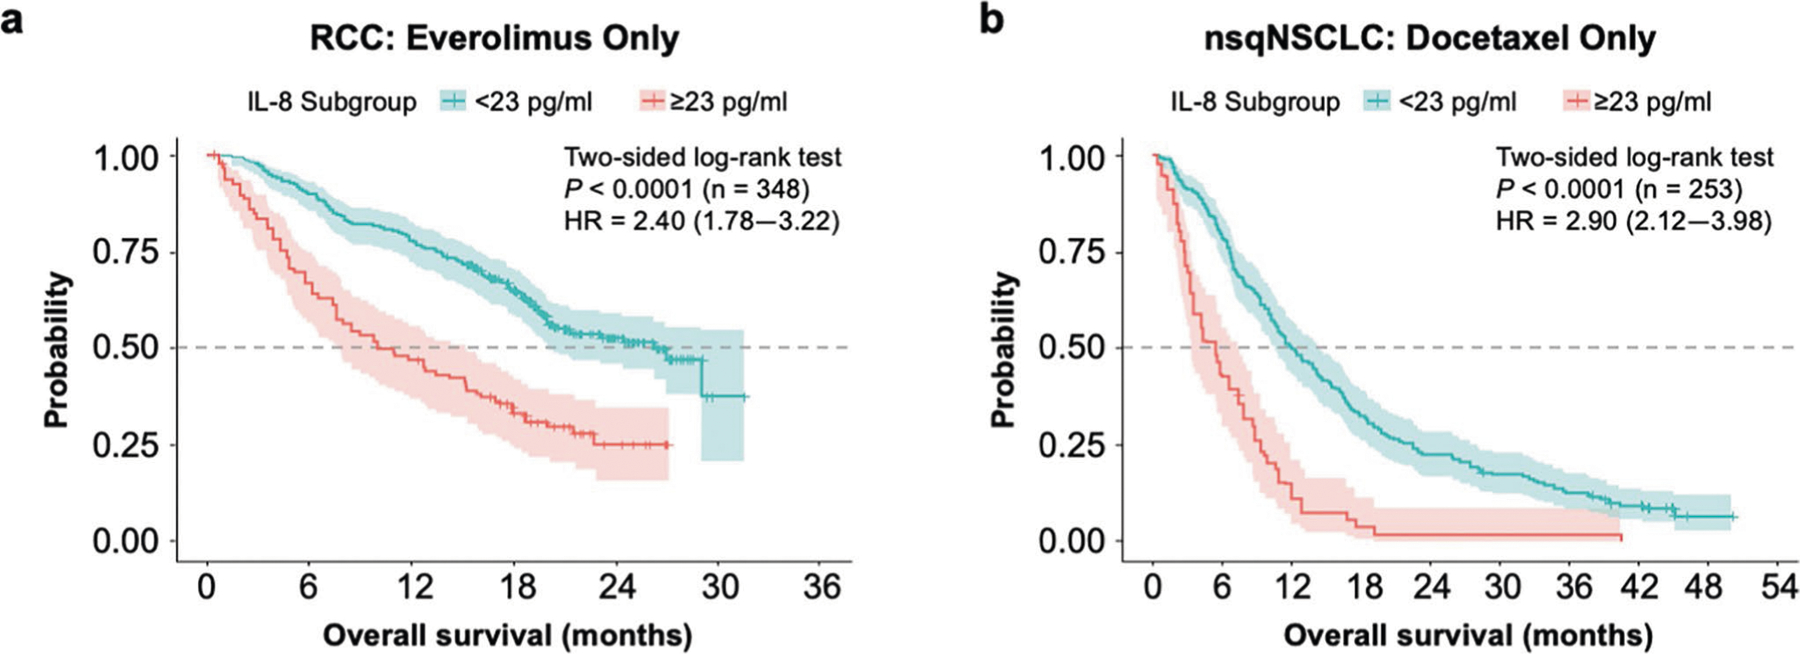
The specific study, 2-sided log-rank test P values for the survival analysis, the number of independent patients with available IL-8 and OS data (n), and the OS HR (based on Cox proportional hazard model) between IL-8 subgroups (≥23 pg/ml versus <23 pg/ml) are indicated within each chart. a, Probability of OS with <23 pg/ml or ≥23 pg/ml IL-8 levels in patients with RCC treated with everolimus from CheckMate 025 (n = 348). b, Probability of OS with <23 pg/ml or ≥23 pg/ml IL-8 levels in patients with nsqNSCLC treated with docetaxel from CheckMate 057 (n = 253). HR, hazard ratio; IL, interleukin; nsqNSCLC, nonsquamous non-small cell lung cancer; OS, overall survival; RCC, renal cell carcinoma.
Extended Data Fig. 4 |. ORR by IL-8 subgroup across trials and treatment arms.
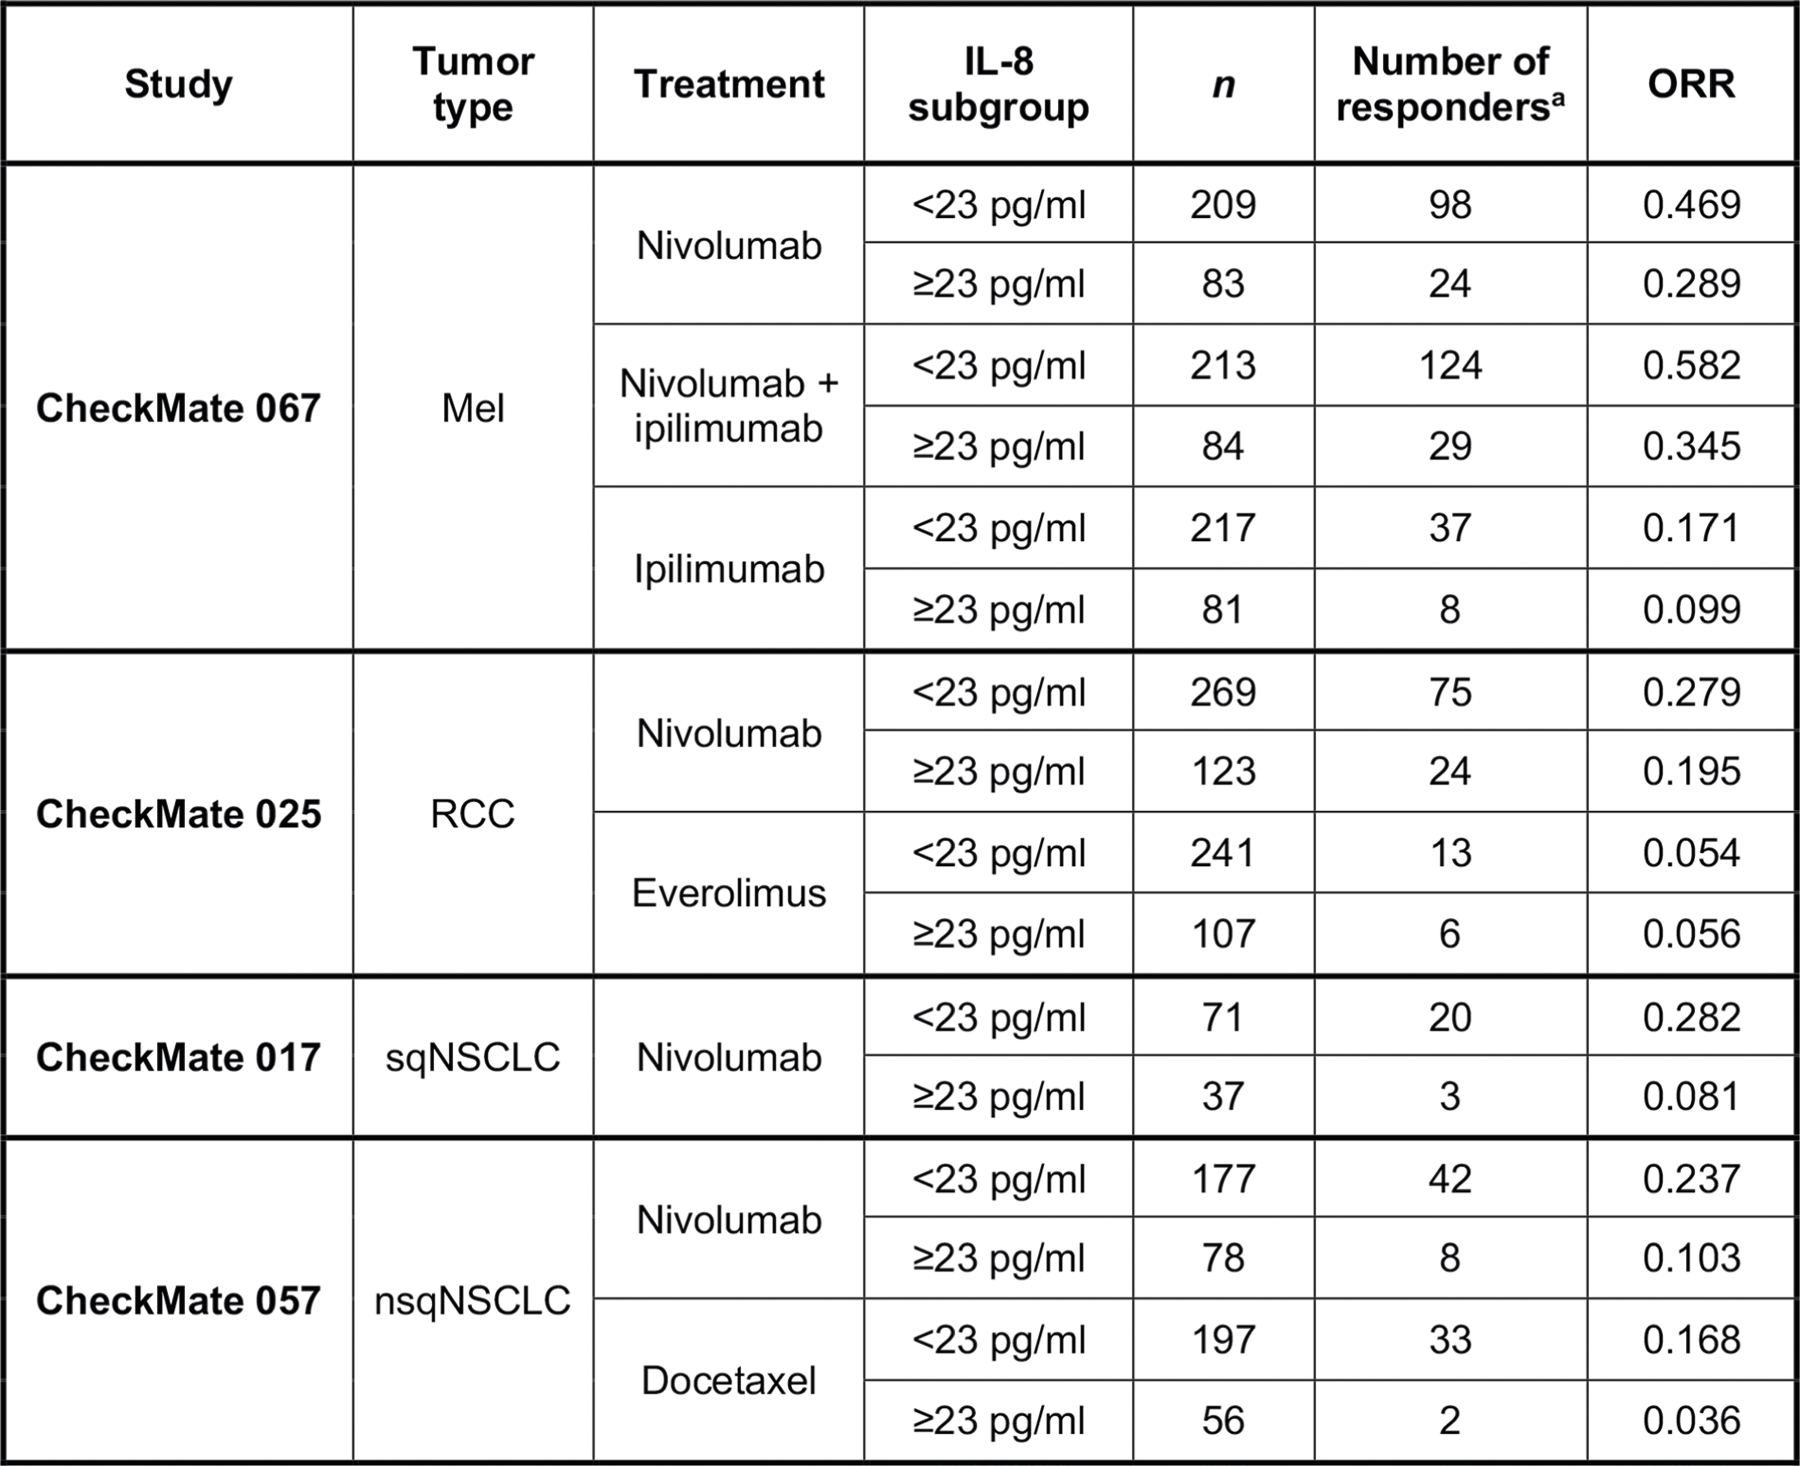
ORR vs baseline serum IL-8 levels <23 pg/ml or ≥23 pg/ml across treatment arms in CheckMate 067 (Mel), CheckMate 025 (RCC), CheckMate 017 (sqNSCLC), and CheckMate 057 (nsqNSCLC). IL, interleukin; Mel, melanoma; nsqNSCLC, nonsquamous non-small cell lung cancer; ORR, objective response rate; RCC, renal cell carcinoma; sqNSCLC, squamous NSCLC. aPatients with complete response or partial response per RECIST v1.1.
Extended Data Fig. 5 |. Percentage of patients in each IL-8 subgroup by PD-L1 status (negative or positive) across cohorts.
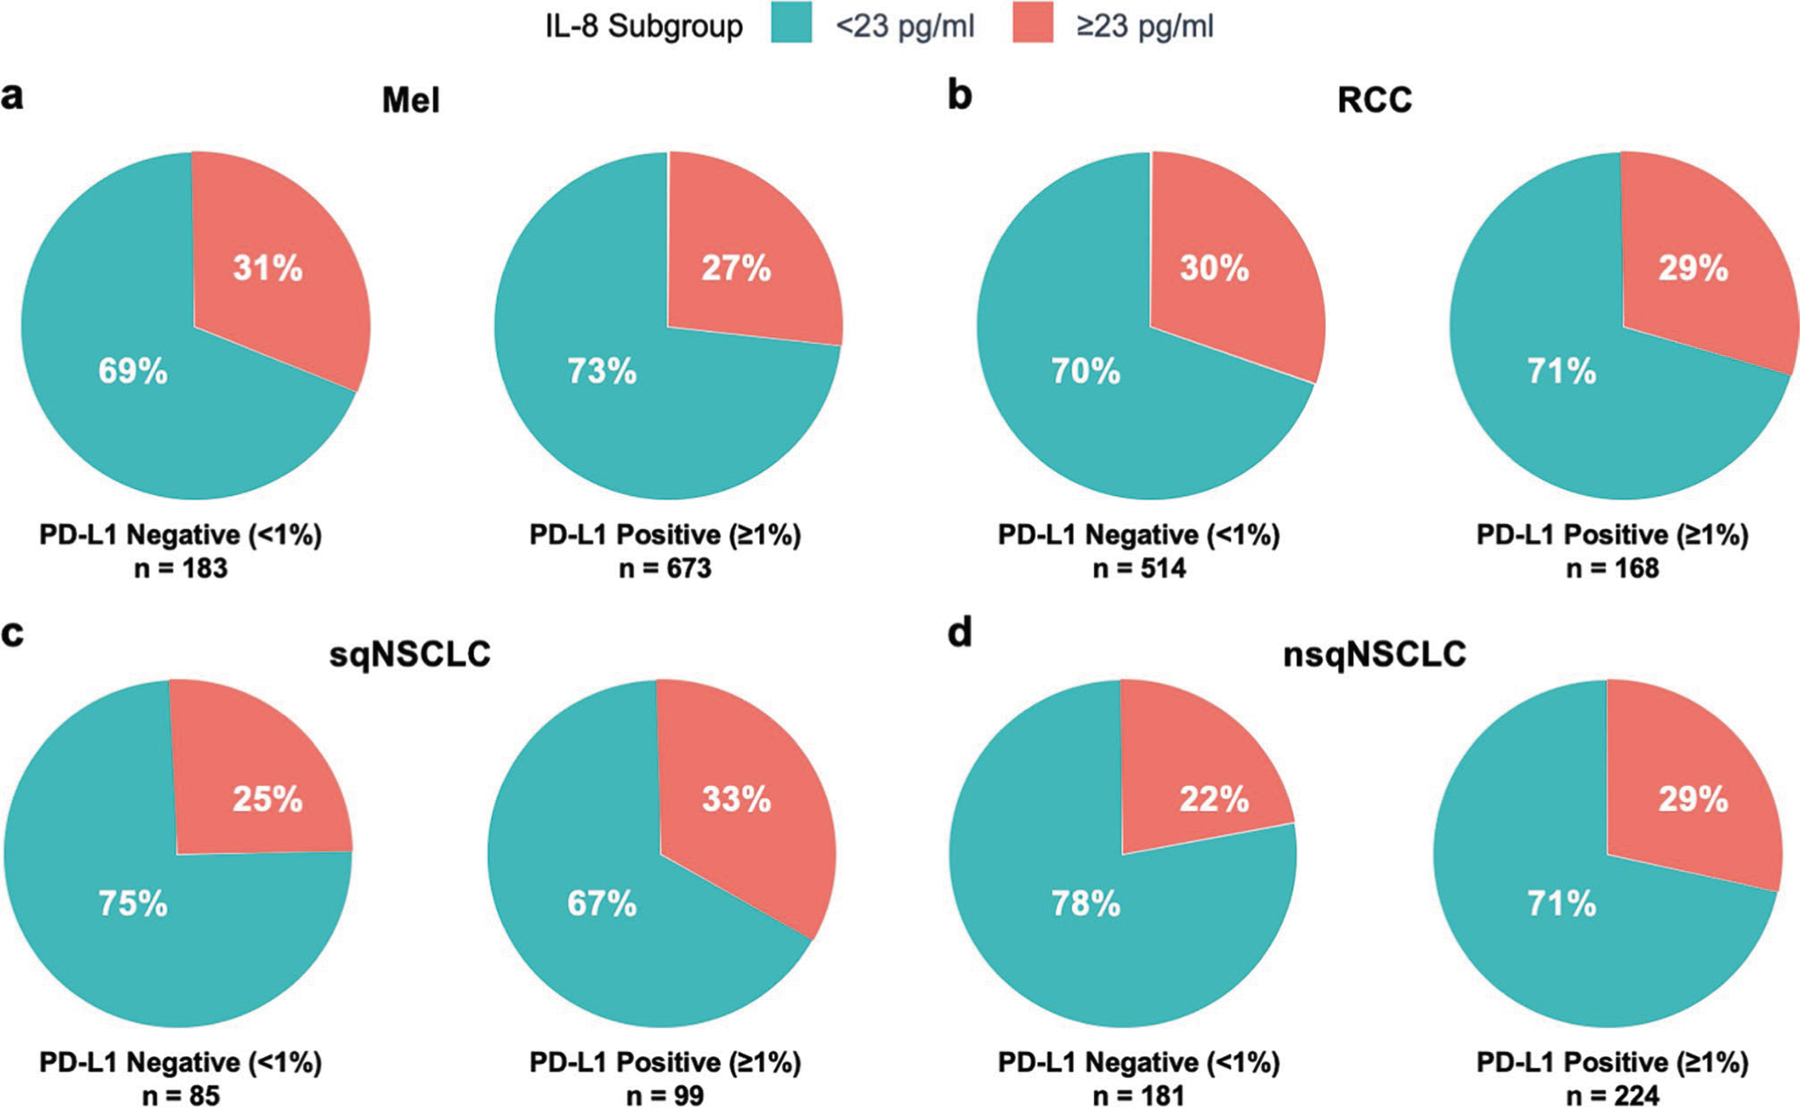
Percentage of patients with baseline serum IL-8 levels <23 pg/ml or ≥23 pg/ml by PD-L1 status (negative [<1%] or positive [≥1%]) in Mel (CheckMate 067 [PD-L1 < 1%, n = 183; PD-L1 ≥ 1%, n = 673; P = 0.296]) (a), RCC (CheckMate 025 [PD-L1 < 1%, n = 514; PD-L1 ≥ 1%, n = 168; P = 0.884]) (b), sqNSCLC (CheckMate 017 [PD-L1 < 1%, n = 85; PD-L1 ≥ 1%, n = 99; P = 0.263]) (c), and nsqNSCLC (CheckMate 057 [PD-L1 < 1%, n = 181; PD-L1 ≥ 1%, n = 224; P = 0.171]) (d). IL, interleukin; Mel, melanoma; nsqNSCLC, nonsquamous non-small cell lung cancer; PD-L1, programmed death-ligand 1; RCC, renal cell carcinoma; sqNSCLC, squamous NSCLC; P, p-value for chi-squared test of independence between IL-8 subgroup (≥23 pg/ml vs < 23 pg/ml) and PD-L1 status (≥1% vs < 1%).
Extended Data Fig. 6 |. Association between IL-8 expression and TMB in human malignancies.
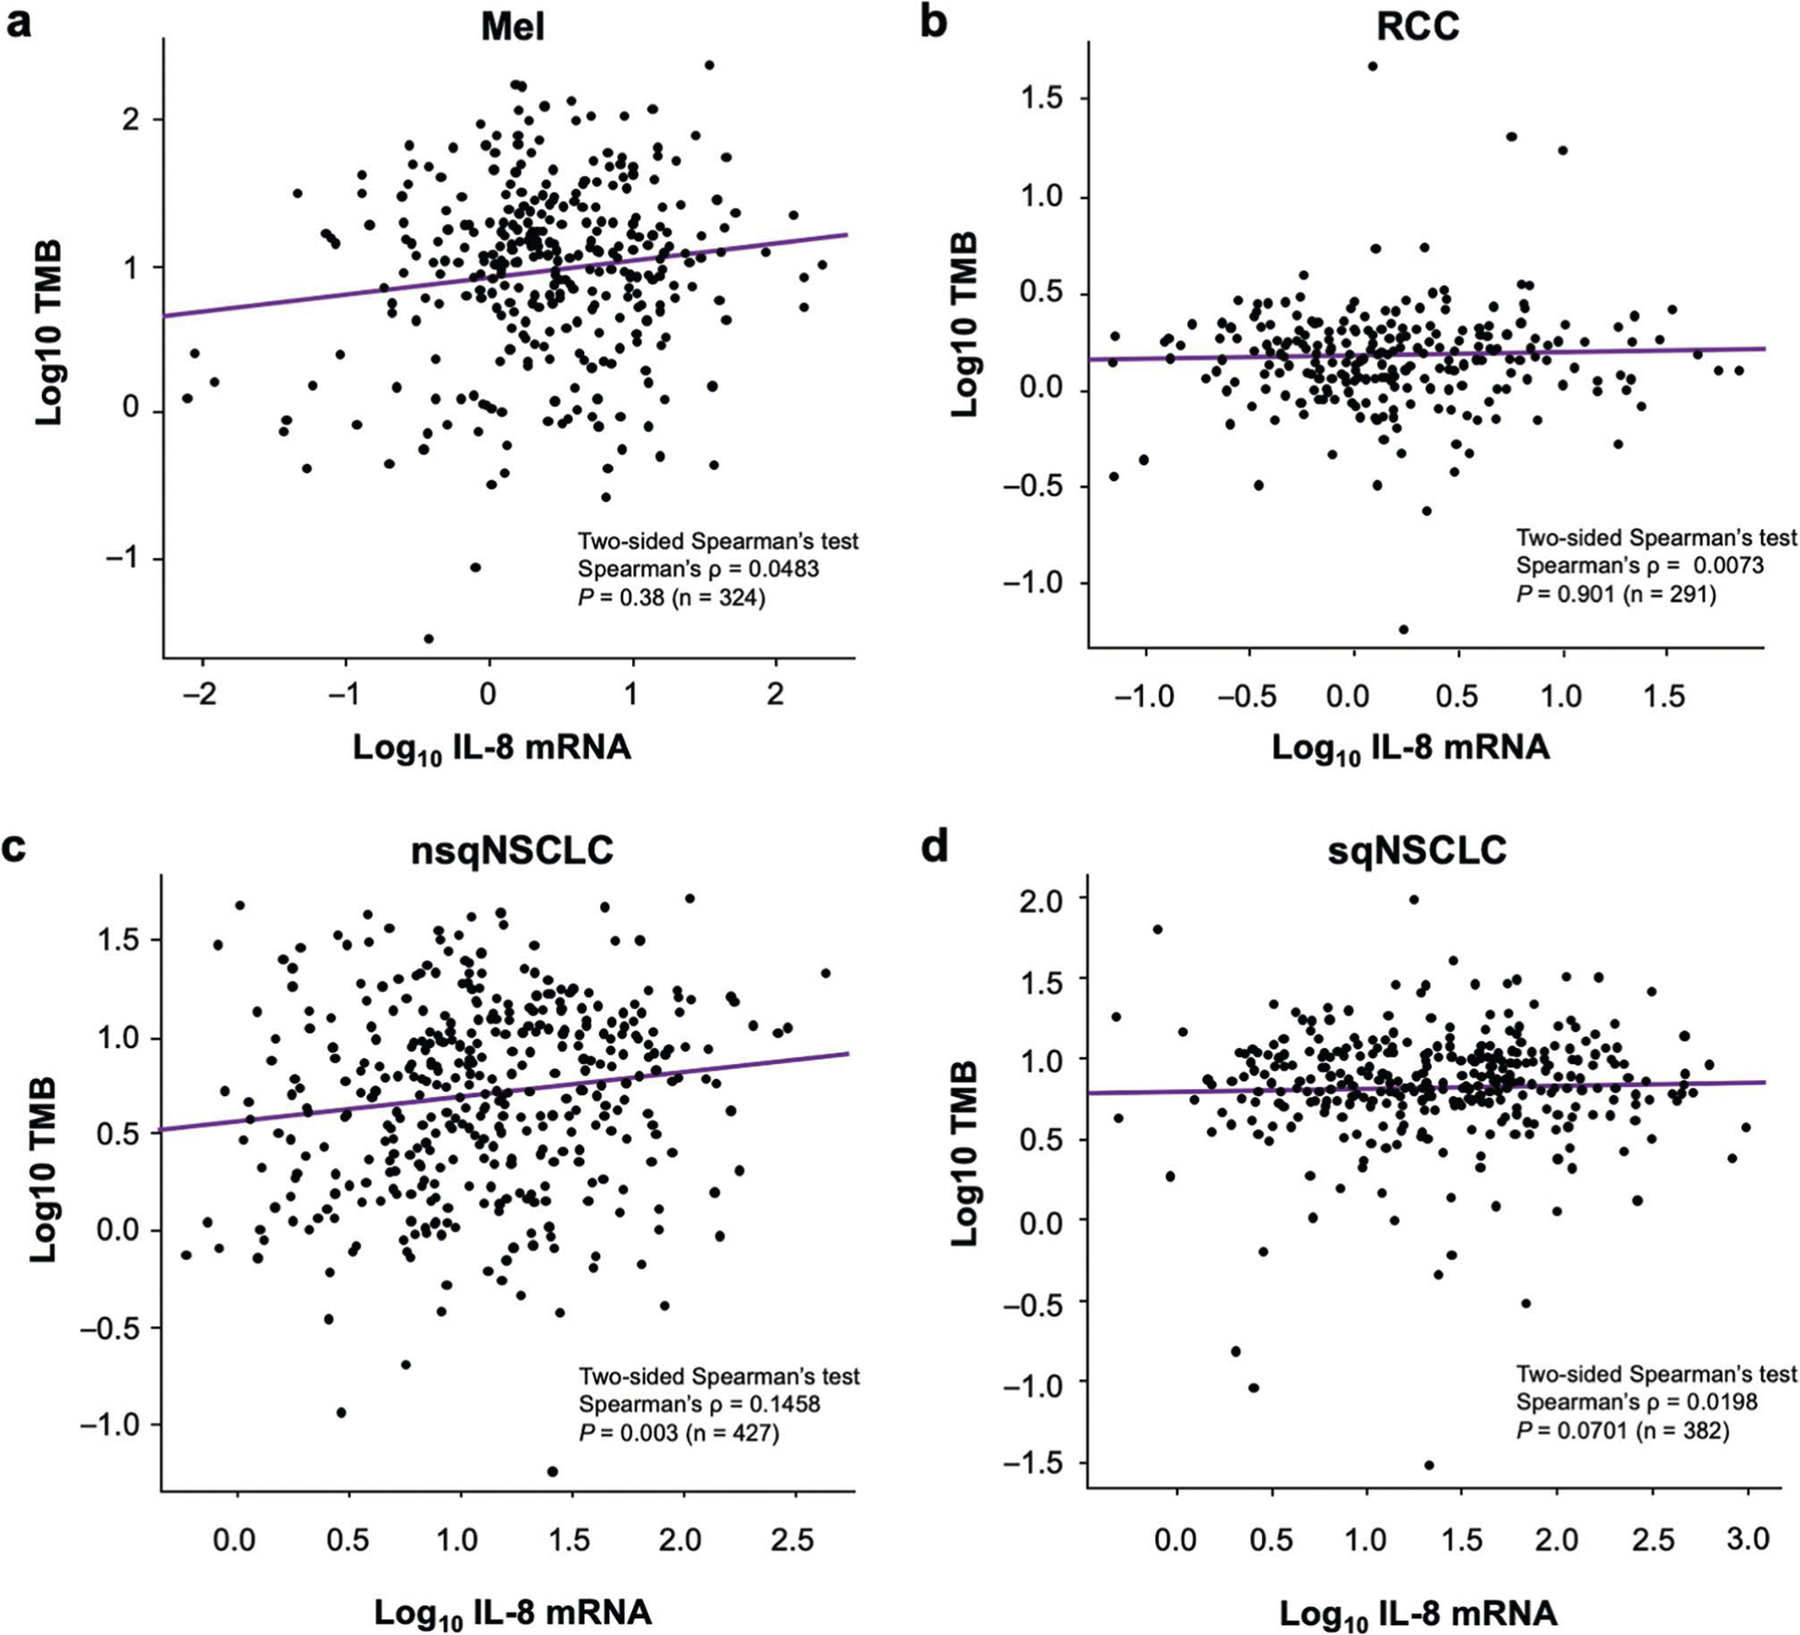
Association between IL-8 mRNA expression and TMB in human Mel (a, n = 324), RCC (b, n = 291), nsqNSCLC (c, n = 427), and sqNSCLC (d, n = 382) from TCGA cohort. The levels of IL-8 transcripts are presented as log10 transformed FPKM units. TMB level was determined as previously reported, including both nonsynonymous and synonymous variants. Dots represent individual samples. Linear regression lines are indicated by purple lines within each chart. IL, interleukin; FPKM, kilobase per million mapped reads; Mel, melanoma; nsqNSCLC, nonsquamous non-small cell lung cancer; RCC, renal cell carcinoma; sqNSCLC, squamous NSCLC; TMB, tumor mutational burden.
Extended Data Fig. 7 |. Youden’s index by baseline IL-8 cutoff (in pg/ml) from OS ROC curve analyses.
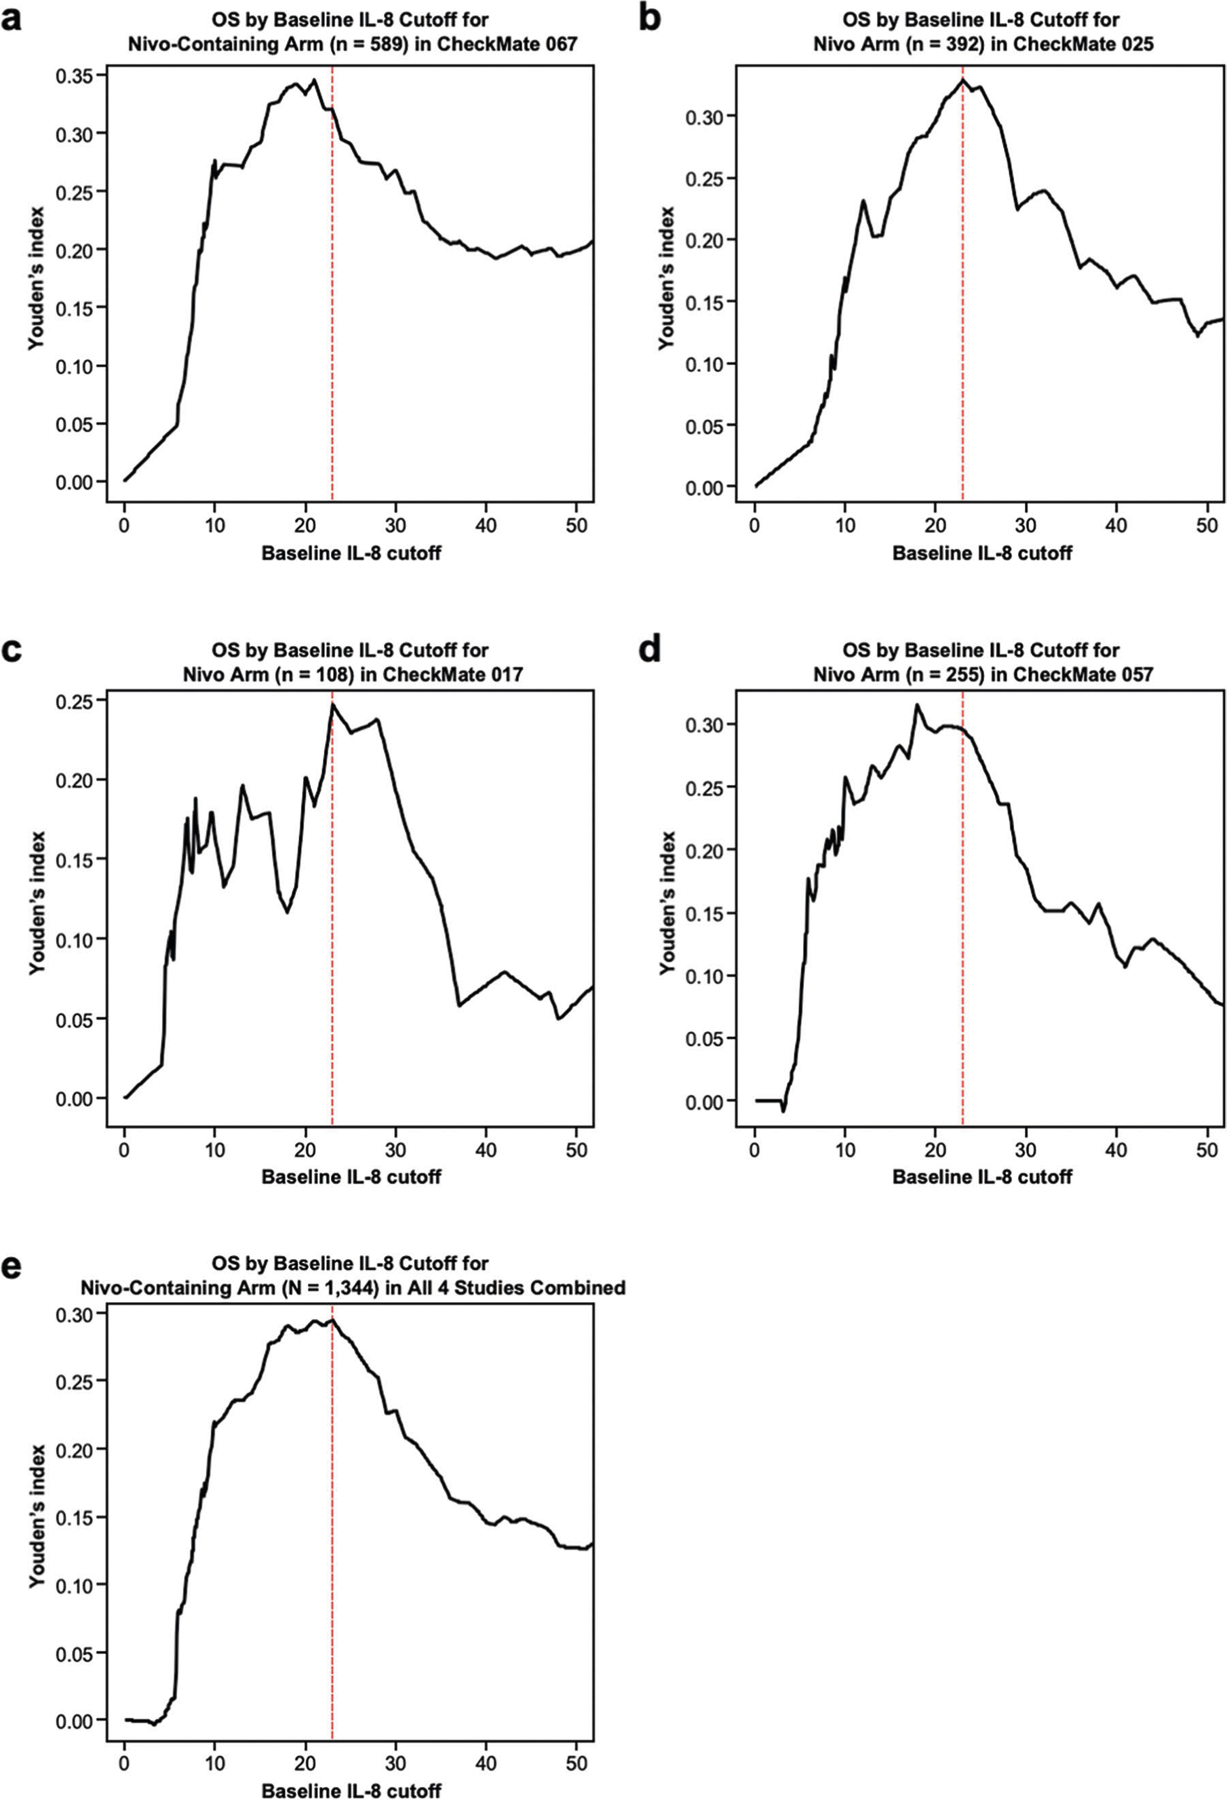
Determination of optimal IL-8 cutoff value for the Nivo-containing arm of CheckMate 067 (n = 589) (a), nivolumab arm of CheckMate 025 (n = 392) (b), nivolumab arm of CheckMate 017 (n = 108) (c), nivolumab arm of CheckMate 057 (n = 255) (d), and all studies pooled (N = 1,344) (e). Red dotted lines indicate 23 pg/ml. IL, interleukin; Nivo, nivolumab; OS, overall survival; ROC, receiver operating characteristic.
Extended Data Fig. 8 |. Peripheral blood and tumor samples from 1,344 patients treated with nivolumab or nivolumab plus ipilimumab in 4 phase 3 clinical trials included in the analyses.
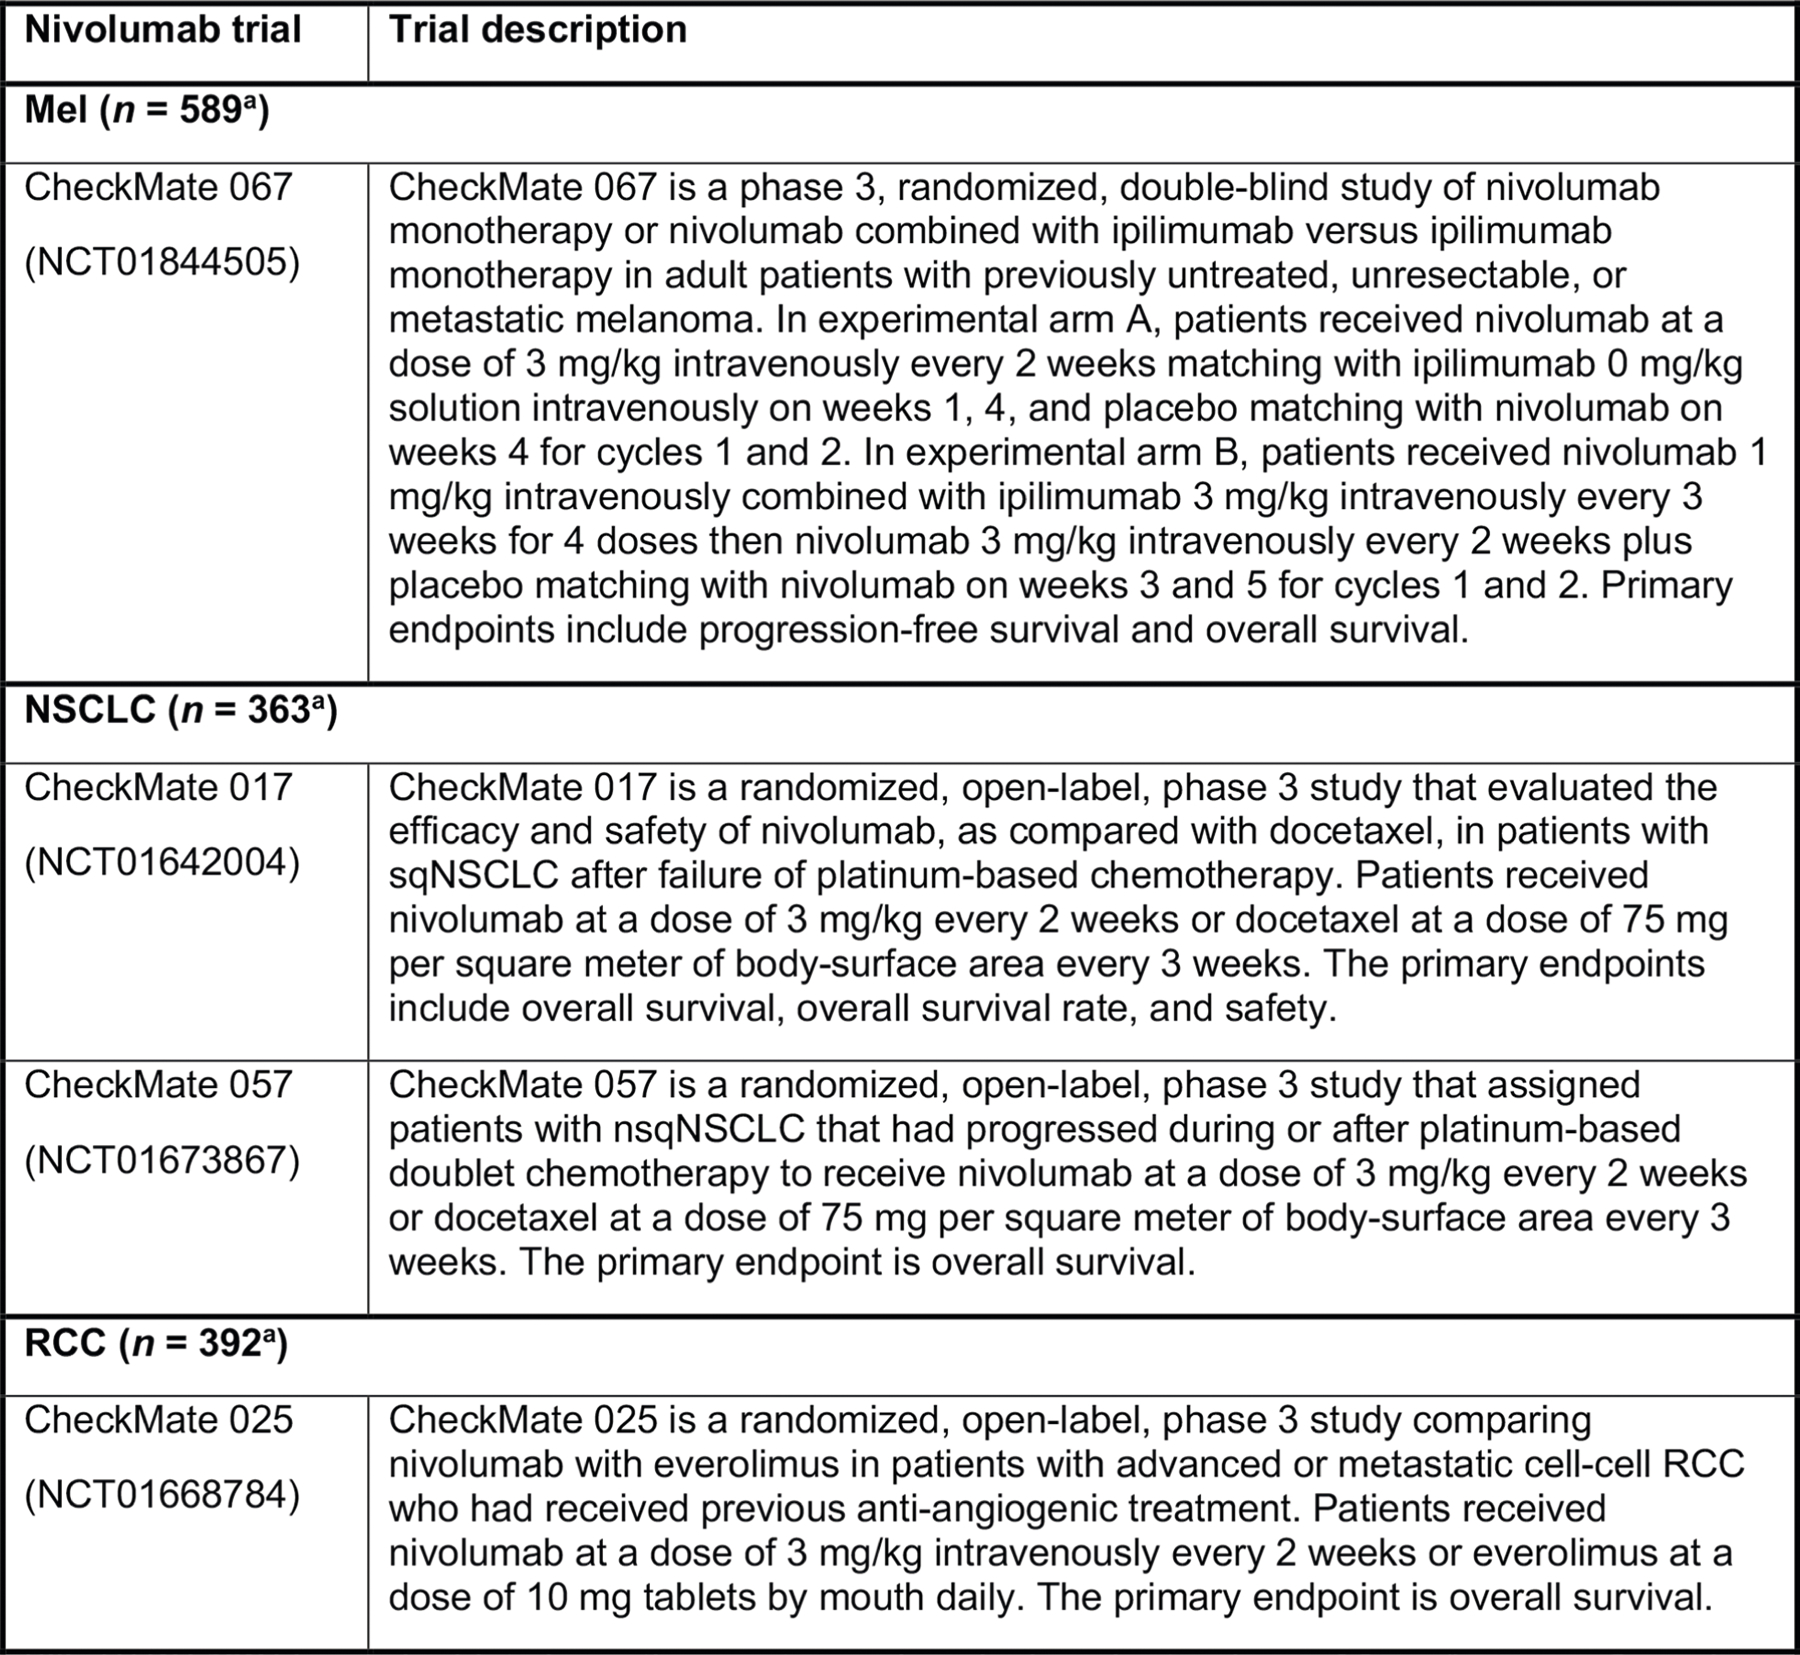
Summary of 4 phase 3 clinical trials (CheckMate 067, CheckMate 017, CheckMate 057, CheckMate 025, N = 1,344 patients). IL, interleukin; Mel, melanoma; nsqNSCLC, nonsquamous non-small cell lung cancer; RCC, renal cell carcinoma; sqNSCLC, squamous NSCLC. aIncludes patients who were treated with nivolumab or nivolumab + ipilimumab and had nonmissing serum IL-8 levels.
Extended Data Fig. 9 |. Kaplan-Meier analyses to assess overall survival stratified by baseline serum IL-8 levels.
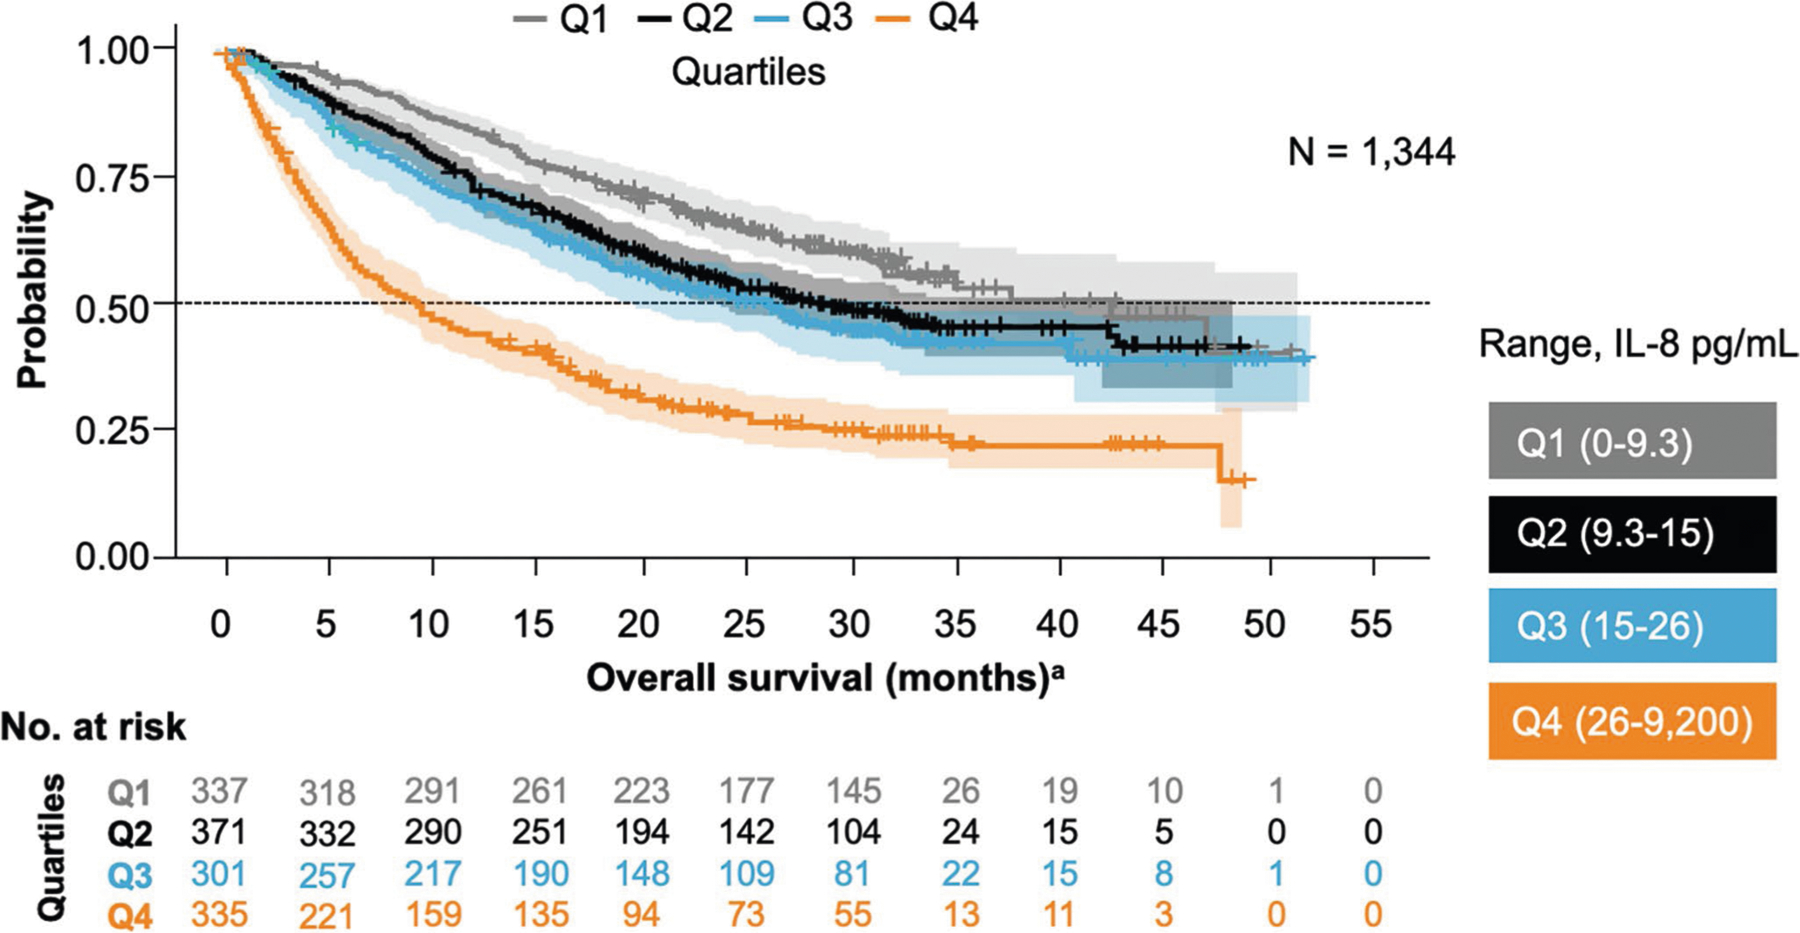
Analysis of pooled data from 1,344 patients receiving nivolumab-based therapy in 4 phase 3 trials—including patients with melanoma, renal cell carcinoma, squamous non-small cell lung cancer, and nonsquamous non-small cell lung cancer—confirmed that elevated baseline serum IL-8 levels were associated with overall survival. This association was significant after adjustment for baseline tumor burden and tumor programmed death-ligand 1 expression (P < 0.001). aOS data from patients in CheckMate trials −017, −057, −067, −025. IL, interleukin.
Supplementary Material
Acknowledgements
We thank the patients and their families who made this study possible and the clinical study teams who participated in this study; DAKO for collaborative development of the PD-L1 IHC 28–8 pharmDx assay; Bristol-Myers Squibb and ONO Pharmaceutical Company Ltd. This study was supported by Bristol-Myers Squibb, Yale SPORE in Lung Cancer (P50CA196530), Department of Defense–Lung Cancer Research Program (W81XWH-16–1-0160), Yale Cancer Center Support Grant (P30CA016359), Stand Up To Cancer–American Cancer Society Lung Cancer Dream Team Translational Research Grant (SU2C-AACR-DT1715 and SU2C-AACR-DT22–17) and a grant from the Mark Foundation (19–029-MIA). I.M. is funded by MINECO SAF2017–83267-C2–1-R (AEI/FEDER, UE; I.M), European Union’s Horizon 2020 research and innovation program (635122, PROCROP) and Fundación de la Asociación Española Contra el Cáncer (AECC). M.F.S. is supported by a Miguel Servet contract from Instituto de Salud Carlos III, Fondo de Investigacion Sanitaria (Spain). The results shown here are in part based on data generated by the TCGA Research Network (https://www.cancer.gov/tcga). Writing and editorial assistance was provided by B. L. Phillips of Chrysalis Medical Communications, funded by Bristol-Myers Squibb.
Footnotes
Online content
Any methods, additional references, Nature Research reporting summaries, source data, extended data, supplementary information, acknowledgements, peer review information; details of author contributions and competing interests; and statements of data and code availability are available at https://doi.org/10.1038/s41591–020-0856-x.
Data availability
K.A.S.’s laboratory designed, conducted, analyzed and interpreted the data presented in Fig. 2b–j and Extended Data Fig. 6 (Yale Human Investigation Committee protocols 9505008219 and 1608018220). Bristol-Myers Squibb funded the studies CheckMate 067 (NCT01844505), CheckMate 017 (NCT01642004), CheckMate 057 (NCT01673867), CheckMate 025 (NCT01668784), CheckMate 038 (NCT01621490) and CheckMate 064 (NCT01783938) and participated in the design, conduct, analyses, and interpretation of these studies and related data (Figs. 1, 2a, Extended Data Figs. 1–3, 5, 7–9). Source data for Figs. 1, 2 and Extended Data Fig. 4 are provided in Supplementary Data 1. Bristol-Myers Squibb’s policy on data sharing may be found at https://www.bms.com/researchers-and-partners/independent-research/data-sharing-request-process.html.
Competing interests
I.M. reports receiving commercial research grants from Bristol-Myers Squibb, Bioncotech, Alligator, AstraZeneca and Roche; has received speakers bureau honoraria from MSD; and is a consultant/advisory board member for Bristol-Myers Squibb, Roche, Genmab, F-Star, Bioncotech, Bayer, Numab, Alligator, Boehringer Ingelheim and AstraZeneca. K.A.S. reports receiving research funding from Genoptix/Navigate (Novartis), Vasculox/Tioma, Tesaro, Moderna Therapeutics, Takeda, Surface Oncology, Pierre-Fabre Research Institute, Merck, Bristol-Myers Squibb, AstraZeneca and Eli Lilly; has received consultant/advisory board fees from Celgene, Moderna Therapeutics, Shattuck Labs, Pierre-Fabre, AbbVie, AstraZeneca, EMD Serono, Ono Pharmaceuticals, Clinica Alemana de Santiago, Dynamo Therapeutics, Torque Therapeutics, Agenus and Takeda; and has received speaker honoraria and/or travel support for meetings from Takeda, Merck, Bristol-Myers Squibb, Fluidigm, Peerview, Biotrac, Cambridge Healthtech Institute, Shattuck Labs and Genentech. J.L.P.-G. reports grants, personal fees and nonfinancial support from Roche, Bristol-Myers Squibb and MSD; and reports grants and personal fees from Ipsen and Eisai, and grants from Incyte and Janssen. M.C., M.Z., S.-P.H., T.C. and Y.F. have a patent (‘Combination Therapy with Anti-IL-8 Antibodies and Anti-PD-1 Antibodies for Treating Cancer’, publication number WO 2019140150). T.P.R. is a co-inventor in a provisional patent application (application number 62/650047) regarding the use of anti-IL-8 and anti-PD1 for the treatment of cancer. M.C., M.Z., T.C., Y.F., S.-P.H., A.M.W, V.B, D.P., T.B., D.L., T.P.R., P.P., J.G. and H.Z. are current or former employees of Bristol-Myers Squibb, which is developing anti-IL-8 (NCT03400332). T.P.R., A.M.W., D.L. and S.-P.H. own stock in Bristol-Myers Squibb. None of the remaining authors have relevant conflicts of interest to report.
Additional information
Extended data is available for this paper at https://doi.org/10.1038/s41591–020-0856-x.
Supplementary information is available for this paper at https://doi.org/10.1038/s41591–020-0856-x.
Peer review information Saheli Sadanand was the primary editor on this article and managed its editorial process and peer review in collaboration with the rest of the editorial team.
References
- 1.Ribas A & Wolchok JD Cancer immunotherapy using checkpoint blockade. Science 359, 1350–1355 (2018). [DOI] [PMC free article] [PubMed] [Google Scholar]
- 2.Havel JJ, Chowell D & Chan TA The evolving landscape of biomarkers for checkpoint inhibitor immunotherapy. Nat. Rev. Cancer 19, 133–150 (2019). [DOI] [PMC free article] [PubMed] [Google Scholar]
- 3.O’Donnell JS, Teng MWL & Smyth MJ Cancer immunoediting and resistance to T cell-based immunotherapy. Nat. Rev. Clin. Oncol 16, 151–167 (2019). [DOI] [PubMed] [Google Scholar]
- 4.Schalper KA, Kaftan E & Herbst RS Predictive biomarkers for PD-1 axis therapies: the hidden treasure or a call for research. Clin. Cancer Res 22, 2102–2104 (2016). [DOI] [PMC free article] [PubMed] [Google Scholar]
- 5.Moore BB et al. Distinct CXC chemokines mediate tumorigenicity of prostate cancer cells. Am. J. Pathol 154, 1503–1512 (1999). [DOI] [PMC free article] [PubMed] [Google Scholar]
- 6.Baggiolini M CXCL8 — the first chemokine. Front. Immunol 6, 285 (2015). [DOI] [PMC free article] [PubMed] [Google Scholar]
- 7.Baggiolini M, Walz A & Kunkel SL Neutrophil-activating peptide-1/interleukin 8, a novel cytokine that activates neutrophils. J. Clin. Invest 84, 1045–1049 (1989). [DOI] [PMC free article] [PubMed] [Google Scholar]
- 8.David JM, Dominguez C, Hamilton DH & Palena C The IL-8/IL-8R axis: a double agent in tumor immune resistance. Vaccines 4, 22 (2016). [DOI] [PMC free article] [PubMed] [Google Scholar]
- 9.Alfaro C et al. Tumor-produced interleukin-8 attracts human myeloid-derived suppressor cells and elicits extrusion of neutrophil extracellular traps (NETs). Clin. Cancer Res 22, 3924–3936 (2016). [DOI] [PubMed] [Google Scholar]
- 10.Sanmamed MF et al. Changes in serum interleukin-8 (IL-8) levels reflect and predict response to anti-PD-1 treatment in melanoma and non-small-cell lung cancer patients. Ann. Oncol 28, 1988–1995 (2017). [DOI] [PMC free article] [PubMed] [Google Scholar]
- 11.Templeton AJ et al. Prognostic role of neutrophil-to-lymphocyte ratio in solid tumors: a systematic review and meta-analysis. J. Natl Cancer Inst 106, dju124 (2014). [DOI] [PubMed] [Google Scholar]
- 12.Coffelt SB, Wellenstein MD & de Visser KE Neutrophils in cancer: neutral no more. Nat. Rev. Cancer 16, 431–446 (2016). [DOI] [PubMed] [Google Scholar]
- 13.Kapanadze T et al. Regulation of accumulation and function of myeloid derived suppressor cells in different murine models of hepatocellular carcinoma. J. Hepatol 59, 1007–1013 (2013). [DOI] [PMC free article] [PubMed] [Google Scholar]
- 14.Gabrilovich DI, Ostrand-Rosenberg S & Bronte V Coordinated regulation of myeloid cells by tumours. Nat. Rev. Immunol 12, 253–268 (2012). [DOI] [PMC free article] [PubMed] [Google Scholar]
- 15.Wargo JA, Reuben A, Cooper ZA, Oh KS & Sullivan RJ Immune effects of chemotherapy, radiation, and targeted therapy and opportunities for combination with immunotherapy. Semin. Oncol 42, 601–616 (2015). [DOI] [PMC free article] [PubMed] [Google Scholar]
- 16.Bilusic M et al. Phase I trial of HuMax-IL8 (BMS-986253), an anti-IL-8 monoclonal antibody, in patients with metastatic or unresectable solid tumors. J. Immunother. Cancer 7, 240 (2019). [DOI] [PMC free article] [PubMed] [Google Scholar]
- 17.Conroy S, Kruyt FAE, Wagemakers M, Bhat KPL & den Dunnen WFA IL-8 associates with a pro-angiogenic and mesenchymal subtype in glioblastoma. Oncotarget 9, 15721–15731 (2018). [DOI] [PMC free article] [PubMed] [Google Scholar]
- 18.Ayers M et al. IFN-γ-related mRNA profile predicts clinical response to PD-1 blockade. J. Clin. Invest 127, 2930–2940 (2017). [DOI] [PMC free article] [PubMed] [Google Scholar]
- 19.Siemers NO et al. Genome-wide association analysis identifies genetic correlates of immune infiltrates in solid tumors. PLoS ONE 12, e0179726 (2017). [DOI] [PMC free article] [PubMed] [Google Scholar]
References
- 20.Larkin J et al. Combined nivolumab and ipilimumab or monotherapy in untreated melanoma. N. Engl. J. Med 373, 23–34 (2015). [DOI] [PMC free article] [PubMed] [Google Scholar]
- 21.Brahmer J et al. Nivolumab versus docetaxel in advanced squamous-cell non-small-cell lung cancer. N. Engl. J. Med 373, 123–135 (2015). [DOI] [PMC free article] [PubMed] [Google Scholar]
- 22.Borghaei H et al. Nivolumab versus docetaxel in advanced nonsquamous non-small-cell lung cancer. N. Engl. J. Med 373, 1627–1639 (2015). [DOI] [PMC free article] [PubMed] [Google Scholar]
- 23.Motzer RJ et al. Nivolumab versus everolimus in advanced renal-cell carcinoma. N. Engl. J. Med 373, 1803–1813 (2015). [DOI] [PMC free article] [PubMed] [Google Scholar]
- 24.Carleton M et al. Serum interleukin 8 (IL-8) may serve as a biomarker of response to immuno-oncology (I-O) therapy. J. Clin. Oncol 36, 3025 (2018). [Google Scholar]
- 25.Ribas A et al. Immunomodulatory effects of nivolumab and ipilimumab in combination or nivolumab monotherapy in advanced melanoma patients: CheckMate 038. Cancer Res 77, CT073 (2017). [Google Scholar]
- 26.Riaz N et al. Tumor and microenvironment evolution during immunotherapy with nivolumab. Cell 171, 934–949 (2017). [DOI] [PMC free article] [PubMed] [Google Scholar]
- 27.Weber JS et al. Sequential administration of nivolumab and ipilimumab with a planned switch in patients with advanced melanoma (CheckMate 064): an open-label, randomised, phase 2 trial. Lancet Oncol 17, 943–955 (2016). [DOI] [PMC free article] [PubMed] [Google Scholar]
- 28.Heagerty PJ, Lumley T & Pepe MS Time-dependent ROC curves for censored survival data and a diagnostic marker. Biometrics 56, 337–344 (2000). [DOI] [PubMed] [Google Scholar]
- 29.The Cancer Genome Atlas Research Network et al. The Cancer Genome Atlas Pan-Cancer analysis project. Nat. Genet 45, 1113–1120 (2013). [DOI] [PMC free article] [PubMed] [Google Scholar]
- 30.Chalmers ZR et al. Analysis of 100,000 human cancer genomes reveals the landscape of tumor mutational burden. Genome Med 9, 34 (2017). [DOI] [PMC free article] [PubMed] [Google Scholar]
- 31.Villarroel-Espindola F et al. Spatially resolved and quantitative analysis of VISTA/PD-1H as a novel immunotherapy target in human non–small cell lung cancer. Clin. Cancer Res 24, 1562–1573 (2018). [DOI] [PMC free article] [PubMed] [Google Scholar]
- 32.Datar I et al. Expression analysis and significance of PD-1, LAG-3, and TIM-3 in human non–small cell lung cancer using spatially resolved and multiparametric single-cell analysis. Clin. Cancer Res 25, 4663–4673 (2019). [DOI] [PMC free article] [PubMed] [Google Scholar]
- 33.Schalper KA et al. Objective measurement and clinical significance of TILs in non-small cell lung cancer. J. Natl Cancer Inst 107, dju435 (2015). [DOI] [PMC free article] [PubMed] [Google Scholar]
Associated Data
This section collects any data citations, data availability statements, or supplementary materials included in this article.


