

Abstract
We describe advances in the understanding of brain dynamics that are important for understanding the operation of the cerebral cortex in health and disease. Peaks in the resting state fMRI BOLD signal in many different brain areas can become synchronized. In data from 1,017 participants from the Human Connectome Project, we show that early visual and connected areas have the highest probability of synchronized peaks. We show that these cortical areas also have low temporal variability of their functional connectivity. We show that there is an approximately reciprocal relation between the probability that a brain region will be involved in synchronized peaks and the temporal variability of the connectivity of a brain region. We show that a high probability of synchronized peaks and a low temporal variability of the connectivity of cortical areas are related to high mean functional connectivity, and provide an account of how these dynamics with some of the properties of avalanches arise. These discoveries help to advance our understanding of cortical operation in health, and in some mental disorders including schizophrenia.
Keywords: avalanches, brain dynamics, human connectome, neuroimaging, resting state fMRI, synchronous events, temporal variability of functional connectivity
Peaks in the resting state BOLD signal of different brain areas can become synchronized and the size of these synchronized events follows a power law distribution, consistent with avalanche dynamics that are found when a system is close to a critical point. We show that a high probability of synchronization events and a low temporal variability of the connectivity of cortical areas are related to high mean functional connectivity, and provide an account of how these dynamics arise, and where they start in the brain.

1. INTRODUCTION
Resting‐state functional magnetic resonance imaging (rs‐fMRI) techniques have contributed significantly to our understanding of brain activity, both in health and disease (Beckmann, DeLuca, Devlin, & Smith, 2005; Buckner & DiNicola, 2019; Damoiseaux et al., 2006; Fox & Raichle, 2007; Rolls, 2021b). Classical methods are based on the continuous fluctuation of the brain blood oxygen level dependent (BOLD) signal. Functional connectivities (FC) then can be measured between spatially separated brain regions, in terms of correlation, coherence, and spatial grouping based on temporal similarities (Hutchison et al., 2013).
In addition, the dynamical fluctuations of the BOLD signals, and how they relate to interactions between brain areas, is a topic of developing interest (Cabral, Kringelbach, & Deco, 2014; Cocchi, Gollo, Zalesky, & Breakspear, 2017; Glomb, Ponce‐Alvarez, Gilson, Ritter, & Deco, 2018). Here we focus on peaks in the BOLD signal of brain regions, and how they can become synchronized between brain regions. We have found that the functional connectivity calculated from these synchronized peaks is closely related to the mean functional connectivity across the whole timeseries (N.Ma, E.T.Rolls and J.Feng, unpublished findings in 2019, which has now been confirmed in an investigation of what were termed “high‐amplitude cofluctuations” [Zamani Esfahlani et al., 2020]). To go beyond this, one hypothesis we wished to test is whether the probability of different cluster sizes of active voxels in a synchronous peak follows a power law distribution, as some avalanche‐like phenomena have characteristics of that type (Tagliazucchi, Balenzuela, Fraiman, & Chialvo, 2012). A second hypothesis was that some brain regions might be especially involved in synchronized events. A third hypothesis was that synchronous peaks might tend to be initiated more in some brain regions. A fourth hypothesis was that synchronized peaks of activity might be related to other measures of brain dynamics, such as the temporal variability of the functional connectivity between different brain areas. A fifth hypothesis was that synchronized peaks, and for that matter the temporal variability of functional connectivity, might be understandable and predictable from other measures, such as the mean functional connectivity between brain areas. We know of no previous investigations of these hypotheses.
One measure we used to investigate brain dynamics and its relation to synchronous peaks was the temporal variability of functional connectivity, which measures how the functional connectivity of a brain region with other brain regions alters across different time windows, which reflects the dynamical reconfiguration of a brain region into different functional modules at different times (Sun et al., 2019; Zhang et al., 2016). Differences in the temporal variability of functional connectivity have been found to be related to creativity (Sun et al., 2019) and mental disorders (Rolls, 2021a; Rolls, 2021b; Rolls, Cheng, & Feng, 2021; Zhang et al., 2016).
Here, we show for the first time how these two properties of brain dynamics, synchronous peaks in brain activity, and the temporal variability of functional connectivity, relate to each other, and can be understood in terms of the underlying functional connectivity of brain regions. We analyzed which brain regions are involved most in synchronous peaks, to provide evidence on where they start.
2. MATERIALS AND METHODS
2.1. Participants
The neuroimaging dataset was selected from the Mar 2017 public data release from the Human Connectome Project (HCP, N = 1,200), WU‐Minn Consortium. Our sample includes 1,017 participants (ages 22–35 years, 546 females) scanned on a 3‐T Siemens connectome‐Skyra scanner, each with four resting state scans with each scan 1,200 time points long with a TR of 0.72 s. Participants without the full 1,200 time points in four resting‐state runs were removed from the analysis in line with a previous investigation (Cheng, Rolls, Ruan, & Feng, 2018), leaving 1,017 participants. Further details of the subjects, and the collection and preprocessing of the data are provided in the Supplementary Material, at the HCP website (http://www.humanconnectome.org/), and in previous studies (Cheng et al., 2018; Rolls et al., 2021).
2.2. The whole‐brain functional connectivity network
After preprocessing using the HCP pipeline (Supplementary Material), the automated anatomical labeling atlas 3 (AAL3) template (Rolls, Huang, Lin, Feng, & Joliot, 2020) was used to construct the whole‐brain functional network. This atlas was used because it defines well not only the orbitofrontal cortex, but also the thalamic nuclei (Rolls, Huang, et al., 2020), and also because it has proved useful in understanding the functional (Du et al., 2020) and anatomical (Hsu et al., 2020) connectivity between different brain areas. The different AAL3 areas are shown in Tables S1 and S2. This atlas has the advantages that it has named brain areas that can be related to neurology; and that the divisions it makes for a number of brain areas, including the orbitofrontal and cingulate cortices, reflect also the parcellation that is found based on functional connectivity (Du et al., 2020). The 132 brain region time series (BOLD signals, and excluding the cerebellum and regions with less than 5 voxels (i.e., the reuniens nucleus of the thalamus [Thal_Re], the ventral tegmental area [VTA], the locus coeruleus [LC], and the Raphe nuclei) were extracted by averaging voxel time series within each AAL3 region. Then, for each subject, the Pearson cross‐correlations between all pairs of regional BOLD signals were calculated to reflect the functional connectivity between region pairs. A brain functional connectivity network that consisted of the 132 brain regions and 8,646 functional connectivity links between them was constructed.
2.3. Peaks in the BOLD signal, and synchronization of peaks across brain areas to form synchronization events
For each brain region, the preprocessed BOLD signals were set to have a mean of zero and normalized by their own SD. Then any BOLD signals that exceeded a predetermined threshold above or below the mean for each brain region were defined as peaks in the BOLD signal, as illustrated in Figure 1. The threshold was set at 2.2 SD. A timeseries of these peaks is illustrated for one HCP participant in Figure 1b. It can be seen that occasionally the peaks across many brain areas become somewhat synchronized with each other. The proportion of brain areas that have a peak defined in this way at the same time (i.e., in the same brain volume taken each TR) is the measure of synchronization. Given that we used 132 AAL3 brain areas, the maximum number of brain areas with a peak at the same timepoint is 132, and then the synchronization has a value of 1.0. A synchronization event was said to have occurred when the synchronization exceeded 0.1 (in practice, when 13 or more regions had a simultaneous peak in the same TR/volume out of the 132 AAL3 regions). (We confirmed that the main findings presented here are robust with respect to the threshold of 2.2 SDs for a peak within the range 1.7–2.7, and to the 0.1 synchronization value within the range 0.05–0.2, as shown in Section 3.1.) In addition, two synchronization events had to be separated by at least 4 s (except as specified in Section 3.1 for only that section), and a temporal filter was used on the peak sum vector with a Gaussian smooth over 5 s, to ensure that each cluster of synchronized peak activity was measured only once. This temporal smoothing was set to not affect the maximum value of the peaks summed over the AAL3 regions. The brain synchronization event rate was defined as the rate of the synchronization events defined as just described.
FIGURE 1.

Detection of peaks in the BOLD signal, and the measure of synchronization. (b) Example of the detection of the peaks (red) that exceeded a threshold of 2.2 SD above or below the mean BOLD signal. (The red lines are at 2.2 SD above and below the mean BOLD signal.) The time axis units are in TR units = 0.72 s. (c) Illustration of how the peaks in the BOLD signal can become synchronized. The brain regions are from the automated anatomical labeling 3 atlas (Rolls, Huang, et al., 2020) with the names of the brain areas shown in Table S1. (d,e) The synchronization measure is the proportion of brain regions with a peak within a given volume acquired in one TR. Smoothing is used, and a threshold can be set to define a synchronization event, in this case at 0.1 of the 132 brain regions
2.4. Temporal variability of the functional connectivity of a brain region
The temporal variability of a brain region was obtained by correlating the FC profile of a brain region across different time windows, which reflects the dynamical reconfiguration of a brain region into distinct functional modules at different times (Rolls et al., 2021; Zhang et al., 2016). To characterize the temporal variability of a given AAL3 brain region (see Figure 1), we first segmented all BOLD signals (see Figure 1a) into n nonoverlapping windows with length l. The whole‐brain FC network F i (an m × m matrix, with m = 132 nodes) in the ith time window was then constructed, with the Pearson correlation being the measure of FC (see Figure 4). The FC profile of region k at time window i is denoted by F i (k,:) (shortened as F i,k, which is an m‐dimensional vector that represents all the functional connections of region k). (This is illustrated in Figure 1 of Zhang et al. (2016).) The variability of a region k is defined as:
We calculated Vk at a number of different window lengths (l = equal to 20, 22, 24, … 40 s) and then took the average value as the final variability to avoid arbitrary choice of window length. In fact, the variability obtained at these different window lengths was highly correlated (r > .98) as indicated in a previous investigation (Zhang et al., 2016). As this metric is little affected by the choice of window length, the average variability over different window lengths was used as stated above.
FIGURE 4.
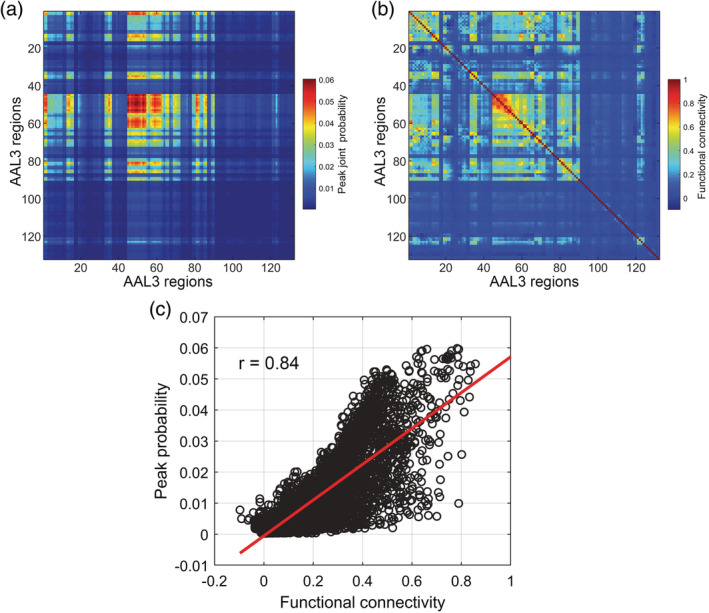
(a) Peak joint probability matrix based on 1,017 participants from the HCP. The matrix shows the probability of one AAL3 region having a peak in a synchronization event, multiplied by the probability of having a peak in another AAL3 region. The early visual cortical areas, regions 47–56 (calcarine cortex, occipital cortex) have the highest joint probability of having peaks in a synchronization event. The threshold SD for a peak was set to 2.2 above and below the mean of the BOLD signal for each region; and the synchronization event threshold was set to 13 (see text). (b) Functional connectivity matrix from the same 1,017 participants from the HCP. (c) Correlation between the joint probabilit y that a pair of AAL3 regions will have a peak that is part of a synchronization event and the functional connectivity between each pair of AAL3 regions from the same participants. Each data point in the scatter plot is a different functional connectivity link, of which there are 8,646 between these 132 AAL3 regions. The line shows the least squares linear fit. The correlation was 0.84 (p < 1 × 10⁻²⁰)
2.5. Probability distributions of the number of peaks in a synchronization event
The probability distribution of the number of peaks (i.e., the size of the synchronization event) in a synchronization event was measured with the Neuronal Avalanche Statistics Package (Marshall et al., 2016; Timme, 2016). The size of a synchronization event is the number of brain regions with a peak in that synchronization event. The Neuronal Avalanche Statistics Package is able to show and illustrate in a log–log graph how well a power law provides a fit for the relation between the event size and the probability of that event size (Marshall et al., 2016; Timme, 2016). If the data do fit a power law, this is an indication of scale invariance, and is a property of avalanche systems that operate close to the critical point of a second order phase transition (Beggs & Plenz, 2003; Cocchi et al., 2017; Marshall et al., 2016; Tagliazucchi et al., 2012). (The results of this are provided in Figure 2.)
FIGURE 2.

Synchronization event statistics. A Power Law was a good fit to the probability of synchronization events of different sizes. The size of a synchronization event was the number of AAL3 brain regions that had a peak of activity in a synchronization event. A peak in the BOLD signal was defined as 2.2 SD from the mean. The tau that was fitted had a value of 2.15
3. RESULTS
3.1. The detection and properties of peaks in the BOLD signal and of synchronization events
Figure 1 shows how peaks were detected in the BOLD signal if they exceeded a threshold (2.2 SDs from the mean though this value was not critical), and how a synchronization event was defined when 0.1 of the 132 automated anatomical labeling atlas (AAL3 (Rolls, Huang, et al., 2020)) brain regions had a peak at the same time. Details are in Section 2.
The statistics of these synchronization events are of interest. For example, if a system operates near a critical point, then the size distribution of its synchronization events can be fit to a power law (Marshall et al., 2016). Figure 2 shows that a power law is a good fit to the size of the synchronization events, using the data from all participants. The best fit τ for the power law (Timme, 2016) was 2.15. The size of a synchronization event was the number of AAL3 brain areas with a peak in a synchronization event. A peak in any brain region was defined as a BOLD signal that exceeded 2.2 SDs from the mean. The interval between synchronization events for this analysis in Section 3.1 only had to be at least one TR (0.72 s), and had a mean value of 79 TRs (57 s). It was found that the shape of the distribution shown in Figure 2 is relatively invariant with respect to the exact threshold that is used to define a peak in a brain region of the BOLD signal, within the range of SD = 1.7–2.7 for the threshold for the detection of a peak. Similar results were obtained when a peak was detected by a positive excursion beyond the threshold, by a negative excursion, or both. Figure 2 includes synchronization events that included one brain area with a peak upwards. A power law was also a good fit if the proportion of brain areas was set at 0.1 to define a synchronization event, which was the value used for the results illustrated in the rest of this article. All the results illustrated in the rest of this article were found to be robust for values for the proportion of brain areas used to define a synchronization event in the range 0.05–0.20.
3.2. The probability of different brain regions being involved in a synchronization event
To investigate how different brain regions are involved in synchronization events, and to investigate where they may be initiated, we calculated the probability that each AAL3 area is involved in a synchronization event, using data from 1,017 participants from the Human Connectome Project. The probability was calculated by taking all synchronization events (i.e., with 0.1 or more of brain areas with a peak during the event), and calculating the probability for each of the 132 brain regions that it had a peak in an event. The result is shown in Figure 3, with time 0 corresponding to the time when the number of peaks in the synchronization event was greatest. The frequency of synchronization events across all participants was 0.012 Hz (i.e., an average of 10.4 synchronization events in the 1,200 long time series with a TR of 0.72 s, corresponding to a mean gap between synchronization events of 83.1 s). It is shown in Figure 3 that the early visual cortical areas, calcarine to occipital gyrus, have the highest probability of being involved in synchronization events. Areas that receive projections from the early visual cortical areas such as the temporal lobe (superior, middle and inferior temporal gyri, and the fusiform gyrus), the precuneus, and the supramarginal gyri, have intermediate probabilities. The lateral prefrontal cortex has a moderate probability of being involved in synchronization events. Some motor/somatosensory areas and areas with functional connectivity with the early visual cortical areas have relatively high probabilities of being in synchronization events. These areas include the precentral gyrus, Rolandic operculum, supplementary motor cortex, paracentral lobule, mid‐cingulate cortex, and the insula. Some areas have a notably low probability of being involved in synchronization events, including the orbitofrontal cortex and ventromedial prefrontal cortex (FrontalMedOrb and gyrus rectus), the hippocampus, parahippocampal gyrus, posterior cingulate cortex and amygdala. (We note that the average time between synchronization events and the probabilities depend on the threshold for detection of a peak in the BOLD signal of 2.2 SDs from the mean, but the findings presented are robust with respect to the exact threshold, with a range of 1.8–2.5 SDs from the mean tested, and with respect to the proportion of 0.1 of brain areas with a synchronous peak used to specify a synchronization event.)
FIGURE 3.
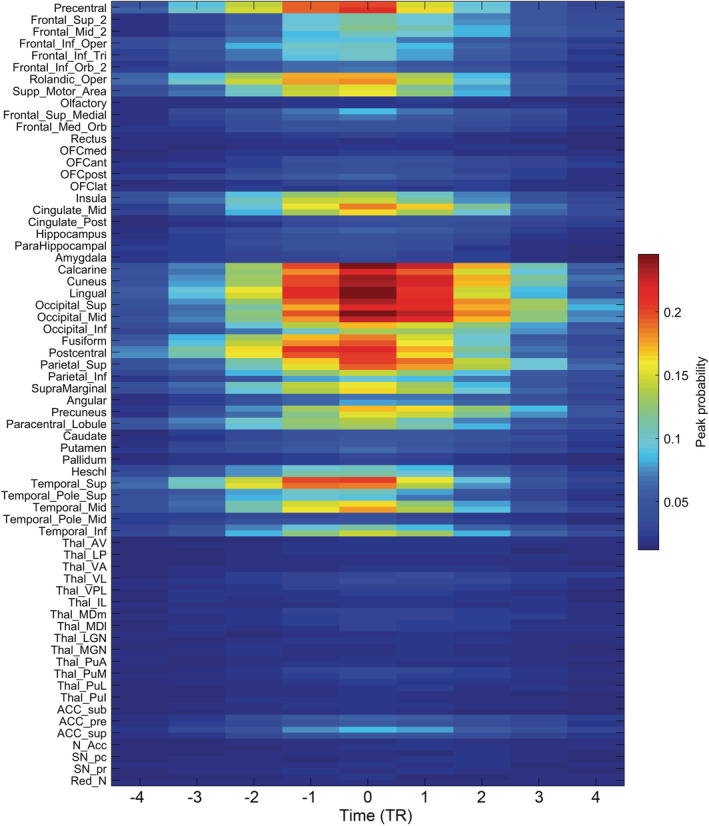
Probability that an AAL3 region will be involved in a synchronization event from the HCP dataset. The threshold SD for a peak of the BOLD signal in any AAL3 region was set to 2.2 above and below the mean of the BOLD signal for each region; and the synchronization event threshold was set to 13.2 (corresponding to a synchronization of 0.1 produced by 1 peak in 0.1 of the 132 AAL3 areas, see text). The figure shows the probability of peaks in different AAL3 brain areas (with left and right combined) as a function of the time of a synchronization event defined by the time at which there were most simultaneous peaks across AAL3 regions. This probability is calculated over all synchronization events in all HCP participants. On the time axis, 0 corresponds to the time of the peak of the synchronization event calculated over all AAL3 areas. The time axis is in TRs, where each TR for HCP is 0.72 s, and a negative value means time before the highest point of the synchronization event
Figure 3 shows the probability of a peak in each of the AAL3 brain areas relative to the highest point of the synchronization event (i.e., the time at which the sum across brain regions of the peaks is maximal). This shows that in terms of when peaks first appear in a brain area relative to the time of maximal synchrony of the synchronization event, the early visual areas and other visual areas connected to them, and also some motor areas (e.g., precentral cortex and Rolandic operculum, and strongly connected somatosensory areas such as postcentral cortex) start to have peaks of activity earliest in the time‐course of the synchronization event, and are thereby implicated in the initiation of synchronization events.
To further investigate the mechanisms that may underlie the generation of synchronization events, we show in Figure 4a the peak joint probability matrix based on 1,017 participants from the HCP. The matrix shows the probability of every AAL3 region having a peak in a synchronization event, multiplied by the probability of having a peak in another AAL3 region. The early visual cortical areas, regions 47–58 (calcarine cortex, occipital cortex) and also some motor areas (e.g., precentral cortex) have the highest joint probability of having peaks in a synchronization event.
3.3. Synchronization events involving brain regions are related to the mean functional connectivity between regions
To investigate whether synchronization events and the brain regions involved in them are related to the connectivity between the brain areas most likely to be involved in synchronization events, we calculated the mean resting state functional connectivity matrix for the same 1,017 HCP participants, and show this in Figure 4b. This has a considerable resemblance to the peak joint probability matrix shown in Figure 4a. To assess their similarity, we measured the correlation for all pairs of AAL3 regions between the synchronization peak joint probabilities and the corresponding functional connectivities, and found a high correlation of 0.84, p << 10−10, as shown in Figure 4c.
This therefore provides an indication that the regions involved in synchronization events are involved depending on the extent that they have high functional connectivity with each other.
3.4. Functional connectivity changes are associated with a synchronization event
To investigate how the functional connectivity may change dynamically in relation to a synchronization event, we performed the analyses illustrated in Figure 5. Figure 5b shows the absolute difference of the functional connectivity between successive time steps as a function of the time before and after a synchronization event. (Each timestep here is 20 TRs = 14.4 s.) This shows that a synchronization event involves a movement in the 14 s before the peak of a synchronization event of the pattern of functional connectivity as shown in the panel “Time 3 – Time 2”; and a movement away from that in the 14 s after the event as shown in panel “Time 5 – Time 4”.
FIGURE 5.

Functional connectivity changes associated with a synchronization event. (a) The index for each time point. The length of each time window is 20 TR (0.72*20 s). (b) The dynamics of the functional connectivity around the synchronization event, with the times as shown in (a), that is, each time is the functional connectivity across 20 TRs. The difference of the functional connectivity between successive timesteps is shown by the t value. (c) The functional connectivity matrix at different times relative to a synchronization event minus the functional connectivity for the whole time series. The differences of the functional connectivity r values are shown. The data are from the 1,017 HCP participants
Further evidence on these changes is shown in Figure 5c, which illustrates the differences from the mean functional connectivity at successive time steps (each again 20 TRs long). Figure 5c shows that the functional connectivity at the top of a synchronization event does not differ from their mean for the early visual cortical areas (47–58), but that the functional connectivity of these early visual cortical areas with the brain regions to which they are connected is higher at the time of a synchronization event.
Taken together, what is shown in Figure 5b,c show that at the time of a synchronization event there is an increase of functional connectivity for the early visual cortical areas and the areas to which they are strongly connected, and that for these connected areas their functional connectivity is higher with early cortical visual areas than their mean across the whole timeseries. It appears thus that the early visual areas recruit other brain areas with which they are well connected just at the time of a synchronization event, and that this is how a synchronization event is generated.
3.5. The probability that different brain regions are involved in synchronization events is inversely related to the temporal variability of the functional connectivity of the different brain regions
We next investigated what relation there might be between the temporal variability of the functional connectivity of an AAL3 region as defined in Section 2, and whether it was likely to be involved in a synchronization event. It is shown in Figure 6d that there is a strong negative correlation (r = −.91, p < 1 × 10⁻¹⁰) between the probability that each AAL3 region is in a synchronization event (averaged across all HCP participants) and the temporal variability of each AAL3 region.
FIGURE 6.

(a) The probability that different AAL3 regions are involved in synchronization events (left) and the temporal variability of different AAL3 regions (right). (b) A brain surface diagram (based on AAL3) showing the temporal variability of different brain regions. The data are from the HCP. (c) A brain surface diagram (based on AAL3) showing the probability that different AAL3 regions are involved in synchronized events. The data are from the HCP. (d) The relation between the probability that each AAL3 region has a peak in a synchronization event and the temporal variability of the Functional Connectivity of each AAL3 region, for the HCP dataset. r = −.91, p < 1.0 × 10⁻¹⁰
To examine the underlying basis for this relationship, we show in Figure 6a (right) the temporal variability of different AAL3 regions. Figure 6b provides a brain surface diagram showing the temporal variability of different brain regions. Figure 6b shows that areas with high temporal variability of the functional connectivity include the amygdala, orbitofrontal cortex, caudate nucleus, cingulate cortex, hippocampus and parahippocampal gyrus, and the Lateral Geniculate and Medial Geniculate nuclei of the thalamus. Areas with low temporal variability of the functional connectivity include early visual cortical areas (lingual, occipital and calcarine; and also the fusiform gyrus); and motor areas (precentral and postcentral, and Rolandic cortex). For comparison (for it is largely the opposite as implied by Figure 6d), Figure 6a (left) shows the probability that each AAL3 region is in a synchronization event, and Figure 6c shows the synchronization event probability for different brain regions.
We can develop an understanding of the relationship between the synchronization event probability and temporal variability of different brain regions in terms of the underlying functional connectivity, illustrated in Figure 4b. This leads to the following hypotheses. Early visual cortical areas have a high probability of being involved in (and initiating) synchronization events because they have high functional connectivity between them, so that if one of these regions moves towards a peak of activity, its very strong functional connectivity with other early visual cortical areas moves them towards a peak of the BOLD signal too. Consistent with this, early visual areas have low temporal variability, partly because they all tend to move together dynamically, because of their strong connections with each other, keeping the temporal variability measure low. This contrasts with other areas such as the hippocampus and parahippocampal gyrus, amygdala, and orbitofrontal cortex that have high temporal variability, relating it is suggested to their connections with many brain regions (like hubs in a graph), and can all therefore move independently of each other dynamically, because they have connections with many brain areas. These same areas, because of their “high degree” connectivity with many brain regions (each not necessarily very strong), and of their weak connections with each other, tend not to get dragged into synchronization events. For early visual cortical areas in the above, we can also include conceptually some other areas that are strongly connected with each other, but not with widespread areas of the brain. These other areas include some motor areas such as premotor cortex, pre‐ and postcentral cortex, supplementary motor area, and perhaps the basal ganglia (putamen and pallidum especially).
Thus, the key to understanding synchronization events and temporal variability is the mean functional connectivity between pairs of brain regions, we propose, in the ways just outlined.
4. DISCUSSION
We have shown here how synchronization events in brain activity are related to the underlying functional connectivity (Figures 4 and 5). Synchronization events are evident as synchronized high activity involving a number of different brain regions each of which has a peak of activity at about the same time (Figure 1). We show that early visual cortical areas are the most probable areas to be involved in synchronization events (Figure 3), and relate this to the high functional connectivity between early visual cortical areas, so that if one area has high activity at a particular time, this may propagate easily to the other early visual cortical areas. We further relate the extent to which other cortical areas are involved in synchronization events to their connectivity with early visual cortical areas (Figures 4 and 5). These other areas include the temporal and parietal cortical areas (Figures 3 and 4). We also note that some movement‐related cortical areas, including the precentral gyrus, are also likely to be involved in synchronization events (Figure 3), but even here this may be related to functional connectivity with each other and with early visual cortical areas (Figure 4b). The medial prefrontal areas including the ventromedial prefrontal cortex, and the hippocampus and amygdala, are unlikely to be involved in synchronization events, and this again reflects the functional connectivity with early visual cortical areas, which for these areas is low (Figure 4b). The analysis of the dynamics of synchronization events shows (Figure 5) that this involves a movement of the pattern of functional connectivity towards that at the time of a synchronization event, and also a build‐up in the magnitude of the functional connectivity at the time of a synchronization event, with these changes taking place during 10 s before and after a synchronization event. The analysis shown in Figure 3 is consistent with the hypothesis that the early visual cortical areas and their connections to high order visual cortical areas, and to some extent motor areas, are involved in the initiation of synchronization events, in that these regions start to have peaks of activity before the highest point of a synchronization event has been reached.
The account provided here of the key brain systems involved in synchronization events is based on measurements from 132 different brain areas. In contrast, a different approach was couched in terms of complex interactions between high‐level networks “High amplitude cofluctuations are underpinned by the activation of a particular spatial mode of brain activity in which default mode and control networks are anticorrelated with sensorimotor and attentional systems” (Zamani Esfahlani et al., 2020).
A strong negative correlation between the probability that an AAL3 region would be involved in a synchronization event, and the temporal variability of the mean functional connectivity of each AAL3 region, was revealed for the first time (Figure 6d). Further investigation showed that the temporal variability of the functional connectivity of different AAL3 brain regions (Figure 6) is low in areas such as the early visual cortical areas with high mean (i.e., averaged over the whole of the resting‐state fMRI session) functional connectivity with each other (Figure 4b); and is high in areas such as the orbitofrontal cortex, amygdala, and hippocampus which have relatively low functional connectivity with early visual cortical areas, as well as connectivity with a number of different brain regions in a hub‐like way (Figure 4b). We propose the because of the high positive interconnectivity of the early visual cortical areas, they tend to act together to support activity in each other, and therefore have relatively low temporal variability of their functional connectivity.
This then also enables us to link the variability and mean functional connectivity to synchronization events, which we propose tend to be generated in and have a high probability of including early visual cortical areas because of their strong functional connectivity with each other, so that if some have a peak of activity, this may tend to promote a peak of activity of the other strongly connected visual cortical areas. This thus provides a unifying account of synchronization events and temporal variability in terms of the underlying mean functional connectivity. We note that the functional connectivity measured at the time of synchronization events reflects the mean functional connectivity (Zamani Esfahlani et al., 2020). We further note that the power law statistics of the synchronization peaks described here provide an indication of scale invariance, and are a property of avalanche systems that operate close to the critical point of a second order phase transition (Beggs & Plenz, 2003; Cocchi et al., 2017; Marshall et al., 2016; Tagliazucchi et al., 2012). The synchronization peaks or avalanches are thus an important property of dynamical systems that go beyond the mean functional connectivities between brain areas. Moreover, the understanding of the changing dynamics of the brain as a system can be informative about the dynamical properties of brain systems that appear to be present in mental disorders including schizophrenia, ADHD, and depression, as described elsewhere (Rolls, 2021a; Rolls et al., 2021; Rolls, Cheng, & Feng, 2020), and referred to next.
Finally, there are clinical applications of the types of analysis described here (Rolls, 2021a; Rolls, 2021b; Rolls et al., 2021). In both first episode and long‐term schizophrenia, reduced functional connectivity of early visual and related temporal cortex areas is associated with increased temporal variability of the functional connectivity, consistent with decreased stability of attractor networks related to sensory processing (Rolls et al., 2021). Consistent with this, in chronic schizophrenia there were fewer synchronization events (5.2/380 s) compared to 5.8/380 s in the controls (t = −3.3 p = .001). In ADHD, these functional connectivities of early visual and related temporal cortex areas were increased and their temporal variability was decreased, and this was related to increased engagement with visual sensory input as manifest in high screen time usage in ADHD (Rolls et al., 2021). These differences in the brain dynamics relate to the symptoms. The greater temporal variability of the functional connectivity in schizophrenia may be related to the difficulty in maintaining attention and to the loose thought associations that may be made. Conversely, the reduced temporal variability of ADHD may be related to being locked in strongly to dominating sensory inputs (Rolls et al., 2021). These discoveries thus help to advance our understanding of cortical operation in health, and in some mental disorders (Rolls, 2021b).
5. CONCLUSIONS
The research described here leads to the following conclusions:
When peaks in the resting state fMRI BOLD signal in different brain areas become synchronized to form synchronization events, early visual and connected areas have the highest probability of synchronization events.
Early visual and connected areas have low temporal variability of their functional connectivity.
There is an approximately reciprocal relation between the probability that a brain region will be involved in synchronization events and the temporal variability of the connectivity of a brain area (Figure 6d).
We show that a high probability of synchronization events and a low temporal variability of the connectivity of cortical areas is related to high mean functional connectivity, and provide an account of how these dynamics arise.
The findings described here are consistent with the hypothesis that avalanche‐like phenomena are evident in the fMRI signals recorded from different brain areas, and that the brain is operating close to a critical point.
CONFLICT OF INTEREST
The authors have no relevant interests to declare.
ETHICAL APPROVAL
No data were collected as part of the research described here. The data were from the Human Connectome Project, and the WU‐Minn HCP Consortium obtained full informed consent from all participants, and research procedures and ethical guidelines were followed in accordance with the Institutional Review Boards (IRB), as set out in the Supplementary Material.
AUTHOR CONTRIBUTIONS
Edmund T. Rolls conceived the study, took part in the analyses, and wrote the article. Wei Cheng discussed and performed the analyses of the data and their preparation for inclusion in the article, and took part in writing the article. Jianfeng Feng took part in initiating and funding the investigation, and considered the findings. All authors approved the article.
Supporting information
Appendix S1: Supporting information
ACKNOWLEDGMENTS
W. C. is supported by grants from the National Natural Sciences Foundation of China (No. 82071997) and Natural Science Foundation of Shanghai (No. 18ZR1404400). J. F. is supported by National Key R&D Program of China (2019YFA0709502, the 111 Project (NO. B18015), the key project of Shanghai Science &Technology (No.16JC1420402), Shanghai Municipal Science and Technology Major Project (No. 2018SHZDZX01) and ZJLab, National Key R&D Program of China (No 2018YFC1312900, National Natural Science Foundation of China (NSFC 91630314).
Rolls ET, Cheng W, Feng J. Brain dynamics: Synchronous peaks, functional connectivity, and its temporal variability. Hum Brain Mapp. 2021;42:2790–2801. 10.1002/hbm.25404
Edmund T. Rolls and Wei Cheng are co‐first authors.
Funding information National Natural Sciences Foundation of China (No. 82071997); Natural Science Foundation of Shanghai (No. 18ZR1404400); National Key R&D Program of China (2019YFA0709502); 111 Project (NO. B18015); Key project of Shanghai Science &Technology (No.16JC1420402); Shanghai Municipal Science and Technology Major Project (No. 2018SHZDZX01); ZJLab, National Key R&D Program of China (No 2018YFC1312900, National Natural Science Foundation of China (NSFC 91630314).
Contributor Information
Edmund T. Rolls, Email: edmund.rolls@oxcns.org.
Jianfeng Feng, Email: jianfeng64@gmail.com.
DATA AVAILABILITY STATEMENT
The dataset for the Human Connectome project is available at http://www.humanconnectome.org/. Standard code functions available in Matlab and SPM were used.
REFERENCES
- Beckmann, C. F. , DeLuca, M. , Devlin, J. T. , & Smith, S. M. (2005). Investigations into resting‐state connectivity using independent component analysis. Philosophical Transactions of the Royal Society of London. Series B, Biological Sciences, 360, 1001–1013. [DOI] [PMC free article] [PubMed] [Google Scholar]
- Beggs, J. M. , & Plenz, D. (2003). Neuronal avalanches in neocortical circuits. The Journal of Neuroscience, 23, 11167–11177. [DOI] [PMC free article] [PubMed] [Google Scholar]
- Buckner, R. L. , & DiNicola, L. M. (2019). The brain's default network: Updated anatomy, physiology and evolving insights. Nature Reviews. Neuroscience, 20, 593–608. [DOI] [PubMed] [Google Scholar]
- Cabral, J. , Kringelbach, M. L. , & Deco, G. (2014). Exploring the network dynamics underlying brain activity during rest. Progress in Neurobiology, 114, 102–131. [DOI] [PubMed] [Google Scholar]
- Cheng, W. , Rolls, E. T. , Ruan, H. , & Feng, J. (2018). Functional connectivities in the brain that mediate the association between depressive problems and sleep quality. JAMA Psychiatry, 75, 1052–1061. [DOI] [PMC free article] [PubMed] [Google Scholar]
- Cocchi, L. , Gollo, L. L. , Zalesky, A. , & Breakspear, M. (2017). Criticality in the brain: A synthesis of neurobiology, models and cognition. Progress in Neurobiology, 158, 132–152. [DOI] [PubMed] [Google Scholar]
- Damoiseaux, J. S. , Rombouts, S. A. , Barkhof, F. , Scheltens, P. , Stam, C. J. , Smith, S. M. , & Beckmann, C. F. (2006). Consistent resting‐state networks across healthy subjects. Proceedings of the National Academy of Sciences of the United States of America, 103, 13848–13853. [DOI] [PMC free article] [PubMed] [Google Scholar]
- Du, J. , Rolls, E. T. , Cheng, W. , Li, Y. , Gong, W. , Qiu, J. , & Feng, J. (2020). Functional connectivity of the orbitofrontal cortex, anterior cingulate cortex, and inferior frontal gyrus in humans. Cortex, 123, 185–199. [DOI] [PubMed] [Google Scholar]
- Fox, M. D. , & Raichle, M. E. (2007). Spontaneous fluctuations in brain activity observed with functional magnetic resonance imaging. Nature Reviews. Neuroscience, 8, 700–711. [DOI] [PubMed] [Google Scholar]
- Glomb, K. , Ponce‐Alvarez, A. , Gilson, M. , Ritter, P. , & Deco, G. (2018). Stereotypical modulations in dynamic functional connectivity explained by changes in BOLD variance. NeuroImage, 171, 40–54. [DOI] [PubMed] [Google Scholar]
- Hsu, C.‐C. H. , Rolls, E. T. , Huang, C.‐C. , Chong, S. T. , Lo, C.‐Y. Z. , Feng, J. , & Lin, C.‐P. (2020). Connections of the human orbitofrontal cortex and inferior frontal gyrus. Cerebral Cortex, 30, 5830–5843. [DOI] [PubMed] [Google Scholar]
- Hutchison, R. M. , Womelsdorf, T. , Allen, E. A. , Bandettini, P. A. , Calhoun, V. D. , Corbetta, M. , … Chang, C. (2013). Dynamic functional connectivity: Promise, issues, and interpretations. NeuroImage, 80, 360–378. [DOI] [PMC free article] [PubMed] [Google Scholar]
- Marshall, N. , Timme, N. M. , Bennett, N. , Ripp, M. , Lautzenhiser, E. , & Beggs, J. M. (2016). Analysis of power laws, shape collapses, and neural complexity: New techniques and MATLAB support via the NCC toolbox. Frontiers in Physiology, 7, 250. [DOI] [PMC free article] [PubMed] [Google Scholar]
- Rolls, E. T. (2021a). Attractor cortical neurodynamics, schizophrenia, and depression. Translational Psychiatry invited paper. [DOI] [PMC free article] [PubMed] [Google Scholar]
- Rolls, E. T. (2021b). Brain computations: What and How. Oxford: Oxford University Press. [Google Scholar]
- Rolls, E. T. , Cheng, W. , & Feng, J. (2020). The orbitofrontal cortex: Reward, emotion, and depression. Brain Communications, 2, fcaa196. [DOI] [PMC free article] [PubMed] [Google Scholar]
- Rolls, E. T. , Cheng, W. , & Feng, J. (2021). Brain dynamics: The temporal variability of connectivity, and differences in schizophrenia and ADHD. Translational Psychiatry, 11, 70. [DOI] [PMC free article] [PubMed] [Google Scholar]
- Rolls, E. T. , Huang, C. C. , Lin, C. P. , Feng, J. , & Joliot, M. (2020). Automated anatomical labelling atlas 3. NeuroImage, 206, 116189. [DOI] [PubMed] [Google Scholar]
- Sun, J. , Liu, Z. , Rolls, E. T. , Chen, Q. , Yao, Y. , Yang, W. , … Qiu, J. (2019). Verbal creativity correlates with the temporal variability of brain networks during the resting state. Cerebral Cortex, 29, 1047–1058. [DOI] [PubMed] [Google Scholar]
- Tagliazucchi, E. , Balenzuela, P. , Fraiman, D. , & Chialvo, D. R. (2012). Criticality in large‐scale brain FMRI dynamics unveiled by a novel point process analysis. Frontiers in Physiology, 3, 15. [DOI] [PMC free article] [PubMed] [Google Scholar]
- Timme, N. M. (2016). Neuronal avalanche statistics package . Retrieved from http://www.nicholastimme.com.
- Zamani Esfahlani, F. , Jo, Y. , Faskowitz, J. , Byrge, L. , Kennedy, D. P. , Sporns, O. , & Betzel, R. F. (2020). High‐amplitude cofluctuations in cortical activity drive functional connectivity. Proceedings of the National Academy of Sciences of the United States of America, 117, 28393–28401. [DOI] [PMC free article] [PubMed] [Google Scholar]
- Zhang, J. , Cheng, W. , Liu, Z. , Zhang, K. , Lei, X. , Yao, Y. , … Feng, J. (2016). Neural, electrophysiological and anatomical basis of brain‐network variability and its characteristic changes in mental disorders. Brain, 139, 2307–2321. [DOI] [PubMed] [Google Scholar]
Associated Data
This section collects any data citations, data availability statements, or supplementary materials included in this article.
Supplementary Materials
Appendix S1: Supporting information
Data Availability Statement
The dataset for the Human Connectome project is available at http://www.humanconnectome.org/. Standard code functions available in Matlab and SPM were used.