

Abstract
Introduction
Predictive biomarkers of Parkinson’s Disease progression are needed to expedite neuroprotective treatment development and facilitate prognoses for patients. This work uses measures derived from resting-state functional magnetic resonance imaging, including regional homogeneity (ReHo) and fractional amplitude of low frequency fluctuations (fALFF), to predict an individual’s current and future severity over up to 4 years and to elucidate the most prognostic brain regions.
Methods
ReHo and fALFF are measured for 82 Parkinson’s Disease subjects and used to train machine learning predictors of baseline clinical and future severity at 1 year, 2 years, and 4 years follow-up as measured by the Movement Disorder Society Unified Parkinson’s Disease Rating Scale (MDS-UPDRS). Predictive performance is measured with nested cross-validation, validated on an external dataset, and again validated through leave-one-site-out cross-validation. Important predictive features are identified.
Results
The models explain up to 30.4% of the variance in current MDS-UPDRS scores, 55.8% of the variance in year 1 scores, and 47.1% of the variance in year 2 scores (p < 0.0001). For distinguishing high and low-severity individuals at each timepoint (MDS-UPDRS score above or below the median, respectively), the models achieve positive predictive values up to 79% and negative predictive values up to 80%. Higher ReHo and fALFF in several regions, including components of the default motor network, predicted lower severity across current and future timepoints.
Conclusion
These results identify an accurate prognostic neuroimaging biomarker which may be used to better inform enrollment in trials of neuroprotective treatments and enable physicians to counsel their patients.
Keywords: Parkinson’s Disease, neuroimaging, functional MRI, prognosis, machine learning
1. Introduction
In Parkinson’s disease (PD), there is no clinically accepted neurophysiological biomarker of disease severity or future disease state [1,2]. Such a biomarker would not only assist in prognosis, but also improve the design of neuroprotective treatment trials. In such trials, treatment outcomes are typically measured through clinical assessments of dopaminergic symptomatology, which do not fully quantify the underlying disease progression targeted by candidate neuroprotective drugs [1,2]. A biomarker that can accurately predict future disease severity would: facilitate the enrollment of fast-progressing individuals likely to show change during the duration of a trial, empower trials to identify effective therapies, enable prognostic discussions with patients, and facilitate understanding of disease progression.
To address this need, this work develops accurate neuroimaging biomarkers of longitudinal disease severity using machine learning and resting-state functional magnetic resonance imaging (rs-fMRI). Previous studies have identified associations between rs-fMRI measures and disease severity. Regional homogeneity (ReHo) quantifies the synchrony of local brain regions and is affected by neurodegenerative disease [3]. ReHo in the cerebellum has been positively correlated with severity, measured by the Movement Disorder Society Unified Parkinson’s Disease Rating Scale (MDS-UPDRS) score, while ReHo in the putamen is negatively correlated with MDS-UPDRS score, consistent with increasing basal ganglia abnormality and cerebellar compensation with disease progression [4,5]. Amplitude of low frequency fluctuation (ALFF) and its normalized form, fractional ALFF (fALFF), measure the power of the low frequency resting-state signals, which includes most spontaneous neuronal activity [6]. ALFF in the left inferior parietal lobe, bilateral precuneus, and the right inferior frontal gyrus pars opercularis and fALFF in the right cerebellum have been positively correlated with MDS-UPDRS score [7–9]. Conversely, ALFF in the right prefrontal cortex, right middle occipital gyrus, and bilateral lingual gyri have all been negatively correlated with MDS-UPDRS score [7]. These findings have been attributed to the role of the cortico-basal ganglia-thalamo-cortical and cerebello-thalamo-cortical loops in motor function.
Building upon these findings, the contributions of this work are as follows: First, this work develops predictors of future disease severity, which reveal findings more pathophysiologically relevant than biomarkers correlated solely with baseline severity. Second, this work adopts a multivariate, machine learning approach. With higher statistical capacity, machine learning models are better equipped to find latent associations between neuroimaging features and severity than the univariate approaches predominant in the literature [4,5,8,9]. One study has combined ALFF and machine learning using a relevance vector machine to predict current MDS-UPDRS Part III motor severity score[7]. In comparison, this work also investigates ReHo, evaluates a wider range of machine learning models, validates performance on a separate dataset, and predicts both current and future MDS-UPDRS total score, which measures global severity. Finally, the specific brain regions most important for prediction are discussed, which comprise a composite neuroimaging biomarker of PD trajectory.
2. Methods
2.1. Dataset
Data used in the preparation of this article were obtained from the Parkinson’s Progression Markers Initiative (PPMI) database (www.ppmi-info.org/data). The outcome of interest is the MDS-UPDRS total score, encompassing both motor and non-motor symptomatology. From PPMI, 82 PD subjects with rs-fMRI and outcome scores at the same visit were utilized. This initial imaging visit was considered the baseline visit. Of these 82 subjects, 53 subjects also had scores available at year 1 after imaging, 45 at year 2, and 33 at year 4. MDS-UPDRS scores included the Part III Motor Examination conducted on-medication. Off-medication scores were not used due to unavailability for over half of the subjects and because examinations are more practically conducted on-medication in the clinic. As a secondary outcome measure, an MDS-UPDRS score threshold was used to dichotomize subjects into high- and low-severity groups. A threshold of 35 was selected, which was the average of the median MDS-UPDRS score at each of the four timepoints. There were no differences between the high- and low-severity groups in motor predominance (Part III score as a percentage of total score) at p = 0.05.
The fMRI data were acquired at resting-state on 3T scanners at 8 study sites. Subjects were unmedicated at time of imaging and full image acquisition details can be found in Supplemental Table S1. The fMRI images were skull-stripped, coregistered, and corrected for motion and physiological artifacts, and ReHo and fALFF were computed (Supplemental Methods, Section 1).
In addition to fMRI, clinical and demographic features were included as covariates during model training(Table 1). All models were trained with weight regularization to mitigate overfitting on this large set of variables and with rigorous cross-validation to ensure the reliability of the results. Clinical features were selected that have been previously associated with current severity [10]. These included disease duration, symptom duration, dominant symptom side, Geriatric Depression Scale (GDS), Montreal Cognitive Assessment (MoCA), and presence of tremor, rigidity, or postural instability at baseline. Baseline MDS-UPDRS score was also included as a confounding variable when training models to predict future outcomes. Demographic features included age, sex, ethnicity, race, handedness, and years of education.
Table 1:
Demographics and baseline disease characteristics of PPMI subjects used for model training.
| Variable | Baseline | Year 1 | Year 2 | Year 4 |
|---|---|---|---|---|
| Number of subjects | 82 | 53 | 45 | 33 |
| % Caucasian | 95.1% | 94.4% | 97.8% | 97.0% |
| % African-American | 2.4% | 1.9% | 0% | 0% |
| % Asian | 3.7% | 5.6% | 4.4% | 3.0% |
| % Hispanic | 1.2% | 0% | 0% | 0% |
| % Male | 67.0% | 68.5% | 82.2% | 75.8% |
| % right-handed | 89.0% | 85.2% | 88.9% | 87.9% |
| Mean age, years | 62.1 ± 9.8 | 61.9 ± 10.3 | 63.6 ± 9.2 | 59.5 ± 11.0 |
| Mean years of education | 15.6 ± 3.0 | 15.1 ± 3.2 | 15.1 ± 3.3 | 15.0 ± 3.4 |
| Mean disease duration at baseline, days | 770 ± 565 | 808 ± 576 | 771 ± 506 | 532 ± 346 |
| Mean MDS-UPDRS at baseline | 33.9 ± 15.8 | 38.0 ± 20.9 | 40.2 ± 18.2 | 34.9 ± 15.7 |
| Mean MDS-UPDRS at timepoint | n/a | 39.2 ± 21.6 | 40.9 ± 18.5 | 35.9 ± 16.5 |
| Mean MoCA at baseline | 26.7 ± 2.8 | 26.9 ± 3.2 | 26.7 ± 3.5 | 27.5 ± 2.3 |
| Mean GDS at baseline | 5.4 ± 1.4 | 5.4 ± 1.6 | 5.4 ± 1.2 | 5.4 ± 1.7 |
| Mean Hoehn-Yahr stage | 1.8 ± 0.5 | 1.8 ± 0.5 | 1.8 ± 0.5 | 1.7 ± 0.5 |
2.2. Model Training and Evaluation
To test the ability of ReHo and fALFF features to predict current and future disease severity, four prediction targets were examined: MDS-UPDRS total score at baseline, year 1, year 2, and year 4. Separate machine learning models were trained and optimized to predict each target from either ReHo or fALFF features, with clinical and demographic features added as covariates. Four machine learning models of varying statistical complexity, implemented in the scikit-learn Python package, were tested for each target x feature combination: ElasticNet regression, Support Vector Machine (SVM) with a linear kernel, Random Forest with a decision tree kernel, and Gradient Boosting with a decision tree kernel. An unbiased random search was conducted to optimize the hyperparameters of each model, including regularization strength and learning rate. To determine the best-performing parcellation, hyperparameter, and model combination for each target, a rigorous nested cross-validation approach was applied, with leave-one-out cross-validation (LOOCV) as the outer loop and 10-fold cross-validation as the inner loop (Supplemental Methods, Section 3). Though less frequently employed in published analyses, nested cross-validation provides one of the most unbiased estimates of model performance [21]. Performance metrics for regressing the MDS-UPDRS score, the primary outcome of interest, included the coefficient of determination (R2) representing the percentage of variance explained by the model and root mean squared error (RMSE). Each model’s predictions were also thresholded post-hoc to evaluate the model’s ability to classify high- versus low-future severity subjects. Performance metrics for this secondary classification outcome included area under the receiver operating characteristic curve (AUC), positive predictive value (PPV), negative predictive value (NPV), specificity, and sensitivity.
In addition to LOOCV, the year 1 MDS-UPDRS predictive models were evaluated on an external dataset of 29 subjects from the Parkinson’s Disease Biomarkers Program (PDBP), which was not seen during model training and hyperparameter optimization. Besides PPMI, PDBP is the largest publicly available database of PD fMRI data [11]. All available subjects with fMRI and the requisite clinical data were included (n = 29), who were scanned after an overnight withdrawal of anti-Parkinsonian medications. MDS-UPDRS was measured at 1 year after imaging. In the absence of available resting-state fMRI, hand-grip task fMRI was used, as resting-state and task fMRI are known to share over 80% of the same signal variance [12,13]. Image acquisition details can be found in Supplemental Table S1 and demographics are presented in Supplemental Table S2. Further details on this external validation are included in the Supplemental Methods, Section 2. Because PDBP contains subjects with higher disease severity than PPMI, performance in predicting the binary high- vs. low- severity outcome was evaluated with both the original MDS-UPDRS threshold of 35 and a study-specific threshold computed as the median of the year 1 MDS-UPDRS score in this cohort, which is 62..
3. Results
3.1. Predictive Performance
Predictive performance results for each of the four MDS-UPDRS targets are summarized in Table 2. ReHo features explained 30.4%, 45.3%, 47.1%, and 25.5% of the variance in baseline, year 1, year 2, and year 4 MDS-UPDRS score, respectively. fALFF features explained 24.2%, 55.8%, 46.3%, and 15.2% of the variance in baseline, year 1, year 2, and year 4 MDS-UPDRS score, respectively. Results were significant at p = 0.001 (false discovery rate-corrected) at all timepoints except year 4, which was significant at p = 0.05. Figure 1 plots the model prediction versus ground truth MDS-UPDRS scores for the two timepoints, years 1 and 2, at which predictive performance was highest. For classifying high- versus low-future severity, ReHo and fALFF features achieved similar accuracy, with positive predictive value (PPV) ranging from 59.4% to 78.6%.
Table 2:
Predictive performance achieved for each MDS-UPDRS timepoint and each imaging feature type, computed through leave-one-out cross-validation. External validation performance on a separate dataset is also reported at the bottom of the table. Metrics for classifying high-severity subjects (AUC, PPV, NPV) were computed by thresholding predicted and ground truth MDS-UPDRS scores at 35 (the average of the median scores at each timepoint), dichotomizing subjects into high- and low-severity groups. For the external validation dataset, classification performance is also reported using this dataset’s own median score of 62 as the threshold. Metrics: R2, coefficient of determination; RMSE: root mean squared error, AUC: area under the receiver operating characteristic curve, PPV: positive predictive value, NPV: negative predictive value, Spec.: specificity, Sens.: sensitivity.
| MDS-UPDRS Prediction target | Feature | Best performing model | Best performing parcellation | R2 (p-value) | RMSE | AUC | PPV | NPV | Spec. | Sens. |
|---|---|---|---|---|---|---|---|---|---|---|
| Leave-one-out Cross-validation (PPMI dataset) | ||||||||||
| Baseline | ReHo | Gradient Boosting | Schaefer | 0.304 (p < 0.0001) | 13.415 | 0.674 | 59.4% | 75.0% | 73.5% | 61.3% |
| fALFF | Gradient Boosting | Schaefer | 0.242 (p < 0.0001) | 14.006 | 0.668 | 60.0% | 74.0% | 75.5% | 58.1% | |
| Year 1 | ReHo | ElasticNet | Schaefer | 0.453 (p < 0.0001) | 15.861 | 0.753 | 70.4% | 80.0% | 71.4% | 79.2% |
| fALFF | ElasticNet | Schaefer | 0.558 (p < 0.0001) | 14.256 | 0.753 | 70.4% | 80.0% | 71.4% | 79.2% | |
| Year 2 | ReHo | ElasticNet | Schaefer | 0.471 (p < 0.0001) | 13.322 | 0.739 | 75.9% | 75.0% | 63.2% | 84.6% |
| fALFF | ElasticNet | Schaefer | 0.463 (p < 0.0001) | 13.426 | 0.765 | 78.6% | 76.5% | 68.4% | 84.6% | |
| Year 4 | ReHo | SVM | BASC197 | 0.255 (p = 0.003) | 14.015 | 0.699 | 73.3% | 66.7% | 75.0% | 64.7% |
| fALFF | SVM | BASC197 | 0.152 (p = 0.025) | 14.957 | 0.636 | 64.7% | 62.5% | 62.5% | 64.7% | |
| External validation (PDBP dataset) | ||||||||||
| Year 1 (classification threshold = 35) | ReHo | ElasticNet | Schaefer | 0.689 (p < 0.0001) | 21.288 | 0.476 | 53.8% | 33.3% | 7.7% | 87.5% |
| fALFF | ElasticNet | Schaefer | 0.496 (p < 0.0001) | 27.113 | 0.690 | 73.3% | 64.3% | 69.2% | 68.8% | |
| Year 1 (classification threshold = 62) | ReHo | ElasticNet | Schaefer | 0.689 (p < 0.0001) | 21.288 | 0.698 | 61.9% | 87.5% | 46.7% | 92.9% |
| fALFF | ElasticNet | Schaefer | 0.496 (p < 0.0001) | 27.113 | 0.857 | 100.0% | 78.9% | 100.0% | 71.4% | |
Figure 1:
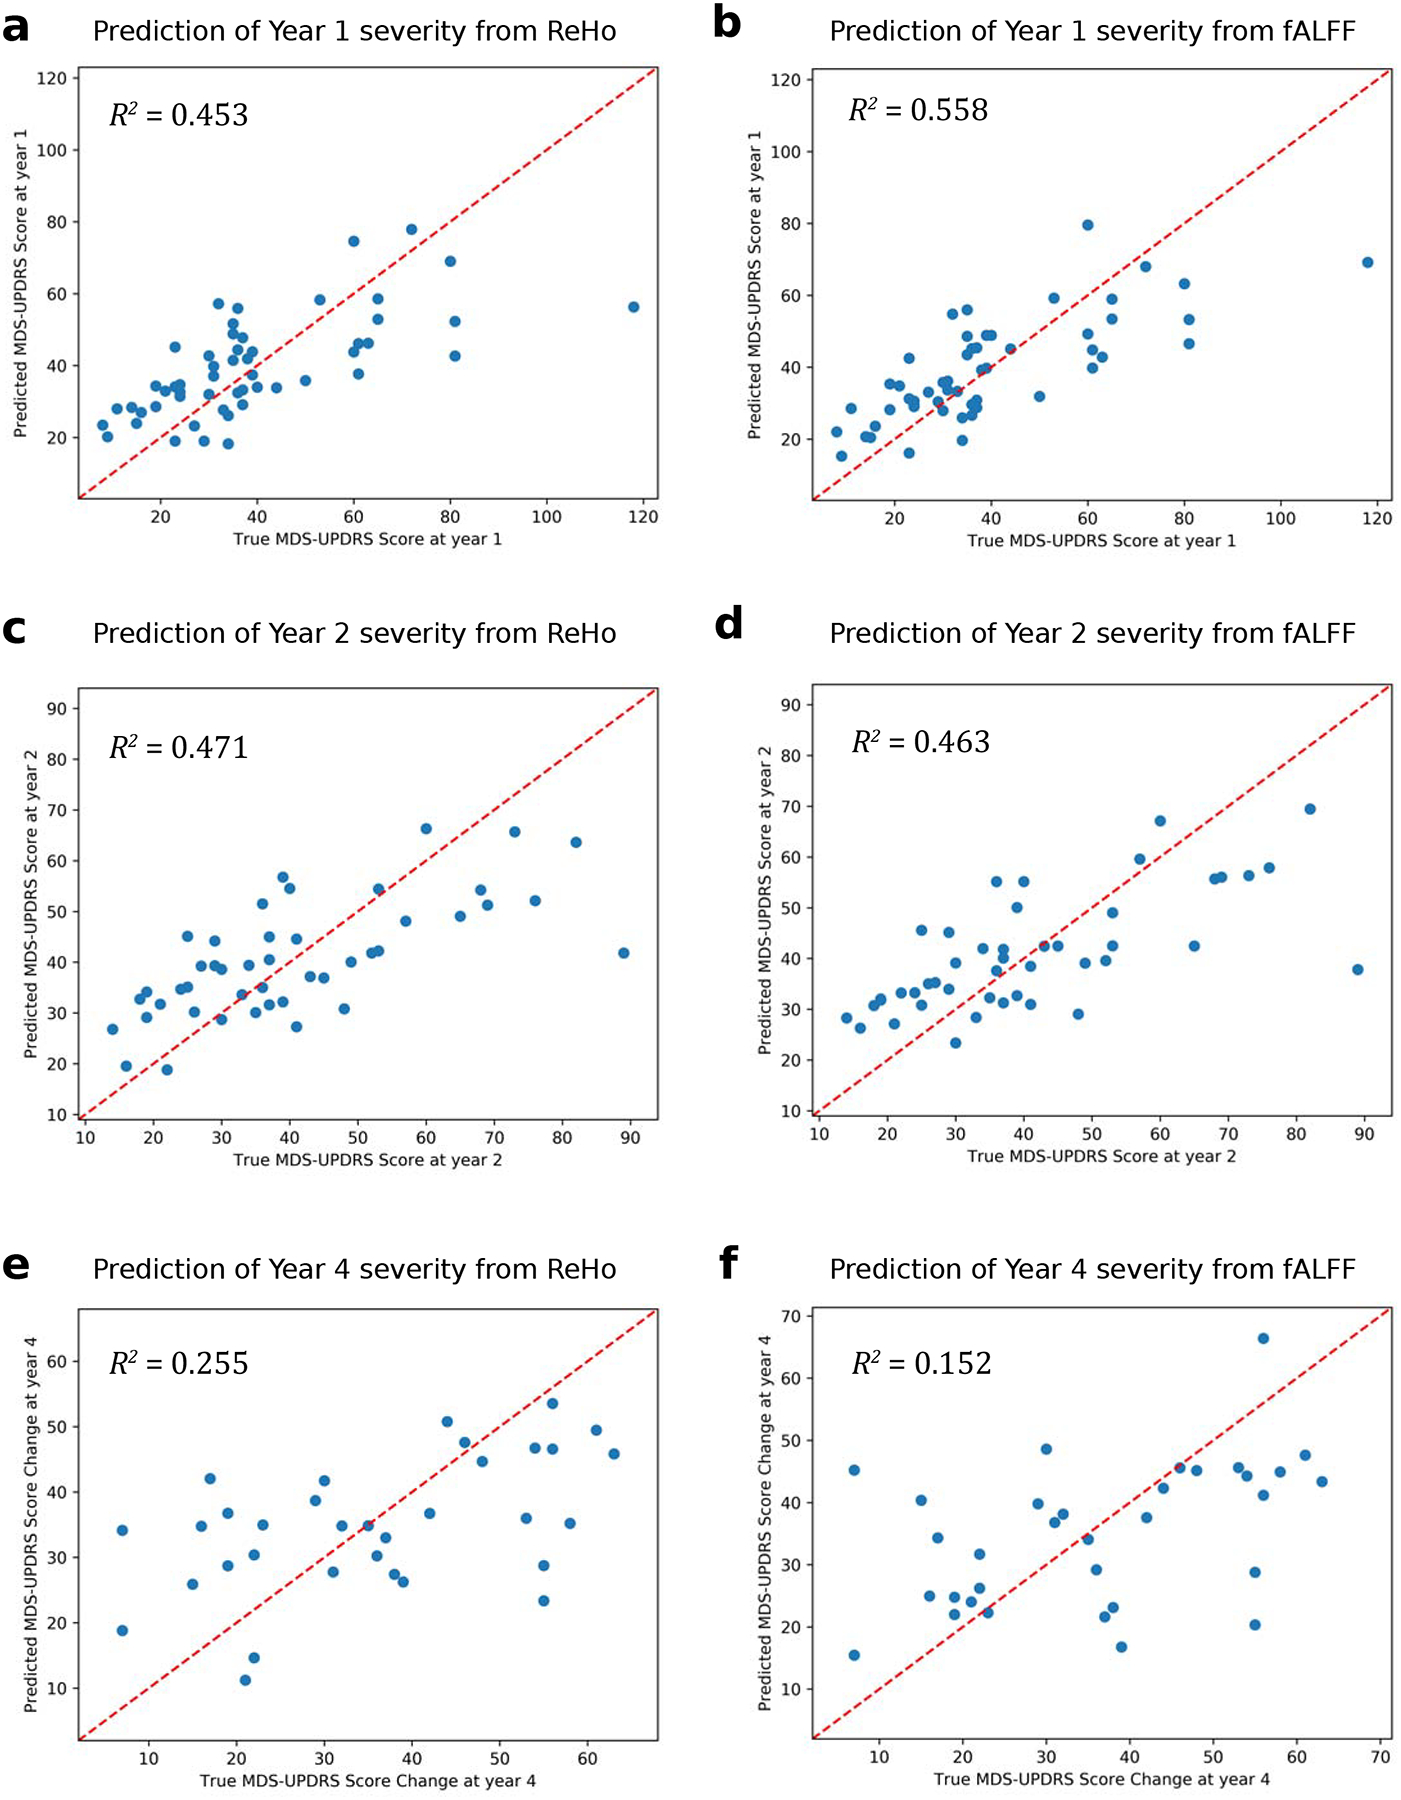
Predicted versus ground truth scores for predicting year 1 MDS-UPDRS total score from baseline (a) ReHo and (b) fALFF, for predicting year 2 MDS-UPDRS total score from baseline (c) ReHo and (d) fALFF, and for predicting year 4 MDS-UPDRS total score from baseline (e) ReHo and (f) fALFF.
The year 1 models trained on the PPMI data demonstrated comparable performance on the external PDBP dataset, with the ReHo model explaining 68.9% of the variance and the fALFF model explaining 49.6% of the variance in MDS-UPDRS score (p < 0.001). The ReHo model exceeded the 45.3% seen on the original dataset and the fALFF model was comparable to the 55.8% on the original dataset, which strongly supports the reliability of the biomarkers learned by these models. Further validation using a leave-one-site-out approach (Supplemental Methods, Section 4) on PPMI also showed comparable performance (Supplemental Table S3), explaining up to 56.3% of the variance at year 1 and a similar trend of decreasing prediction performance at distal timepoints.
3.2. Predictive Neuroimaging and Clinical Features
The most important predictive features learned by each model were identified as described in the Supplemental Methods, Section 5. Higher ReHo in the frontal cortex, including the left orbitofrontal cortex and right inferior frontal gyrus pars triangularis, predicted lower scores at baseline, year 1, and year 4 (Figure 2a–d). Higher ReHo in the middle frontal gyrus predicted higher year 4 score. Temporal lobe ReHo was also predictive, with higher right inferior temporal gyrus and left amygdala ReHo predicting lower scores across timepoints. Higher ReHo in the right posterior cingulate gyrus predicted lower MDS-UPDRS score at baseline and year 2, while higher ReHo in the right middle cingulate gyrus predicted lower baseline score. Higher ReHo in the bilateral precuneus also predicted lower score at baseline. Of the deep brain structures, higher ReHo in the right putamen and left thalamus predicted lower score at years 2 and 4. At baseline, greater disease duration (time since diagnosis) and symptom duration predicted higher score. Higher baseline MDS-UPDRS score predicted higher scores at year 1 and year 2 but was not predictive of year 4 score.
Figure 2:
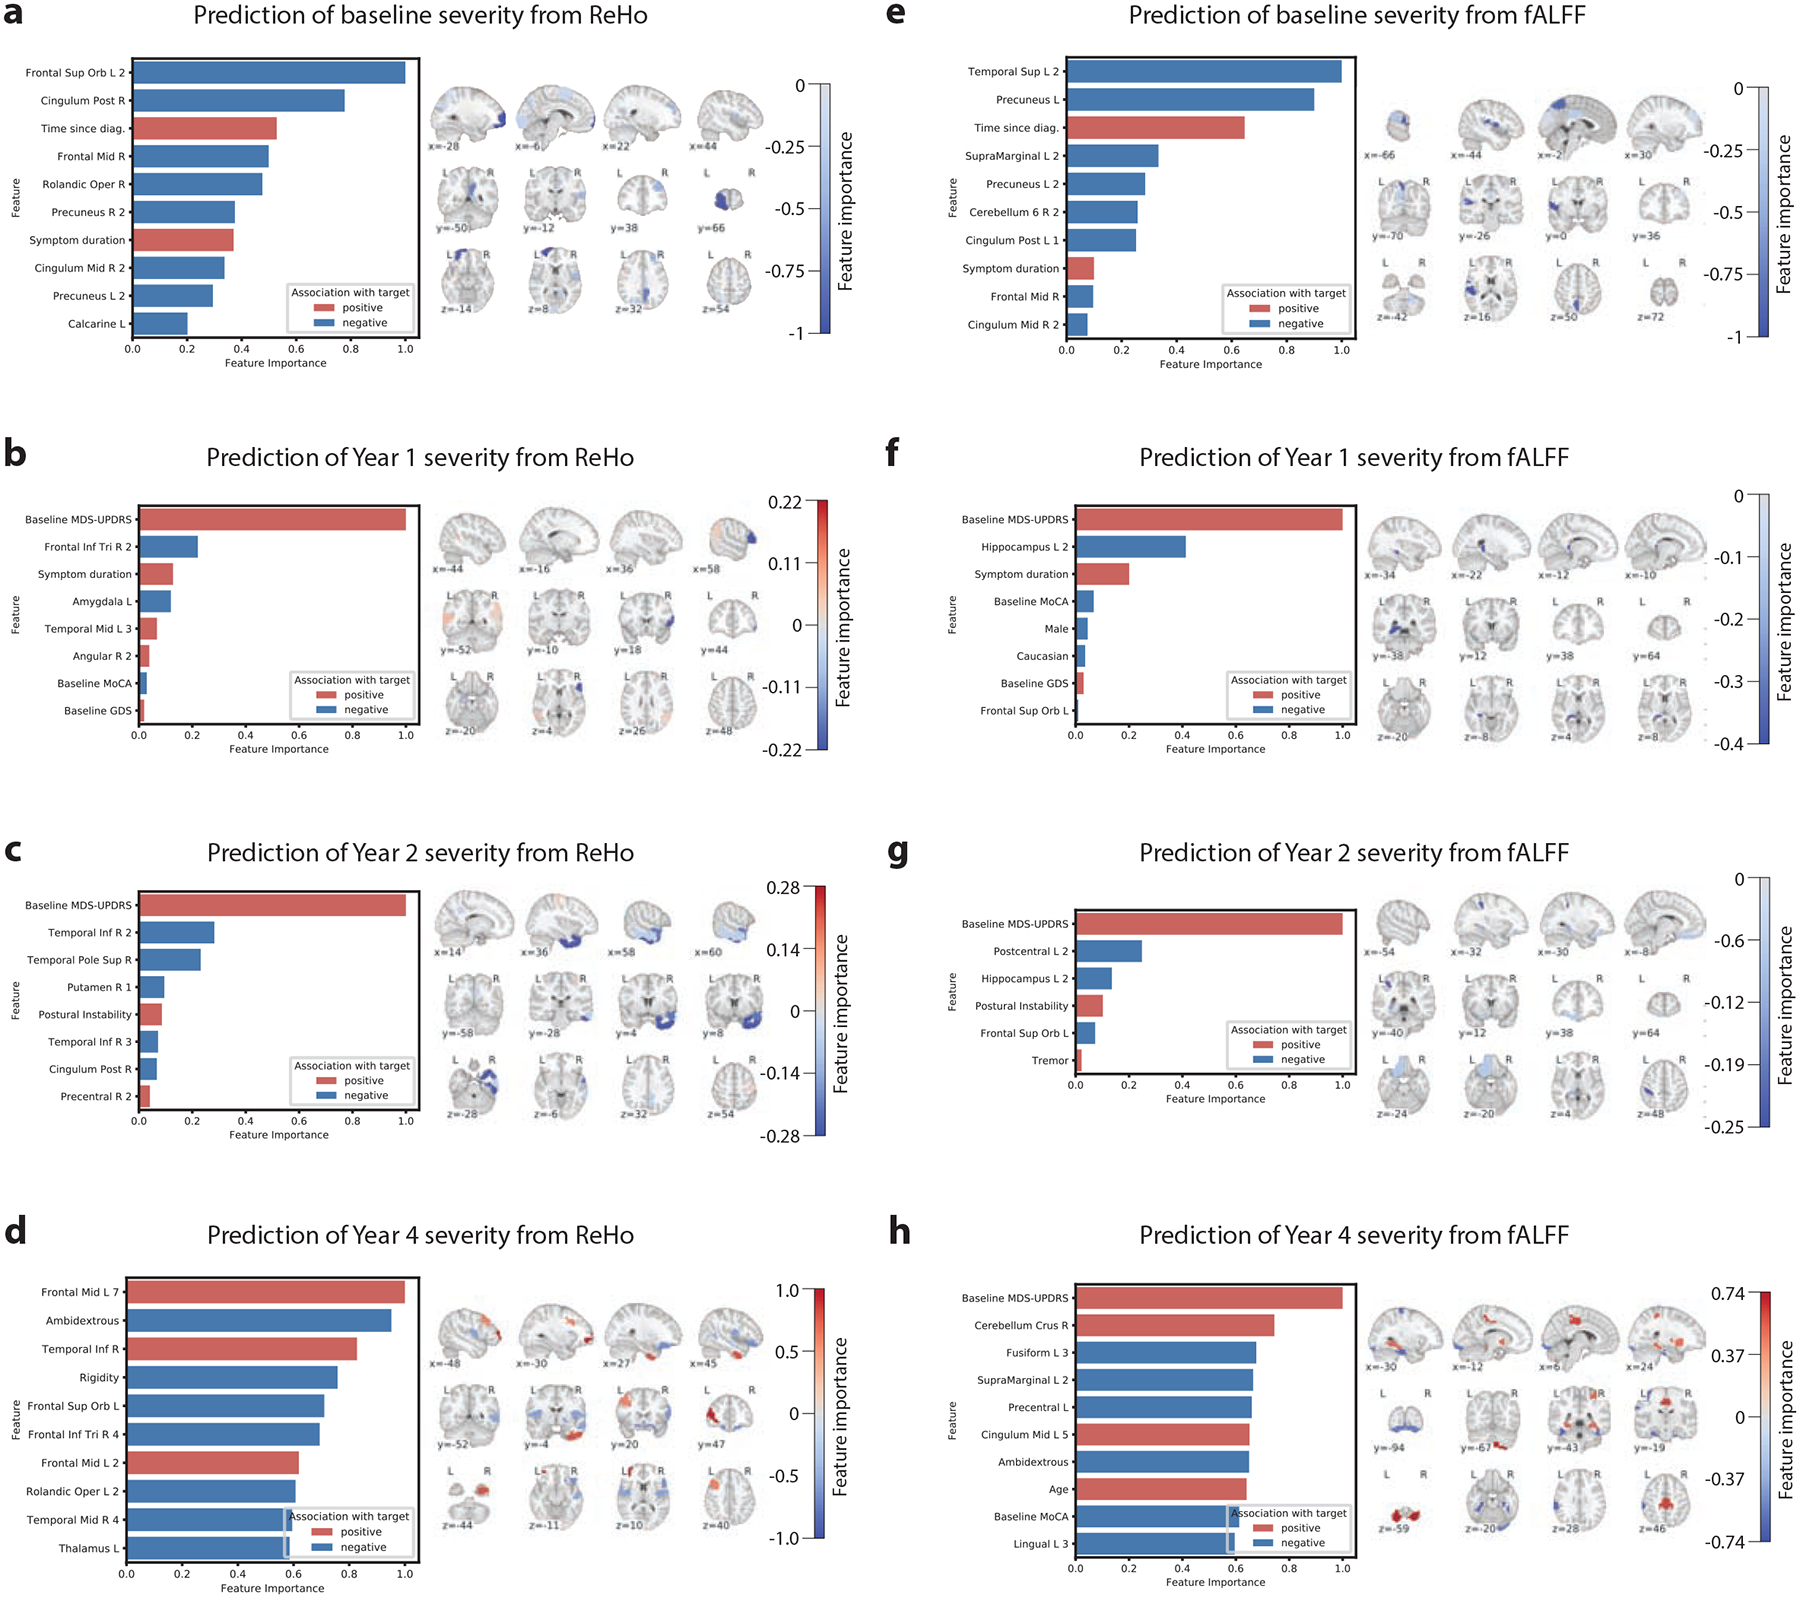
Important features learned by each model to predict MDS-UPDRS score. The median feature importance among the LOOCV iterations is shown. Left: the most important features are illustrated, sorted by absolute importance. For brevity, features with zero or comparatively low importance are not shown. Red bars indicate a positive association between the feature and MDS-UPDRS score, and blue bars indicate a negative association. Importance values are normalized to the range of 0–1. Right: the imaging features are visualized in brain space, overlaid on a standard MNI template, with red and blue again reflecting positive and negative associations between the feature and disease severity. The intensity of the color indicates the strength of association.
Higher fALFF in temporal lobe regions predicted lower scores at different timepoints, including the left superior temporal gyrus at baseline and the fusiform gyrus at year 4 (Figure 2e–h). Higher fALFF in the hippocampus was predictive of lower score at year 1 and year 2. In the parietal lobe, higher fALFF in the left precuneus, left supramarginal gyrus, and postcentral gyrus predicted lower scores across multiple timepoints. In the frontal cortex, higher fALFF in the left orbitofrontal cortex predicted lower score at year 2 while higher fALFF in the left lingual gyrus predicted lower year 4 score. Finally, higher fALFF in the right cerebellum and the bilateral cingulate gyrus predicted lower baseline score and higher year 4 score. As with the ReHo models, greater disease duration and symptom duration predicted higher baseline score and higher baseline MDS-UPDRS predicted higher year 1 and year 2 scores, but not year 4 score.
4. Discussion
4.1. Performance of Predictive Models
The machine learning models performed better than previously proposed models. To date, Hou et al. were the first to use machine learning to predict current PD severity from rs-fMRI[7]. They achieved R2 = 0.123 for predicting UPDRS Part III motor score using ALFF and a relevance vector machine. In comparison, the models in this work achieved R2 = 0.304, p < 0.0001 using ReHo and R2 = 0.242, p < 0.0001 using fALFF for predicting MDS-UPDRS total score, which more comprehensively measures PD severity. Future severity has not been previously addressed in analyses of these fMRI measures, and the proposed models also explained a substantial percentage of the variance in MDS-UPDRS scores at years 1 and 2 where R2 ranged from 0.453 to 0.558, p < 0.0001. The addition of baseline as a feature at these timepoints contributed to the high predictive accuracy, though this feature became less important at further timepoints. Performance was lower though still substantial for year 4 (R2 = 0.255, p = 0.003 for ReHo features and R2 = 0.152, p = 0.025 for fALFF features), due to either the difficulty of predicting long-term trajectories or the limited number of subjects at this timepoint (n = 33). Examination of predicted versus true MDS-UPDRS scores (Figure 1) showed similar accuracy throughout the range of low to moderate severity subjects. The greatest errors occurred for outlier subjects with very high severity.
Importantly, the performance of the year 1 models was reproduced in a separate dataset, not used to train the model. The PDBP data exhibited greater baseline MDS-UPDRS, a wider distribution of MDS-UPDRS, worse cognitive scores (MOCA), older age (+5 years older) and different acquisition parameters including resolution and fMRI duration (47% less) (Supplement Table S2, Figure S1). This external validation demonstrates the models’ ability to generalize to new populations and acquisition protocols. Also, the similar performance despite the use of task fMRI corroborates prior work which demonstrated a large overlap between task fMRI signals and resting state networks [12,13]. In the specific hand-grip task used in PDBP, most of the task paradigm consisted of resting periods between task blocks, leaving ample opportunity to generate resting state signal. Additionally, the high performance found when evaluating the models on task fMRI suggests that the learned biomarker is still predictive despite the perturbation in cognitive state.
Dichotomizing the subjects into high- and low-future severity using the median MDS-UPDRS score, the year 1 and year 2 models achieved high NPVs of 75.0% to 80.0% in identifying high future severity subjects. PPVs were comparatively lower, ranging from 70.4% to 78.6%. The baseline models were relatively less capable of this classification task, and PPV and NPV were lower for the year 4 models, indicative of the difficulty of predicting distant disease trajectory.
In additional experiments not elaborated here, models were trained on combined ReHo and fALFF features. There was no significant increase in performance, suggesting that some of the features from the two measurements are collinear and measure similar underlying signals. Further analysis is warranted to identify the most synergistic features from ReHo and fALFF and to create a unified model incorporating both feature types. In the meantime, the best performing model from each timepoint could readily be used in practice to achieve the most accurate predictions.
4.2. Learned Predictive Features
Baseline ReHo in many regions of the default mode network (DMN) were predictive of lower current and future severity, including the left orbitofrontal cortex, bilateral prefrontal cortex, right cingulate gyrus, and bilateral precuneus. Disruptions in this network have been identified in PD [14,15]. These findings suggest that higher neural homogeneity in the DMN predicts milder disease across time. Another recurring important region was the right temporal lobe, including the pole and middle and inferior gyri, where ReHo predicted year 2 and 4 severity. Gray matter atrophy in the temporal pole, which exhibits functional connections to the striatum and orbitofrontal cortex, has been identified in PD [16], correlated with disease duration [17], and connected to cognitive impairment [18]. Importantly, the anterior temporal areas are the initial cortical site in Braak’s model of PD progression[19]. ReHo in the right inferior frontal gyrus pars triangularis was a highly important predictor of lower severity at years 1 and 4. This region contains Broca’s area, which is associated with fine hand movement [20], and hand tremors are a hallmark of PD. While not extensively implicated in PD, one study correlated cortical atrophy in Broca’s area with disease duration[17]. Higher neural homogeneity in the pars triangularis could be an important indicator of lower future severity, particularly in hand tremor symptoms.
At baseline, fALFF in several regions of the DMN was predictive of lower severity, including the left precuneus and right posterior and middle cingulate gyri. The left orbitofrontal cortex, another component of the DMN, predicted severity at years 1 and 2. Combined with similar findings from ReHo, this strongly implicates higher DMN activity as a biomarker of lower future severity. Higher fALFF in the left superior temporal and supramarginal gyri predicted lower baseline severity, specifically in ROIs close to the insula. Pathological involvement of the insula, a component of the limbic system, has been implicated in cognitive decline in PD [21,22]. Higher fALFF in the left hippocampus, another limbic region, predicted lower short-term severity at years 1 and 2. Indeed, limbic system involvement is characteristic of progressive disease in Braak’s model [23]. Finally, fALFF in motor regions such as the right cerebellum and left postcentral gyrus were predictors of both baseline severity and longer-term (years 2 and 4) severity.
Interestingly, the predictive ReHo features did not substantially overlap with regions with significant differences between PD and healthy subjects in the PPMI resting-state dataset(Figure S2 in the Supplement). Additionally, no regions were found to have significant differences in fALFF between PD and healthy subjects. This suggests that the biomarkers are not causally related to disease but reflect an intrinsic brain phenotype that moderates disease trajectory. These results showing that a biomarker need not be abnormal in PD to be predictive of severity corroborate previously reported findings. Hu et al. reported a similar finding, where right cerebellar fALFF did not significantly differ between PD and heathy subjects but was correlated with UPDRS Part III score in PD [9]. Wang et al. identified ALFF in the inferior frontal gyrus as a correlate of UPDRS score, though this measurement was only significantly abnormal in PD subjects with mild cognitive impairment [8]. Consequently, a biomarker need not be abnormal in PD to be predictive of severity.
4.3. Limitations
A limitation of the PPMI and PDBP cohorts is their bias towards Caucasians (95.1% and 95.0%, respectively). Future studies with better representation of other races and ethnicities are needed to develop predictive models that reflect the diversity of the patient population.
Additionally, these results demonstrate the prediction of absolute MDS-UPDRS future score, rather than the change over time, i.e. progression. In additional experiments, both fALFF (R2 = 0.255) and ReHo (R2 = 0.182) were predictive of change in MDS-UPDRS score from baseline to year 4. Given the relatively few subjects available at year 4 (n = 33), further investigation with larger sample sizes is warranted. MDS-UPDRS measurements across time may be confounded by medication, though that is partially mitigated in this work by considering the total score rather than the Part III motor score only.
Finally, because only 1 year of follow-up was available from the PDBP dataset, only the year 1 models were able to be externally validated. External validation of the other models should be conducted when such data is available, though the nested LOOCV approach used here should closely estimate generalization performance in the meantime.
5. Conclusion
Using a multivariate machine learning approach, predictors of future disease severity were developed that explained much of the variance in MDS-UPDRS total score, encompassing both motor and non-motor symptoms, in PD subjects over multiple timepoints. Measurements from a single timepoint predicted severity at current time and 1, 2, 4 years in the future. ReHo and fALFF were demonstrated to have prognostic value and important imaging and clinical features were identified, including common findings across the longitudinal timepoints, which together form a composite biomarker. The proposed set of models can be readily applied to an individual’s fMRI to yield, within seconds, predictions of disease severity across several future timepoints, which helps address the need for quantitative prognostic tools. This work provides strong evidence of the value of rs-fMRI in prognosticating PD, and continued efforts to develop imaging-based tools will not only expedite treatment development, but also improve understanding of PD neurophysiology and patient care.
Supplementary Material
Highlights.
Biomarkers of Parkinson’s Disease severity and future trajectory are needed
Regional brain activity and homogeneity were measured from resting functional MRI
Machine learning models were trained to predict disease severity from this data
Both current and future severity were predicted reproducibly across datasets
Several brain regions, such as the default mode network, were important predictors
Acknowledgements
PPMI--a public-private partnership--is funded by the Michael J. Fox Foundation for Parkinson’s Research and funding partners, including Abbvie, Allergan, Avid Radiopharmaceuticals, Biogen, Biolegend, Bristol-Myers Squibb, Celgene, Denali, GE Healthcare, Genentech, GlaxoSmithKline, Lilly, Lundbeck, Merck, Meso Scale Discovery, Pfizer, Piramal, Prevail Therapeutics, Roche, Sanofi Genzyme, Servier, Takeda, Teva, UCB, Verily, and Voyager Therapeutics.
Additional data and biospecimens used in preparation of this manuscript were obtained from the Parkinson’s Disease Biomarkers Program (PDBP) Consortium, supported by the National Institute of Neurological Disorders and Stroke at the National Institutes of Health. Investigators include: Roger Albin, Roy Alcalay, Alberto Ascherio, Thomas Beach, Sarah Berman, Bradley Boeve, F. DuBois Bowman, Shu Chen, Alice Chen-Plotkin, William Dauer, Ted Dawson, Paula Desplats, Richard Dewey, Ray Dorsey, Jori Fleisher, Kirk Frey, Douglas Galasko, James Galvin, Dwight German, Lawrence Honig, Xuemei Huang, David Irwin, Kejal Kantarci, Anumantha Kanthasamy, Daniel Kaufer, James Leverenz, Carol Lippa, Irene Litvan, Oscar Lopez, Jian Ma, Lara Mangravite, Karen Marder, Laurie Orzelius, Vladislav Petyuk, Judith Potashkin, Liana Rosenthal, Rachel Saunders-Pullman, Clemens Scherzer, Michael Schwarzschild, Tanya Simuni, Andrew Singleton, David Standaert, Debby Tsuang, David Vaillancourt, David Walt, Andrew West, Cyrus Zabetian, Jing Zhang, and Wenquan Zou. The PDBP Investigators have not participated in reviewing the data analysis or content of the manuscript.
Special thanks to Padraig O’Suilleabhain and Umar Yazdani for providing additional feedback during the writing of this manuscript.
Funding and Financial Disclosures
Dr. Montillo was supported by NIH NIA R01AG059288, NIH NCI U01 CA207091, the King Foundation, the Lyda Hill Foundation, and the UT Southwestern Lyda Hill Department of Bioinformatics. Dr. Dewey reports personal fees (consulting) from Amneal, Acorda, Supernus, Teva, Adamas, US WorldMeds, Acadia, and Lundbeck, unrelated to the submitted work. Unrelated to this work, Dr. Pinho is a consultant for ABC Medical Education and Dr. Dewey is a consultant for Supernus, Acorda and Amneal Pharmaceuticals.
Footnotes
Publisher's Disclaimer: This is a PDF file of an unedited manuscript that has been accepted for publication. As a service to our customers we are providing this early version of the manuscript. The manuscript will undergo copyediting, typesetting, and review of the resulting proof before it is published in its final form. Please note that during the production process errors may be discovered which could affect the content, and all legal disclaimers that apply to the journal pertain.
Code Availability
To facilitate reuse and extension, we are pleased to provide full source code for these analyses at https://github.com/DeepLearningForPrecisionHealthLab/Parkinson-Severity-rsfMRI.
6 References
- [1].Meissner WG, Frasier M, Gasser T, Goetz CG, Lozano A, Piccini P, Obeso JA, Rascol O, Schapira A, Voon V, Weiner DM, Tison F, Bezard E, Priorities in Parkinson’s disease research, Nat. Rev. Drug Discov 10 (2011) 377–393. 10.1038/nrd3430. [DOI] [PubMed] [Google Scholar]
- [2].Gwinn K, David KK, Swanson-Fischer C, Albin R, Hillaire-Clarke CS, Sieber B-A, Lungu C, Bowman FD, Alcalay RN, Babcock D, Dawson TM, Dewey RB, Foroud T, German D, Huang X, Petyuk V, Potashkin JA, Saunders-Pullman R, Sutherland M, Walt DR, West AB, Zhang J, Chen-Plotkin A, Scherzer CR, Vaillancourt DE, Rosenthal LS, Parkinson’s disease biomarkers: perspective from the NINDS Parkinson’s Disease Biomarkers Program, Biomark. Med 11 (2017) 451–473. 10.2217/bmm-2016-0370. [DOI] [PMC free article] [PubMed] [Google Scholar]
- [3].Zang Y, Jiang T, Lu Y, He Y, Tian L, Regional homogeneity approach to fMRI data analysis, Neuroimage 22 (2004) 394–400. 10.1016/j.neuroimage.2003.12.030. [DOI] [PubMed] [Google Scholar]
- [4].Wu T, Long X, Zang Y, Wang L, Hallett M, Li K, Chan P, Regional homogeneity changes in patients with parkinson’s disease, Hum. Brain Mapp 30 (2009) 1502–1510. 10.1002/hbm.20622. [DOI] [PMC free article] [PubMed] [Google Scholar]
- [5].Sheng K, Fang W, Zhu Y, Shuai G, Zou D, Su M, Han Y, Cheng O, Different alterations of cerebral regional homogeneity in early-onset and late-onset Parkinson’s disease, Front. Aging Neurosci 8 (2016) 165. 10.3389/fnagi.2016.00165. [DOI] [PMC free article] [PubMed] [Google Scholar]
- [6].Zou Q-H, Zhu C-Z, Yang Y, Zuo X-N, Long X-Y, Cao Q-J, Wang Y-F, Zang Y-F, An improved approach to detection of amplitude of low-frequency fluctuation (ALFF) for resting-state fMRI: fractional ALFF, J. Neurosci. Methods 172 (2008) 137–141. 10.1016/j.jneumeth.2008.04.012. [DOI] [PMC free article] [PubMed] [Google Scholar]
- [7].Hou Y, Luo C, Yang J, Ou R, Song W, Wei Q, Cao B, Zhao B, Wu Y, Shang H-F, Gong Q, Prediction of individual clinical scores in patients with Parkinson’s disease using resting-state functional magnetic resonance imaging, J. Neurol. Sci 366 (2016) 27–32. 10.1016/j.jns.2016.04.030. [DOI] [PubMed] [Google Scholar]
- [8].Wang Z, Jia X, Chen H, Feng T, Wang H, Abnormal Spontaneous Brain Activity in Early Parkinson’s Disease With Mild Cognitive Impairment: A Resting-State fMRI Study, Front. Physiol 9 (2018) 1093. 10.3389/fphys.2018.01093. [DOI] [PMC free article] [PubMed] [Google Scholar]
- [9].Hu X-F, Zhang J-Q, Jiang X-M, Zhou C-Y, Wei L-Q, Yin X-T, Li J, Zhang Y-L, Wang J, Amplitude of low-frequency oscillations in Parkinson’s disease: A 2-year longitudinal resting-state functional magnetic resonance imaging study, Chin. Med. J 128 (2015) 593–601. 10.4103/0366-6999.151652. [DOI] [PMC free article] [PubMed] [Google Scholar]
- [10].Huber SJ, Paulson GW, Shuttleworth EC, Relationship of motor symptoms, intellectual impairment, and depression in Parkinson’s disease, J Neurol Neurosurg Psychiatry 51 (1988) 855–858. 10.1136/jnnp.51.6.855. [DOI] [PMC free article] [PubMed] [Google Scholar]
- [11].Rosenthal LS, Drake D, Alcalay RN, Babcock D, Bowman FD, Chen-Plotkin A, Dawson TM, Dewey RB, German DC, Huang X, Landin B, McAuliffe M, Petyuk VA, Scherzer CR, Hillaire-Clarke CS, Sieber B-A, Sutherland M, Tarn C, West A, Vaillancourt D, Zhang J, Gwinn K, The NINDS Parkinson’s disease biomarkers program, Mov. Disord 31 (2016) 915–923. 10.1002/mds.26438. [DOI] [PMC free article] [PubMed] [Google Scholar]
- [12].Cole MW, Bassett DS, Power JD, Braver TS, Petersen SE, Intrinsic and task-evoked network architectures of the human brain, Neuron 83 (2014) 238–251. 10.1016/j.neuron.2014.05.014. [DOI] [PMC free article] [PubMed] [Google Scholar]
- [13].Elliott ML, Knodt AR, Cooke M, Kim MJ, Melzer TR, Keenan R, Ireland D, Ramrakha S, Poulton R, Caspi A, Moffitt TE, Hariri AR, General functional connectivity: Shared features of resting-state and task fMRI drive reliable and heritable individual differences in functional brain networks, Neuroimage 189 (2019) 516–532. 10.1016/j.neuroimage.2019.01.068. [DOI] [PMC free article] [PubMed] [Google Scholar]
- [14].van Eimeren T, Monchi O, Ballanger B, Strafella AP, Dysfunction of the default mode network in Parkinson disease: a functional magnetic resonance imaging study, Arch. Neurol 66 (2009) 877–883. 10.1001/archneurol.2009.97. [DOI] [PMC free article] [PubMed] [Google Scholar]
- [15].Tessitore A, Esposito F, Vitale C, Santangelo G, Amboni M, Russo A, Corbo D, Cirillo G, Barone P, Tedeschi G, Default-mode network connectivity in cognitively unimpaired patients with Parkinson disease, Neurology 79 (2012) 2226–2232. 10.1212/WNL.0b013e31827689d6. [DOI] [PubMed] [Google Scholar]
- [16].Potgieser ARE, van der Hoorn A, Meppelink AM, Teune LK, Koerts J, de Jong BM, Anterior temporal atrophy and posterior progression in patients with Parkinson’s disease, Neurodegener. Dis 14 (2014) 125–132. 10.1159/000363245. [DOI] [PubMed] [Google Scholar]
- [17].Jubault T, Gagnon J-F, Karama S, Ptito A, Lafontaine A-L, Evans AC, Monchi O, Patterns of cortical thickness and surface area in early Parkinson’s disease, Neuroimage 55 (2011) 462–467. 10.1016/j.neuroimage.2010.12.043. [DOI] [PubMed] [Google Scholar]
- [18].Zhou C, Guan X-J, Guo T, Zeng Q-L, Gao T, Huang P-Y, Xuan M, Gu Q-Q, Xu X-J, Zhang M-M, Progressive brain atrophy in Parkinson’s disease patients who convert to mild cognitive impairment, CNS Neurosci. Ther 26 (2019) 117–125. 10.1111/cns.13188. [DOI] [PMC free article] [PubMed] [Google Scholar]
- [19].Braak H, Tredici KD, Rüb U, de Vos RAI, Jansen Steur ENH, Braak E, Staging of brain pathology related to sporadic Parkinson’s disease, Neurobiology of Aging 24 (2003) 197–211. 10.1016/S0197-4580(02)00065-9. [DOI] [PubMed] [Google Scholar]
- [20].Binkofski F, Buccino G, Motor functions of the Broca’s region, Brain and Language 89 (2004) 362–369. 10.1016/S0093-934X(03)00358-4. [DOI] [PubMed] [Google Scholar]
- [21].Fathy YY, Jonker AJ, Oudejans E, de Jong FJJ, van Dam A-MW, Rozemuller AJM, van de Berg WDJ, Differential insular cortex subregional vulnerability to α-synuclein pathology in Parkinson’s disease and dementia with Lewy bodies, Neuropathol. Appl. Neurobiol 45 (2019) 262–277. 10.1111/nan.12501. [DOI] [PMC free article] [PubMed] [Google Scholar]
- [22].Aracil-Bolaños I, Sampedro F, Marín-Lahoz J, Horta-Barba A, Martínez-Horta S, Botí M, Pérez-Pérez J, Bejr-Kasem H, Pascual-Sedano B, Campolongo A, Izquierdo C, Gironell A, Gómez-Ansón B, Kulisevsky J, Pagonabarraga J, A divergent breakdown of neurocognitive networks in Parkinson’s Disease mild cognitive impairment, Hum. Brain Mapp 40 (2019) 3233–3242. 10.1002/hbm.24593. [DOI] [PMC free article] [PubMed] [Google Scholar]
- [23].Braak H, Ghebremedhin E, Rüb U, Bratzke H, Del Tredici K, Stages in the development of Parkinson’s disease-related pathology, Cell and Tissue Research 318 (2004) 121–134. 10.1007/s00441-004-0956-9. [DOI] [PubMed] [Google Scholar]
Associated Data
This section collects any data citations, data availability statements, or supplementary materials included in this article.