

Abstract
Osteoporosis is an increasing burden on public health as the world-wide population ages and effective therapeutics are severely needed. Two pathways with high potential for osteoporosis treatment are the retinoic acid (RA) and endocannabinoid system (ECS) signaling pathways. We sought to elucidate the roles that these pathways play in bone development and maturation. Here, we use chemical treatments to modulate the RA and ECS pathways at distinct early, intermediate, and late times bone development in zebrafish. We further assessed osteoclast activity later in zebrafish and medaka. Finally, by combining sub-optimal doses of AR and ECS modulators, we show that enhancing RA signaling or reducing the ECS promote bone formation and decrease osteoclast abundance and activity. These data demonstrate that RA signaling and the ECS can be combined as sub-optimal doses to influence bone growth and may be key targets for potential therapeutics.
Keywords: Retinoic acid, endocannabinoid, osteoblast, osteoclast, zebrafish, medaka
1. Introduction
Osteoporosis is a prevalent metabolic bone disease, characterized by reduced bone mineral density (BMD), fragility, and an increased susceptibility to spontaneous or traumatic bone fractures. [1] Healthy bones require a homeostasis of degradation of old bone and deposition of new bone. The disease state of osteoporosis arises when there is an imbalance between this deposition and degradation. [2] These processes are controlled by the activities of osteoblasts, cells responsible for producing new bone mineral matrix, and osteoclasts, cells that secrete proteolytic enzymes such as cysteine proteinases and matrix metalloproteinases to degrade old bone. [3,4] Therefore, modulation of differentiation or controlling populations of osteoblasts and osteoclasts may provide a better understanding of bone homeostasis and a means of treating osteoporosis.
One potential target for influencing the effects of osteoblasts and osteoclasts is retinoic acid (RA). RA is the biologically active metabolite of Vitamin A (retinol). [5] RA acts as a morphogen that conveys a signal by binding to nuclear receptors which promote transcription by targeting retinoic acid response elements within the regulatory regions of target genes. [5,6] RA plays a large role in development, organogenesis, and maintenance of many different tissues throughout the body. [6] Importantly, RA has also been shown to regulate bone growth and homeostasis. [7,8,9] However, the specific effects that RA has on osteoblast and osteoclast differentiation, proliferation, and activity are quite complex and have not been fully elucidated. There have been many investigations of the influences of RA on osteoblasts and osteoclasts, but due to differences in timing of treatment, dosage, cell type, or animal model, the results of these studies can often be conflicting. [10,11,12,13,14] Increasingly, recent reports have provided additional context for the role of RA in the in vivo bone microenvironment. [15,16] One insight made by Li et al. 2010 [17] was that in zebrafish, when RA treatment was given during early development, 48–54 hours post fertilization (hpf), it inhibited osteoblast differentiation and proliferation, while treatment later on, 84–96 hpf increased the amount of mineralized bone that was present. These data hint at potentially opposing influences of RA on osteoblast development or activity depending on the timing of exposure during embryogenesis.
The endocannabinoid system (ECS) is another potential target for treating osteoporosis. The ECS is a family of ligands and G-protein coupled receptors that target intracellular kinases to influence transcription. [18] The two most prominent receptors of the ECS are cannabinoid receptor 1 (CB1) and cannabinoid receptor 2 (CB2). Expression of the receptors and the endogenous cannabinoid ligands have been detected in osteoblasts and osteoclasts in vitro. [19] However, the specific effects that ECS signaling imposes on bone development and osteoblast and osteoclast activity are still unresolved. For example, it was shown that CB1−/− mice have decreased bone formation when compared to WT siblings at nine to twelve weeks old. [20] Conversely, a later study stated that CB1−/− mice showed increased bone formation at three months old, with no changes in osteoblast number. [21] Other reports have presented seemingly conflicting data on the effects of the ECS in bone. [22,23,24] Similarly to what has been observed with RA signaling, the specific timing of ECS activity may determine whether it enhances or inhibits bone development. [25]
To resolve the complications due to timings of treatment involving these two pathways, we activated or inhibited RA and ECS signaling at early, intermediate, and late development of the zebrafish opercle bone. We then analyzed the effects of these pathways on osteoclasts later in zebrafish and medaka development. Upon establishing the influence that modulating the pathways had on osteoblasts and osteoclasts, we then assessed the effects of combined treatments from each pathway on each cell-type. Here, we show that a combination of sub-optimal individual doses of chemical modulators of the RA and ECS pathways is sufficient to influence osteoblast and osteoclast differentiation and activity.
2. Materials and methods
2.1. Zebrafish rearing.
Wild type zebrafish AB strain were raised at 28.5°C according to standard protocols. All zebrafish studies were approved by the Deakin University Animal Welfare Committee (AWC81–2011). All medaka studies were performed according to protocols approved by the Institutional Animal Care and Use Committee (IACUC) of the National University of Singapore (R14–293, BR15–0119).
2.2. Von Kossa staining.
Embryos underwent treatment or combination treatment from 50–72 hpf, were rinsed several times in E3 media (60X stock: 34.8 g NaCl; 1.6 g KCL; 5.8 g CaCl2. 2H2O; 9.78 MgCl2. 6H2O to a final volume of 2L, pH=7,2) at 72 hpf, and returned to the incubator at 28.5°C. Larval fish were fixed in 4% paraformaldehyde (PFA) (Sigma-Aldrich, Castle Hill, NSW, Australia) at 144 hpf overnight at 4°C. Embryos were rinsed in phosphate buffer solution with 0.1% tween (PBTw) before being stained with 1% silver nitrate under a 60 Watt lamp for 2 hours until whole bodies were brown. Fish were then rinsed once in 0.1% PBTw and then fixed in 2.5 % sodium thiosulphate for 15 min. They were rinsed in PBTw for 5 min, before passing through a glycerol series (30% glycerol/70% PBTw, 50% glycerol/50% PBTw, 70% glycerol/30% PBTw) for imaging and storage at 4°C.
2.3. Alizarin red staining.
Embryos underwent treatment from 50–72 hpf, were rinsed several times in E3 media, and returned to the incubator at 28.5°C. They were fixed in 4% PFA at 128 hpf for two hours at 4°C before being stored in PBTw overnight at 4°C. A working solution of 0.005% alizarin red in 0.5% potassium hydroxide was created from a stock of 0.1% alizarin red dissolved in 96% ethanol. The embryos were stained with the working solution and left to rock overnight at room temperature. The following day, embryos were rinsed with PBTw for 5 min and transferred to 70% glycerol for immediate imaging.
2.4. Tartrate-resistant alkaline phosphatase (TRAP) staining.
Larval fish underwent treatment from 12–14 dpf then were fixed at 14 dpf in 4% PFA overnight at 4°C. Larvae were then rinsed several times with pre-warmed water at 37°C. TRAP staining was performed with the Leukocyte Acid Phosphatase (TRAP) Kit (Sigma). The stock solution included 4% acetate solution, 2% tartrate solution, 1% Fast Garnet GBC Base solution, 1% sodium nitrate solution, and 1% napthol AS-BI phosphate solution in pre-warmed water at 37°C. The fish were stained with the stock solution at 37°C for 1–2 hours until the whole body was brown and then rinsed several times in water before being bleached with 10% H2O2 for several hours until TRAP staining was evident. The larvae were rinsed with PBtw and transferred to 70% glycerol for storage at 4°C and imaging.
2.5. Whole-mount in situ hybridization (WISH).
Embryos were treated with phenylthiourea to inhibit pigment development and fixed in 4% PFA at desired time-points overnight at 4°C. Fish were then rinsed with PBtw and stored in 100% methanol at −20°C. Riboprobes for runx2a, osterix (osx), osteonectin (sparc), osteopontin (spp1) and collagen 10 alpha 1 (col10a1) were used as previously described. [26]
2.6. Chemical treatments.
Win 55,212–2 (WIN), Rimonabant (RIMO), 4-diethylaminobenzaldehyde (DEAB), oleamide (OLE), AM65445 and JD5037 were dissolved into dimethyl sulfoxide (DMSO) in a stock solution of 10 mM. All-trans retinoic acid (RA) was dissolved into ethanol in a stock solution of 100 mM. Solutions were stored at −20°C. Embryos were placed into 25 ml of E3 medium in 50 ml tubes. Appropriate volumes of chemicals were added directly to the medium and tubes were placed horizontally in an incubator at 28.5°C. Oleamide and AM6545 were purchased from Tocris Bioscience (Bristol, UK). Rimonabant was purchased from Cayman Chemical (Ann Arbor, MI, USA). JD5037 was purchase from MedChem Express. DEAB and RA were purchased from Sigma-Aldrich. The concentration of the different drugs used in this project are based on our previous dose-response analysis of the compounds [29].
2.7. Imaging.
Zebrafish images were taken with an Axioskop 2 Imager (Zeiss) and an AxioCam MRc5 digital camera (Zeiss) or a discovery V8 stereomicroscope (Zeiss) with an Axiocam 105 color digital camera (Zeiss). Medaka imaging was performed with a Nikon SMZ1000 equipped with NIS-Elements BR 3.0 software (Nikon). Photos were processed with Adobe Photoshop software. For the generation of graphs presented in Figures 1M, 7M and 7N, we used the the ImageJ software to quantify the areas of staining of interest of the stem and fan of the opercle (see Supplemental Figure 1 for demarcation of stem versus fan in the opercle) (n=8). For the graphs presented in Figures 4 L and M, we counted the number of neuroarches (4L) and measure the length of the fish from head to tail (excluding the caudal fin) (4M) (n=8).
Figure 1. Modulation of the retinoic acid and endocannabinoid signaling pathways influence larval bone mineralization and calcification.

Zebrafish were treated from 50–72 hpf with DEAB, RA, RIMO, OLE, and WIN and mineralization of the opercle (arrowhead) was detected at 144 hpf with von Kossa stain (A-L). Mineralization of the opercle stem was quantified (M, n = 10) from the area of labeling above the opercle fan, marked by the blue line (B, arrow) (See Supplemental Figure 1 for a schematic representation of the positioning of the blue line in the opercle). Zebrafish embryos were treated from 50–72 hpf and stained with alizarin red at 128 hpf to detect calcification (N-Y, n = 10). The effects on calcification from DEAB, RA, RIMO, OLE, and WIN treatments are consistent with the effects on mineralization. Imaged zebrafish are a representation of zebrafish in their respective groups.
Figure 7. Combined sup-optimal doses of RA and ECS modulating chemicals is sufficient to influence bone development.

Zebrafish were treated from 50–72 hpf with 60% combined doses of RA+RIMO, DEAB+OLE, or DEAB+WIN and mineralization of the opercle (black arrowhead) and opercle stem (white arrowhead) was assessed at 144 hpf with von Kossa stain (A-H). RA+RIMO showed no effect on mineralization (C,D). Both DEAB+OLE or DEAB+WIN treatments were sufficient to reduce mineralization (E-H). Measurements of the area of staining of the opercle stem support these observations (M, n = 9). The effects of combined doses on col10a1 expression was assessed at 72 hpf following treatment from 36–72 hpf (I-L). RA+RIMO showed no effect on col10a1 expression (J). Both DEAB+OLE or DEAB+WIN treatments were sufficient to reduce expression (K,L). Quantification of staining of the opercle supports the observed expression (N, n = 10).
Figure 4. RA signaling inhibits and the ECS enhances osteoclast development.

Zebrafish larvae were treated between 12 – 14 dpf with DEAB, RA, RIMO, OLE, and WIN and active osteoclasts were stained at 14 dpf with TRAP (A-F). DEAB or OLE treatment increased TRAP labeled osteoclasts (B,E), whereas RA or RIMO decreased stained cells (C,D). A medaka line with a cathepsin k promoter driving GFP was used to assess osteoclast development in neural arches at 21 dpf following 2 days of treatment (G-L). RA treatment decreased detectable osteoclasts (H,L). DEAB or WIN treatment increased osteoclast abundance (I,J,L). RIMO treatment showed no effect on osteoclasts (K,L). Length of fish, as a measure of developmental defects from treatments, was not different between treatment groups and controls (M). *<0.001, #=0.153, +=0.053. n = 8 for TRAP staining, n = 8–12 for neural arch assessments, n = 3–6 for length measurements
2.8. Statistical analysis.
Results were displayed as averages relative to controls with error bars depicting standard error of the mean (SEM). These measurements were normally distributed, and an independent two-tailed T-Test was performed. Statistical significance was determined if p ≤ 0.05.
3. Results
3.1. Enhancing RA signaling or reducing the ECS promotes bone formation
In considering bone formation, we first assessed the effect that modulating the RA or ECS pathways (Table 1) had on bone phosphate mineralization and calcification in developing zebrafish larvae.
Table 1.
Expected effects of the modulation of the RA and ECS pathways on bone mineralization and calcification.
| Chemical | Pathway | |
|---|---|---|
| RA | ECS | |
| DEAB | ↓ | - |
| RA | ↑ | - |
| RIMO | - | ↓ |
| OLE | - | ↑ |
| WIN | - | ↑ |
To assess the effects of the treatments on mineralization, we focused on the development of the stem of the opercle, the first bone to form in zebrafish larvae (Fig. 1A–M). Zebrafish were treated with 0.25 μM RA or 7.5 μM diethylaminobenzaldehyde (DEAB) to enhance or inhibit RA signaling, respectively, from 50 to 72 hours post fertilization (hpf) and bone was labeled with von Kossa staining at 144 hpf (Fig. 1A–F,M). DEAB treatment reduced the amount of mineralization in the opercle stem while RA treatment had no effect compared with controls. We then treated embryos with 4 μM Rimonabant (RIMO), a cannabinoid receptor 1 inverse agonist, 0.4 μM WIN 55212–2, a cannabinoid receptor 1 and 2 agonist, or 4 μM oleamide (OLE), a cannabinoid receptor 1 selective agonist at the same timings (Fig. 1G–M). The larvae that were exposed to RIMO had an increased area of mineralization of the opercle stem, while those treated with WIN or OLE had a reduced area. To evaluate calcification of developing bone, alizarin red staining was performed on 128 hpf larvae that were exposed to the same treatment conditions (Fig. 1N–Y). Fittingly, we observed the same effects from treatment, with decreased bone calcification from DEAB or OLE exposure and increased bone from RA or RIMO treatment compared with controls (Fig. 1N–W). Interestingly, we did not detect a measurable change in the calcification in WIN treated larvae (Fig. 1X,Y). These data show that from 50–72 hpf, inhibition of RA synthesis and activation of ECS signaling decrease bone deposition, while exogenous RA and blocking the ECS act to enhance bone development.
3.2. RA signaling has time-specific effects on osteoblast gene expression while the ECS does not
To further elucidate the effects of modulating these two pathways, and because they may have varying influences on bone formation at distinct phases of development, we used whole-mount in situ hybridization (WISH) to detect the genes expressed by osteoblasts at early, intermediate, and late stages of osteoblast differentiation. For the early time-point, embryos were treated from 36–50 hpf and fixed at 50 hpf. Due to the younger age of specimen, doses were adjusted to 0.25 μM RA, 7.5 μM DEAB, 3.5 μM RIMO, and 3.5 μM OLE to avoid developmental defects, while WIN was maintained at 0.4 μM (no developmental delay or toxicity were detected at this concentration of WIN). To evaluate the osteoblast precursors population of the developing opercle, the expression of runx2a was labeled (Fig. 2A–F). Embryos treated with DEAB or RIMO showed increased runx2a (Fig. 2B,D), while those exposed to RA, OLE, or WIN had decreased expression (Fig. 2C,E,F). A similar result was observed using the runx2b probe (not shown). For the intermediate timing, embryos were treated from 36 to 62 hpf and the expression of osterix (osx/sp7) was observed at 62 hpf (Fig. 2G–L). Treatment with 7.5 μM DEAB, 3.5 μM OLE, or 0.4 μM WIN reduced expression compared with controls (Fig. 2H,K,L) and treatment with 0.25 μM RA or 3.5 μM RIMO caused limited to no change in expression (Fig. 2I,J). The late time range was evaluated at 72 hpf after treatment from 36 to 72 hpf. To determine the effects on osteoblasts at the late stage, the expression of sparc (osteonectin) was labeled (Fig. 2M–R). Treatment with 7.5 μM DEAB, 3.5 μM OLE, or 0.4 μM WIN reduced expression (Fig. 2N,Q,R) and treatment with 0.25 μM RA or 3.5 μM RIMO increased the expression of sparc at 72 hpf (Fig. 2O,P). These late period sparc expression changes, observed in the opercle, are supported by comparable changes in the expression of osteopontin and col10a1, other genes expressed by osteoblasts in the later stages of development like ssp1 (Supplemental Fig. 2). Taken together (Table 2), these data suggest that enhancing RA signaling early in osteoblast differentiation decreases osteoblast abundance.
Figure 2. Early, intermediate and late bone-specific gene expression is altered by modifying RA and ECS signaling in zebrafish.

Zebrafish embryos were treated with DEAB, RA, RIMO, OLE, and WIN from 36–50 hpf. At 50 hpf runx2a expression was assessed by WISH (A-F). Zebrafish embryos were treated between 36–62 hpf and at 62 hpf osx expression was assessed (G-L). Zebrafish embryos were treated between 36–72 hpf and sparc expression was assessed at 72 hpf (M-R). DEAB treatment increased runx2a expression (B) and decreased osx and sparc (H,N) while RA (C) treatment decreased runx2a and increased osx and sparc (I,O). RIMO treatment increased the expression of each gene (D,J,P) while both OLE and WIN decreased the expression of each (E,F,K,L,Q,R). n = 10 for all treatments and WISH analyses. Opercle insets are 4X magnifications of the original photos.
Table 2.
Effects of the modulation of the RA and ECS pathways on early, intermediate and late osteoblast formation.
| Osteoblast Genes | Treatments | |||||
|---|---|---|---|---|---|---|
| Time Period | Probe | DEAB | RA | RIMO | OLE | WIN |
| Early | runx2a | ↑ | ↓ | ↑ | ↓ | ↓ |
| Intermediate | osx | ↓ | - | - | ↓ | ↓ |
| Late | sparc | ↓ | ↑ | ↑ | ↓ | ↓ |
| Late | col10a1 | ↓ | ↑ | ↑ | ↓ | ↓ |
Conversely, later in osteoblast maturation, the opposite effect is true; enhancing RA signaling increases the osteoblast population, as judged by WISH. Interestingly, modulating the ECS at varying time windows did not have alternating influences on osteoblast development, the effects were consistent. To confirm a change in gene expression upon RA or ECS modulation, we dissected out the head of the embryos post treatment, extracted the mRNA and performed qRT-PCR for our genes of interest. For this analysis, we that you used an early (runx2a) and a late marker (spp1) for validation by qPCR. Both genes show a variation in levels of mRNA in accordance with what was observed by in situ hybridization (Supplemental Fig. 3).
3.3. RA and ECS signaling alter late osteoblast formation in zebrafish
To determine the effects of modulating these two pathways on mature osteoblasts, we used whole-mount in situ hybridization to detect changes in col10a1 expression in treated embryos. col10a1 is a marker of mature osteoblast in zebrafish [26]. For the late time-point evaluation, embryos were treated from 56–72 with 0.25 μM RA and from 48–72 hpf with 4 μM OLE, 0.4 μM WIN, 7.5 μM DEAB, and 4 μM RIMO. To evaluate changes in expression, col10a1 expression of the developing opercle was labeled (Fig. 3A–F). Zebrafish treated with RA and RIMO showed an increased col10a1 expression (Fig. 3B,C), while those exposed to DEAB, WIN or OLE had decreased expression (Fig. 3D–F). This data confirm that activating the RA pathway, increases mature osteoblast formation confirming the dual role for RA in bone formation previously proposed [14]. Additionally, this data also demonstrates that early modulation of the ECS pathway either increase or decrease expression of a late osteoblast marker.
Figure 3. RA and ECS signaling alter col10a1 expression in zebrafish.

Zebrafish were treated between 56–72 hpf for RA (B) and 48–72 hpf with RIMO (C), DEAB (D), WIN (E), and OLE (F). At 72 hpf, WISH was performed to observe any changes in col10a1 expression (B-F) as compared to the control (A) at the opercle marked with a black arrow, or marked by an arrowhead in close-ups. RA (B) and RIMO (C) treatments increased col10a1 expression as compared to control (A). DEAB (D), WIN (E) and OLE (F) treatments decreased col10a1 expression as compared to control (A). n = 10 for each treatment group.
3.4. RA signaling and the ECS influence osteoclast abundance
Since we have shown that modulating these pathways can influence bone development by altering osteoblast maturation, we wanted to examine more potential impacts on osteoclast activity or abundance. All treatments were given from 12 to 14 dpf (Fig. 4A–F). Due to the longer treatments and the age of the fish, a dose response was done for each chemical (data not shown). Treatment with 7.5 μM DEAB or 4 μM OLE increased TRAP labeled osteoclasts compared with controls (Fig. 4B,E), whereas 0.25 μM RA or 0.3 μM RIMO decreased stained cells (Fig. 4C,D). Exposure to 0.4 μM WIN only marginally increased the number of osteoclasts at 14 dpf (Fig. 4F).
To additionally determine the effects of modulating RA and ECS signaling on osteoclast abundance, we made use of another fish model to which we had access. We used a transgenic medaka (Oryzias latipes) line in which the green fluorescent protein (GFP) is under control of the cathepsin k promoter, a protease expressed by active osteoclasts (Fig. 4G–K). [28] Larval fish were treated from 19 to 21 dpf with 0.5 μM RA, 15 μM DEAB, 0.5 μM WIN, or 0.6 nM RIMO. Doses were based on previous treatments in zebrafish and dose responses in medaka (data not shown). Following two-day treatments, the number of neural arches with GFP-expressing cells were quantified (Fig. 4L). Treatment with 0.5 μM RA significantly reduced the numbers of arches with active osteoclasts, while exposure to 0.5 μM WIN increased their numbers (Fig. 4H,J,L). Treatment with 15 μM DEAB showed a trend toward an increase (Fig. 4I,L). Due to naturally occurring variance in fish growth, length of fish was used to control for potential confounding factors on osteoclast numbers. Fish showed no significant difference in body length (Fig. 4M).
3.5. Blocking the peripheral action of CB1 increases osteoblast number and decreases osteoclast activity
Because CB1 action can be either central or peripheral, we decided to focus on the peripheral action of CB1 as bone development is taking place outside of the central nervous system. We took advantage of the recently designed AM6545 and JD 5037 CB1 antagonists. Both of these drugs were originally studied in the context of obesity and type 2 diabetes. In order to determine the effects of AM6545 and JD 5037 on osteoblast gene expression, zebrafish were exposed to AM6545 and JD5037 from 36–62 hpf and analyzed for osterix expression (Fig. 5A–C), and 36–72 hpf for col10a1 and sparc analysis (Fig 5D–I). At 62 hpf, it was determined that both AM and JD increased osterix expression (Fig. 5B,C) as compared to the control (Fig. 5A). Treatments with both AM6545 and JD5037 increased col10a1 (Fig. 5D–E) and sparc (Fig. 5G–I) expression as compared to the control at 72 hpf.
Figure 5. AM and JD effects on col10a1 expression in mid-to-late time development.

Shows the effects of AM6545 and JD5037 on gene expression for 62 (A,B,C) and 72 hpf (D-I) at the opercle bone marked with a black arrow. Zebrafish were exposed to the compounds from 36–62 hpf for osx (B,C) and 36–72 hpf for col10a1 and sparc, respectively. AM6545 (B) and JD5037 (C) increased expression of osx at 62 hpf as compared to the control (A) at 62 hpf. Both compounds (E,F) showed an increase in col10a1 expression at 72 hpf as compared to the control (D) at 72 hpf. Additionally, AM6545 (H) and JD5037 (I) increased sparc expression as compared to the control (G) at 72 hpf. n = 10 for each treatment group. For each treatment, 100% of zebrafish (B,C,E,F,H,I) showed an increase in gene expression as compared to their control (A,D,G) regardless of the gene being observed.
Because AM6545 and JD5037 exposure increase osteoblast gene expression, we wanted to determine what effects of AM6545 and JD5037 have on bone calcification. To this end we performed an alazarin red staining. Then, we noted and recorded any noticeable changes in calcification through observation of the developing opercle. Embryos were exposed to AM6545 and JD5037 from 48–72 hpf (Fig. 6B,C). The embryos exposed to AM6545 (Fig. 6B) showed an increase in calcification at 128 hpf as compared to the control (Fig. 6A) at 128 hpf. Embryos exposed to JD5037 (Fig. 6C) showed a dramatic increase in calcification as compared to the control (Fig. 6A) at 128 hpf.
Figure 6. Blocking the peripheral activity of CB1 increases bone calcification and mineralization while decreasing osteoclast activity.
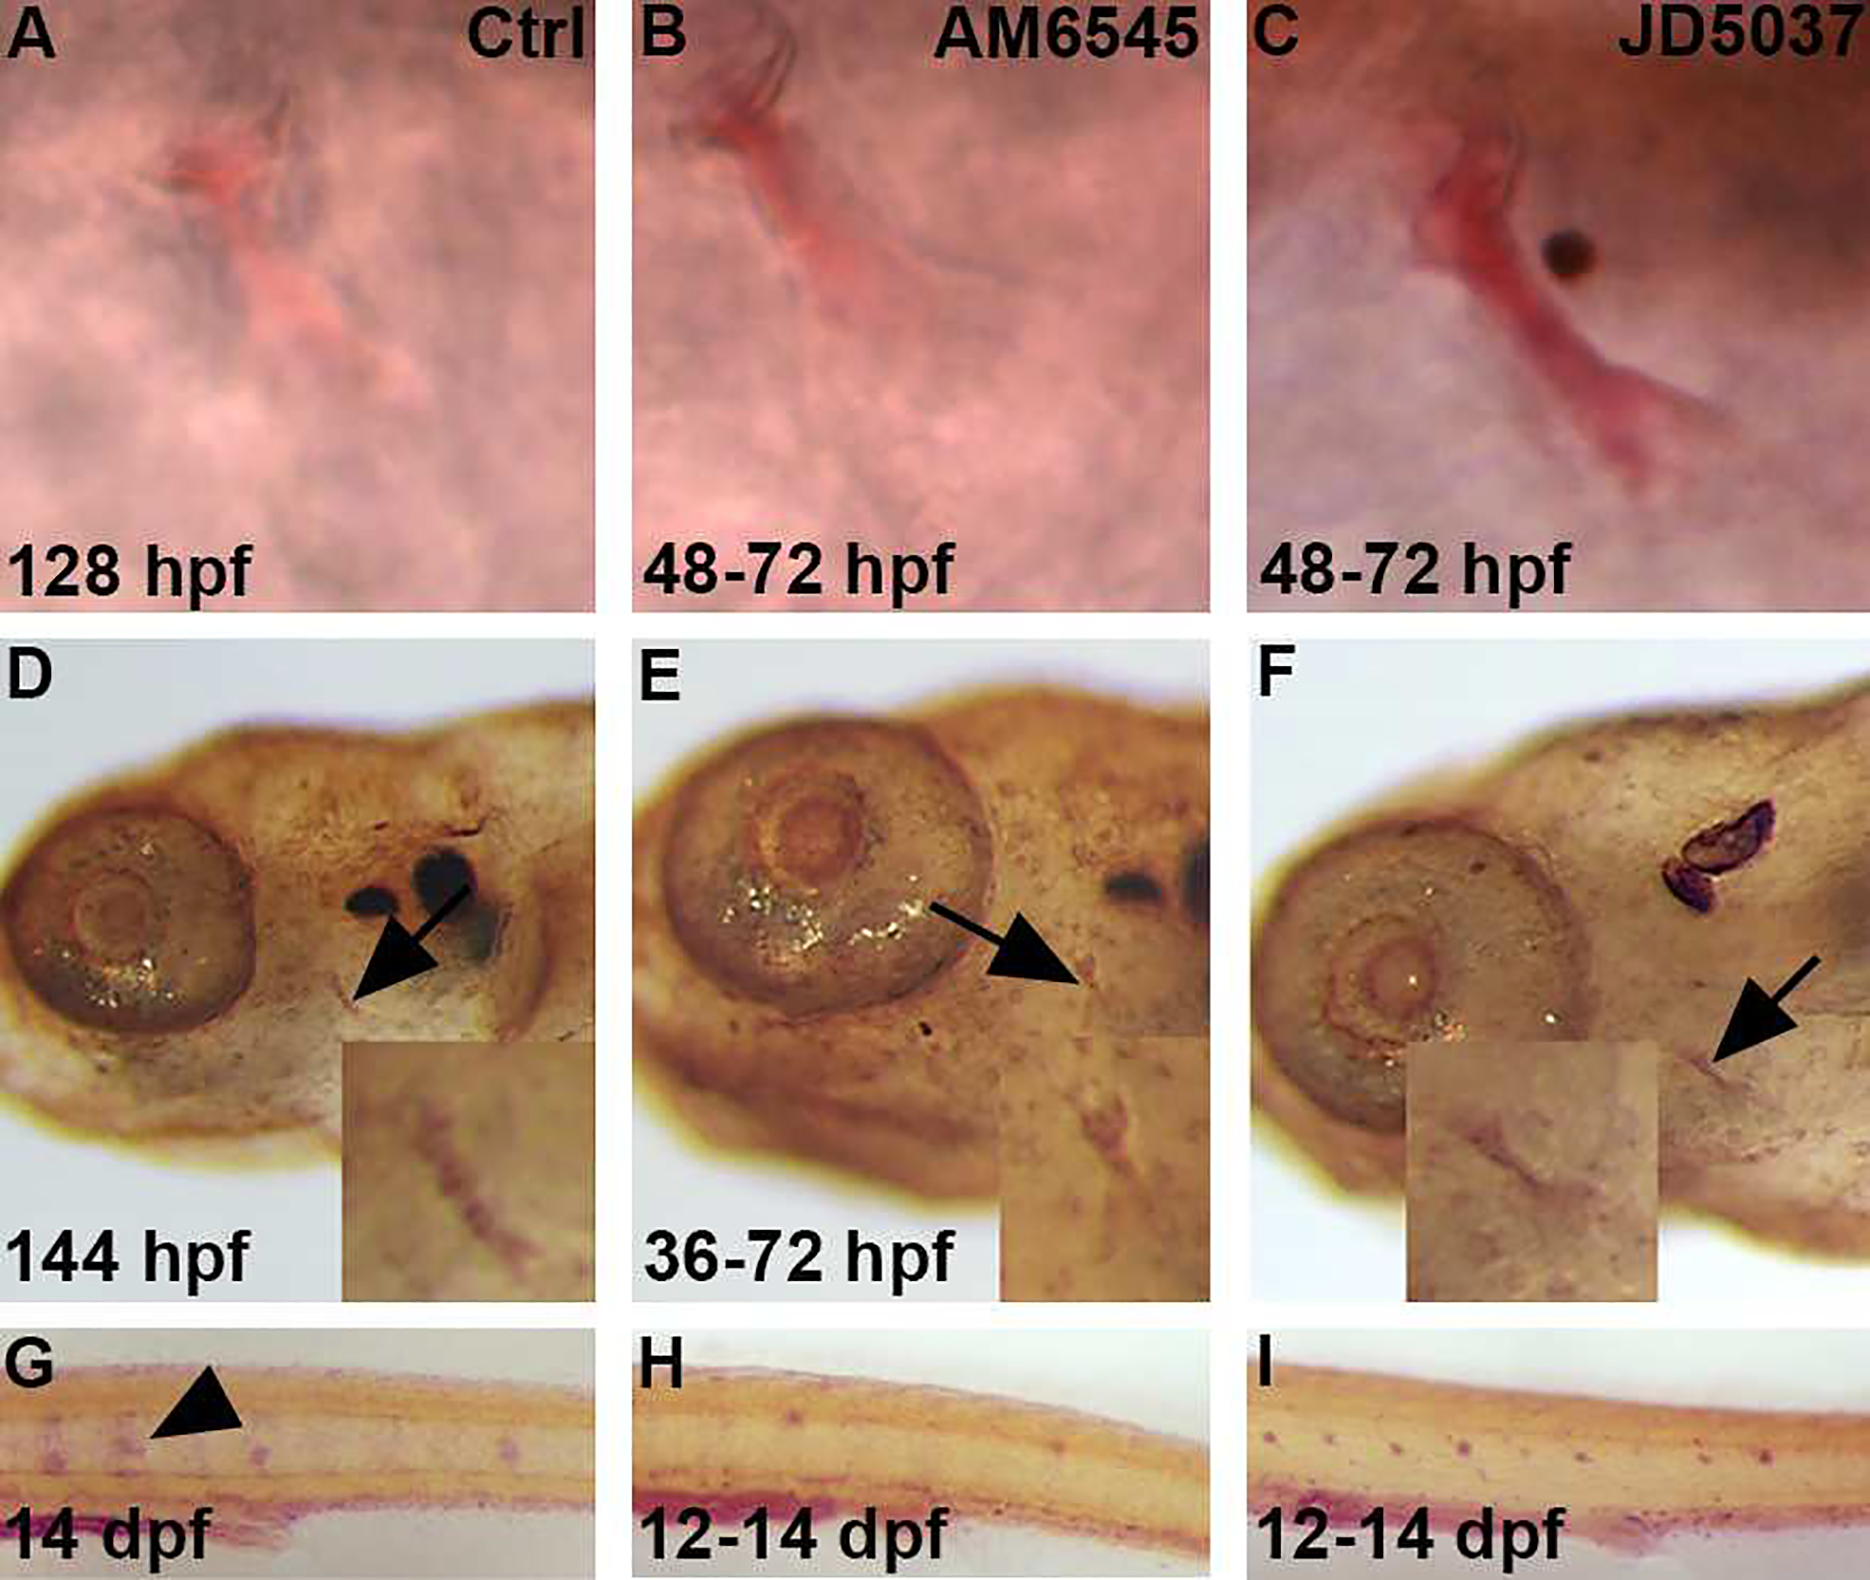
Zebrafish were exposed to either AM6545 (B) or JD5037 (C) from 48–72 hpf. Alazarin red staining was performed at 128 hpf to determine if there were any changes in calcification at the opercle bone, marked by the black arrows, after exposure (B,C) as compared to control (A). Both AM6545 (B) and JD5037 (C) showed a calcification increase as compared to the control (A) at 128 hpf. n = 12 for each treatment group. For AM6545 (B), 100% of zebrafish showed a significant increase in calcification as compared to the control (A). For JD5037 (C), 100% of zebrafish showed a significant increase in calcification as compared to both the control (A) and AM6545 (B). Zebrafish were exposed to AM6545 (E) and JD5037 (F) from 36–72 hpf and fixed at 144 hpf. At 144 hpf, Von Kossa staining was performed in order to observe any changes in mineralization after exposure (E,F) as compared to the control (D). Images were taken at 8x and 20x (D,E,F). Both AM6545 (E) and JD5037 (F) exposure led to a mineralization increase at 144 hpf as compared to the control (D) at 80x and 200x magnification. n = 10 for each treatment group. 100% of AM6545 (E) exposed zebrafish showed a significant increase mineralization as compared to the control (D). As for JD5037 (F), 100% of zebrafish showed a significant mineralization increase as compared to the control (D), and the AM6545 (E) exposed zebrafish. Tartrate Resistant Acid Phosphatase (T.R.A.P.) stain shows presence of osteoclasts. The zebrafish were exposed to AM6545 (H) and JD5037 (I) from 12–14 dpf. At 14 dpf, the larvae were fixed and TRAP was performed to determine any changes in osteoclast presence (G,H,I). Both AM6545 (H) and JD5037 (I) exposure showed a significant decrease in osteoclast presence at 14 dpf as compared to the control (G) at 14 dpf. n = 10 for each treatment group. For the control group (G) 100% showed high osteoclast activity that is common at 14 dpf. For AM6545 (H), 70% showed little to no osteoclast activity, and 30% showed a significant decrease in osteoclast presence as compared to the control. For JD5037 (I), 80% showed little to no osteoclast presence, and 20% showed a significant decrease in osteoclast presence. Overall, after exposure to either compound (H,I), 100% of the zebrafish showed a significant decrease in osteoclast presence as compared to the control (G).
Since we observed changes in calcification, we wanted to determine if there was a subsequent change in mineralization (Fig. 6D–F) after exposure to either compound. Therefore, we treated embryos from 36–72 hpf with AM6545 (Fig. 6E) or JD5037 (Fig. 6F). Then, we performed a Von Kossa staining at 144 hpf. Exposure of embryos to AM6545 (Fig. 6E) showed a mineralization increase as compared to the control (Fig. 6D) at 144 hpf. After exposure to JD5037 from 36–72 hpf (Fig. 6F), the zebrafish showed a mineralization increase as compared to the control (Fig. 6D).
To study the effects of the peripheral selected CB1 antagonists AM6545 and JD5037 on osteoclast activity, we used TRAP staining, which is expressed by osteoclasts actively involved in resorbing bone. In the zebrafish, osteoclasts develop much later than osteoblasts, but are detectable by 12 days post fertilization (dpf). Therefore, we stained larval fish for TRAP at 14 dpf. [27] As for exposure time, larvae were treated from 12–14 dpf with either AM6545 or JD5037 and TRAP staining was performed at 14 dpf (Figure 6G–I). After treating with AM6545 (Fig. 6H), it was determined that there was a significant decrease in osteoclast presence as compared to the control (Fig. 6G) at 144 hpf. The treatment with JD5037 (Fig. 6I) also showed a significant decrease in osteoclast presence as compared to the control (Fig. 6G) at 144 hpf.
After analyzing the results (Fig. 6A–I), it was apparent that blocking the Cb1 receptor only in the periphery with either AM6545 or JD5037 increases bone calcification, subsequent mineralization as well as, decreasing osteoclast activity in vivo.
3.6. Combined suboptimal doses of RA and ECS pathways have additive influences on bone development
Potential therapeutics for osteoporosis would benefit from mildly influencing both pathways to avoid deleterious effects of high doses. Therefore, we wanted to see if RA signaling and the ECS could be combined to influence osteoblast maturation. Based on previously reported work from our laboratory, [29] we decided that a 60% suboptimal dose of the full treatments (from Figs. 1–3) could be used so that single treatments would have no measurable effects, either in term of osteoblast or mineralization effects or side effects [29]. We again treated fish from 50 to 72 hpf and assessed bone mineralization at 144 hpf with von Kossa staining. To determine the combinatorial effects of modulating RA and ECS signaling, we treated the fish with a pairing of compounds that had matching effects from the earlier sets of experiments. Therefore, the chemical exposures were doses of 60% RA and 60% RIMO (individual full doses increased mineralization), 60% DEAB and 60% OLE (individual full doses decreased mineralization), or 60% DEAB and 60% WIN (individual full doses decreased mineralization) (Fig. 7A–H). The RA and Rimo combined treatment did not enhance mineralization (Fig. 7C,D). However, the DEAB combined with OLE or WIN treatments were both sufficient to reduce mineralization compared with controls (Fig. 7E–H). These data were confirmed by measuring the area of staining of the opercle stem (Fig. 7M). Single 60% doses of each treatment alone did not affect bone mineralization (data not shown).
In order to further evaluate the effects of combined treatments on bone formation, we performed WISH on larvae at 72 hpf for col10a1 expression (Fig. 7I–L). Fish were treated from 36 to 72 hpf with the combined 60% doses (full doses were those from Fig. 7M–R). The combined RA and Rimo treatment had no effect on col10a1 expression (Fig. 7J). The DEAB combined with OLE or WIN treatments each decreased the expression of col10a1 (Fig. 7K,L). Quantification of the area of the opercle supported the observations of the WISH staining (Fig. 7N). These data show that combined suboptimal doses of RA and ECS modulating chemicals are sufficient to influence bone growth.
3.7. Combined suboptimal doses of RA and ECS pathways have additive influences on osteoclast number and activity
Since we observed effects on osteoblast maturation and bone development from combined treatments, we wanted to examine if combinations of RA and ECS modulation was sufficient to affect osteoclast activity. Therefore, we treated larval fish with 60% RA and 60% RIMO, 60% DEAB and 60% OLE, or 60% DEAB and 60% WIN from 12 to 14 dpf. Again, we assessed actively resorbing osteoclasts with TRAP staining at 14 dpf (Fig. 8A–D). The combined 60% RA and 60% RIMO treatment reduced labeled osteoclasts (n=8, SD: 1.76) compared with controls (n=13; SD: 2,23) (Fig. 8A,B). The 60% DEAB and 60% OLE (n=23; SD: 3.24) and 60% DEAB and 60% (n=16; SD: 2.86) WIN treatments each increased the numbers of osteoclasts compared to control (Fig. 8C,D). These results demonstrate that combined modulations of RA and ECS signaling have quantifiable effect on the mineralization of bone, the formation of osteoblasts and the number of active osteoclasts in vivo.
Figure 8. Combined sup-optimal doses of RA and ECS modulating chemicals influence osteoclast activity.

Zebrafish were treated from 12–14 dpf with 60% combined doses of RA+RIMO, DEAB+OLE, or DEAB+WIN and osteoclast activity was assessed with TRAP stain at 14 dpf (A-D). RA+RIMO treated zebrafish had reduced numbers of labeled osteoclasts compared with controls (A,B). DEAB+OLE or DEAB+WIN had increased stained osteoclasts (C,D). n = 8 for each treatment group.
4. Discussion
4.1. RA and bone formation
Directing the proliferation and activity of osteoblasts and osteoclasts in vivo remains a goal and a challenge to researchers pursuing treatments for bone diseases. An effect of RA in bone development has been known for over 30 years. [30] However, since this time, determining the specific nature of RA in influencing bone growth has been elusive. Both in vitro and in vivo studies have provided opposing outcomes from manipulating RA signaling, some investigations reporting that RA promotes osteoblast proliferation while others report an inhibitory influence. [10,11,12,13,16,31,32] A study in zebrafish indicated that RA acts in a dual manner in influencing osteoblast proliferation, which might be causing or adding to the inability to define a consensus role of RA. [14,15,17] The authors showed that an early pulse treatment from 48 to 52 hpf of RA was sufficient to reduce bone mineralization. Additionally, RA treatment from 84 to 96 hpf increased ossification. Our study sought to more clearly delineate the timing of the RA influence during bone development. We observed that by treating fish from 36 to 72 hpf, that RA signaling already maintained a stimulatory role for osteoblast proliferation, prior to 84 to 96 hpf window. Additionally, we chose to begin treatment at an earlier time point (36 hpf) when osteoblasts start differentiating in zebrafish embryos, [33] yet ended treatment at 50 hpf. In this time range, RA inhibited runx2a expression, indicating a reduced osteoblast population. However, in our study, we also treated the embryos through an “intermediate” time-point (62 hpf) between the reported early (anti-bone) and late (pro-bone) stages. We observed that osx expression was decreased in DEAB treated embryos, while RA showed a neutral effect, implicating a window between 50 and 62 hpf where the effects of RA are reversed. Interestingly, treatment from early and through late timings resulted in a pro-bone effect of RA in the alizarin and von Kossa stained larvae. This could have arisen from the prolonged treatment during the late window, giving osteoblasts more time to recover to WT levels and beyond.
4.2. ECS and bone formation
Much less is known about the influence of the ECS on bone development, though there is evidence for some regulation by the ECS. For example, marrow stromal cells from CB1−/− mice have shown reduced ability to differentiate into osteoblasts. [21] However, it was reported that the CB1 agonist anandamide decreased human osteoblast proliferation. [25] In our study, inhibiting CB1 increased bone mineralization, calcification and the expression of osteoblast markers in the opercle of zebrafish. Moreover, activating CB1 alone or both CB1 and CB2 decreased bone development. Interestingly, unlike RA treatments, the effects were consistent through all time ranges.
The development and potential treatment of osteoporosis rely on more than just controlling the numbers of osteoblasts. Regulation of osteoclasts must also be taken into account so that there is a minimizing of bone degradation. Similar to the relation of RA and osteoblasts, there is a lack of consensus regarding the effects of RA on osteoclasts. [34,35] Using juvenile medaka, we show that RA reduced the numbers of osteoclasts present in the neural arches. Furthermore, osteoclast activity was lower in juvenile zebrafish. Again, with the ECS as well, seemingly contradictory effects on osteoclasts have been reported. [19] Our data show that ECS activation enhanced osteoclast numbers and activity in medaka and zebrafish, respectively.
4.3. Peripheral Action of CB1 Antagonist and Inverse Agonist AM6545 and JD5037
In 2006, the CB1 inverse agonist Rimonabant was approved in Europe as an anti-obesity or appetite suppressor drug. However, because Rimonabant acts as a neurotransmitter, an increase in depression was observed in some patients during clinical trials leading to suicide ideation in around 1% of patients, it was withdrawn worldwide in 2008. These side effects led to the discontinuation of Rimonabant for central nervous system issues. [36] However, as seen in this project and numerous times in literature, CB1 plays a major role in the peripheral nervous system. Therefore, it was feasible to design, or test, a novel drug with similarity to Rimonabant that will not cross the blood-brain-barrier, and only targets the peripheral systems, including bones. Two derivatives of Rimonabant: AM6545 and JD5037 were originally designed as anti-obesity or appetite suppressor drugs. However, unlike Rimonabant, AM6545 and JD5037 only act on the peripheral system as a CB1 antagonist and inverse agonist, respectively. [37,38] This eliminates the possibility of any adverse reaction on the central nervous system. Additionally, through in vivo testing, it would be possible to evaluate these drugs as potential anti-osteoporosis treatments without interfering with the central role of CB1, or the central nervous system.
4.4. Additive effects of sub-optimal doses of RA and RIMO in bone formation
Both RA signaling and the ECS are active in many different cell types and tissues within the human body. Therefore, treatment with a chemical targeting a single pathway may cause harmful effects to a patient. We had previously shown that combining suboptimal doses from RA signaling and the ECS was sufficient to influence lipid accumulation in zebrafish. [29] For this reason, we chose to pursue suboptimal combination treatments of the pathways to observe potential additive outcomes on bone growth. We found that suboptimal reduction of RA signaling while activating the ECS was sufficient to inhibit bone mineralization and osteoblast specific gene expression. However, the opposite treatments (activating RA and inhibiting the ECS) did not significantly increase mineralization. Although not evaluated in this study, pharmacological treatments performed after the first phase of osteoblast formation could lead to better outcomes in terms of bone mineralization when combining sub-optimal doses of RA and RIMO. Moreover, increasing the number of osteoblasts is a goal for enhancing bone repair after fractures. It will be of high interest to combine RA and RIMO sub-optimal dose treatments in models of age related or induced osteoporosis and during the process of bone repair in fish and mammals.
Additionally, the combination treatments showed very promising results in terms of the number osteoclasts in zebrafish larvae. Reducing RA and stimulating the ECS, which lowered mineralization and presumptive osteoblast abundance in young zebrafish larvae, was capable of increasing osteoclast activity. Conversely, increasing RA and inhibiting the ECS reduced the number of active osteoclast in larvae. This latter point is important in terms of putative therapeutics of bone related diseases, as one of the main issues in osteoporosis is the relatively high bone resorption caused by more active osteoclasts. Here, in our larval fish model, we were able to dramatically reduce the number of active osteoclasts, an objective of the research community to fight osteoporosis.
Supplementary Material
Acknowledgments
The authors would like to thank the staff members of the Deakin University; NUS zebrafish and medaka and UMMC zebrafish facilities for providing excellent husbandry care. CW is supported by grants from the Ministry of Education in Singapore: MOE2013-T2–2-126 and MOE2016-T2–2-086. YG is supported by a National Institutes of Health grant: P20 GM104357 and by internal grants from the department of Cell and Molecular Biology at UMMC.
Disclosure. The authors report no conflicts of interest in this work. YG is supported by a National Institute of Health grant number: P20 GM104357 and by the department of Cell and Molecular Biology at UMMC. The medaka study is supported by grants from the Ministry of Education, Singapore (MOE2016-T2–2-086) and the National Research Foundation Singapore (NRF2017-NRF-ISF002–2671).
Footnotes
Publisher's Disclaimer: This is a PDF file of an unedited manuscript that has been accepted for publication. As a service to our customers we are providing this early version of the manuscript. The manuscript will undergo copyediting, typesetting, and review of the resulting proof before it is published in its final form. Please note that during the production process errors may be discovered which could affect the content, and all legal disclaimers that apply to the journal pertain.
References
- 1.Njeh CF, Boivin CM, Langton CM. The role of ultrasound in the assessment of osteoporosis: a review. Osteoporos Int 1997;7(1):7–22. [DOI] [PubMed] [Google Scholar]
- 2.Yoshiya T, Shingo N, Yosuke O. Osteoblasts and osteoclasts in bone remodeling and inflammation. Curr Drug Targets Inflamm Allergy. 2005;4(3):325–328. [DOI] [PubMed] [Google Scholar]
- 3.Everts V, Korper W, Hoeben KA, et al. Osteoclastic Bone Degradation and the Role of Different Cysteine Proteinases and Matrix Metalloproteinases: Differences Between Calvaria and Long Bone. J Bone Miner Res. 2006;21(9):1399–1408. [DOI] [PubMed] [Google Scholar]
- 4.Shapiro F Bone development and its relation to fracture repair. The role of mesenchymal osteoblasts and surface osteoblasts. Eur Cell Mater 15:53–17. [DOI] [PubMed] [Google Scholar]
- 5.Duester G Retinoic acid synthesis and signaling during early organogenesis. Cell 2008;134(6):921–931. [DOI] [PMC free article] [PubMed] [Google Scholar]
- 6.Kam RKT, Deng Y, Chen Y, Zhao H. Retinoic acid synthesis and functions in early embryonic development. Cell Biosci. 2012;2(1):11. [DOI] [PMC free article] [PubMed] [Google Scholar]
- 7.Dolle P, Ruberte E, Kastner P, Petkovich M, Stoner CM, Gudas LJ, Chambon P. Differential expression of genes encoding α, β and γ retinoic acid receptors and CRABP in the developing limbs of the mouse. Nature 1989;342(6250):702–705. [DOI] [PubMed] [Google Scholar]
- 8.Song HM, Nacamuli RP, Xia W, Bari AS, Shi Y-Y, Fang TD, Longaker MT. High-dose retinoic acid modulates rat calvarial osteoblast biology. J Cell Physiol. 2004;202(1):255–262. [DOI] [PubMed] [Google Scholar]
- 9.Williams JA, Kondo N, Okabe T, Takeshita N, Pilchak DM, Koyama E, Ochiai T, Jensen D, Chu M-L, Kane MA, Napoli JL, Enomoto-Iwamoto M, Ghyselinck N, Chambon P, Pacifici M, Iwamoto M. Retinoic acid receptors are required for skeletal growth, matrix homeostasis and growth plate function in postnatal mouse. Dev Biol. 2009;328(2):315–327. [DOI] [PMC free article] [PubMed] [Google Scholar]
- 10.Gazit D, Ebner R, Kahn AJ, Derynck R. Modulation of expression and cell surface binding of members of the transforming growth factor-β superfamily during retinoic acid-induced osteblastic differentiation of multipotential mesenchymal cells. Mol. Endocrinol. 1993;7:189–198. [DOI] [PubMed] [Google Scholar]
- 11.Cohen-Tanugi A, Forest N. Retinoic acid suppresses the osteogenic differentiation capacity of murine osteoblast-like 3/A/1D-1M cell cultures. Differentiation. 1998;63(3):115–123. [DOI] [PubMed] [Google Scholar]
- 12.Iba K, Chiba H, Yamashita T, Ishii S, Sawada N. Phase-independent inhibition by retinoic acid of mineralization correlated with loss of tetranectin expression in a human osteoblastic cell line. Cell Struct and Funct. 2001;26(4):227–233. [DOI] [PubMed] [Google Scholar]
- 13.Skillington J, Choy L, Derynck R. Bone morphogenetic protein and retinoic acid signaling cooperate to induce osteoblast differentiation of preadipocytes. J Cell Biol. 2002;159(1):135–146. [DOI] [PMC free article] [PubMed] [Google Scholar]
- 14.Spoorendonk KM, Peterson-Maduro J, Renn J, Trowe T, Kranenbarg S, Winkler C, Schulte-Merker S. Retinoic acid and cyp26b1 are critical regulators of osteogenesis in the axial skeleton. Development. 2008;135(22):3765–3774. [DOI] [PubMed] [Google Scholar]
- 15.Blum N, Begemann G. Osteoblast de- and redifferentiation are controlled by a dynamic response to retinoic acid during zebrafish fin regeneration. Development. 2015;142(17):2894–2903. [DOI] [PubMed] [Google Scholar]
- 16.Jeradi S, Hammerschmidt M. Retinoic acid-induced premature osteoblast-to-preosteocyte transitioning has multiple effects on calvarial development. Development. 2016;143(7):1205–1216. [DOI] [PMC free article] [PubMed] [Google Scholar]
- 17.Li N, Kelsh R, Croucher P, Roehl HH. Regulation of neural crest cell fate by the retinoic acid and Pparg signalling pathways. Development. 2010;137(3):389–394. [DOI] [PMC free article] [PubMed] [Google Scholar]
- 18.Battista N, Di Tommaso M, Bari M, Maccarrone M. The endocannabinoid system: an overview. Front Behav Neurosci. 2012;6(9):1–7. [DOI] [PMC free article] [PubMed] [Google Scholar]
- 19.Idris AI, Ralston SH. Cannabinoids and bone: friend or foe?. Calcif Tissue Int. 2010;87(4):285–297. [DOI] [PubMed] [Google Scholar]
- 20.Tam J, Ofek O, Fride E, Ledent C, Gabet Y, Müller R, Zimmer A, Mackie K, Mechoulam R, Shohami E, Bab I. Involvement of neuronal cannabinoid receptor CB1 in regulation of bone mass and bone remodeling. Mol Pharmacol. 2006;70(3):786–792. [DOI] [PubMed] [Google Scholar]
- 21.Idris AI, Sophocleous A, Landao-Bassonga E, Canals M, Milligan G, Baker D, van’t Hof RJ, Ralston SH. Cannabinoid receptor type 1 protects against age-related osteoporosis by regulating osteoblast and adipocyte differentiation in marrow stromal cells. Cell Metab. 2009;10(2):139–147. [DOI] [PubMed] [Google Scholar]
- 22.Ofek O, Karsak M, Leclerc N, Fogel M, Frenkel B, Wright K, Tam J, Attar-Namdar M, Kram V, Shohami E, Mechoulam R, Zimmer A, Bab I. Peripheral cannabinoid receptor, CB2, regulates bone mass. PNAS. 2006;103(3):696–701. [DOI] [PMC free article] [PubMed] [Google Scholar]
- 23.Idris AI, van’t Hof RJ, Greig IR, Ridge SA, Baker D, Ross RA, Stuart RH. Regulation of bone mass, bone loss and osteoclast activity by cannabinoid receptors. Nat Med. 2005;11(7):774–779. [DOI] [PMC free article] [PubMed] [Google Scholar]
- 24.Rossi F, Siniscalco D, Luongo L, De Petrocellis L, Bellini G, Petrosino S, Torella M, Santoro C, Nobili B, Perrotta S, Di Marzo V, Maione S. The endovanilloid/endocannabinoid system in human osteoclasts: possible involvement in bone formation and resorption. Bone. 2009;44(3):476–484. [DOI] [PubMed] [Google Scholar]
- 25.Smith M, Wilson R, O’Brien S, Tufarelli C, Anderson SI, O’Sullivan E. The effects of the endocannabinoids anandamide and 2-arachidonoylglycerol on human osteoblast proliferation and differentiation. PloS One. 2015;10(9):e0136546. [DOI] [PMC free article] [PubMed] [Google Scholar]
- 26.Fraher D, Hodge JM, Collier FM, McMillan JS, Kennedy RL, Ellis M, Nicholson GC, Walder K, Dodd S, Berk M, Pasco JA, Williams LJ, Gibert Y. Citalopram and sertraline exposure compromises embryonic bone development. Mol Psychiatry. 2016;21(5):656–664. [DOI] [PubMed] [Google Scholar]
- 27.Hammond CL, Schulte-Merker S. Two populations of endochondral osteoblasts with differential sensitivity to hedgehog signaling. Development. 136(23):3991–4000. [DOI] [PubMed] [Google Scholar]
- 28.To TT, Witten PE, Renn J, Bhattacharya D, Huysseune A, Winkler C. Rankl-induced osteoclastogenesis leads to loss of mineralization in a medaka osteoporosis model. Development. 2012;139(1):141–150. [DOI] [PubMed] [Google Scholar]
- 29.Fraher D, Ellis MK, Morrison S, McGee SL, Ward AC, Walder K, Gibert Y. Lipid abundance in zebrafish embryos is regulated by complementary actions of the endocannabinoid system and retinoic acid pathway. Endocrinology. 2015;156(10):3596–3609. [DOI] [PubMed] [Google Scholar]
- 30.Ng KW, Livesey SA, Collier F, Gummer PR, Martin JT. Effect of retinoids on the growth, ultrastructure, and cytoskeletal structures of malignant rat osteoblasts. Cancer Res. 1985;45(10):5106–5113. [PubMed] [Google Scholar]
- 31.Conaway HH, Henning P, Lerner UH. Vitamin A metabolism, action, and role in skeletal homeostasis. Endocr Rev. 2013;34(6):766–797. [DOI] [PubMed] [Google Scholar]
- 32.Green AC, Kocovski P, Jovic T, Walia MK, Chandraratna RAS, Martin TJ, Baker EK, Purton LE. Retinoic acid receptor signaling directly regulates osteoblast and adipocyte differentiation from mesenchymal progenitor cells. Experimental Cell Research 2017;350(1):284–297. [DOI] [PubMed] [Google Scholar]
- 33.Li N, Felber K, Elks P, Croucher P, Roehl HH. Tracking gene expression during zebrafish osteoblast differentiation. Dev Dyn. 2009;238(2):459–466. [DOI] [PubMed] [Google Scholar]
- 34.Jin Z, Li X, Wan Y. Minireview: nuclear receptor regulation of osteoclast and bone remodeling. Mol Endocrinol. 2015;29(2):172–186. [DOI] [PMC free article] [PubMed] [Google Scholar]
- 35.Henning P, Conaway HH, Lerner UH. Retinoid receptors in bone and their role in bone remodeling. Front Endocrinol. 2015;6(31):1–13. [DOI] [PMC free article] [PubMed] [Google Scholar]
- 36.Nishio S, Gibert Y, Berekelya L, et al. Fasting induces CART down-regulation in the zebrafish nervous system in a cannabinoid receptor 1-dependent manner. Mol Endocrinol. 2012;26(8):1316–1326. [DOI] [PMC free article] [PubMed] [Google Scholar]
- 37.Cluny NL, Vemuri VK, Chambers AP, et al. A novel peripherally restricted cannabinoid receptor antagonist, AM6545, reduces food intake and body weight, but does not cause malaise, in rodents. Br J Pharmacol. 2010;161(3):629–642. [DOI] [PMC free article] [PubMed] [Google Scholar]
- 38.Chorvat RJ, Berbaum J, Seriacki K, McElroy JF. JD-5006 and JD-5037: peripherally restricted (PR) cannabinoid-1 receptor blockers related to SLV-319 (Ibipinabant) as metabolic disorder therapeutics devoid of CNS liabilities. Bioorg Med Chem Lett. 2012;22(19):6173–6180. [DOI] [PubMed] [Google Scholar]
Associated Data
This section collects any data citations, data availability statements, or supplementary materials included in this article.