

Abstract
The current study evaluated whether in vitro measures of aromatase inhibition as inputs into a quantitative adverse outcome pathway (qAOP) construct could effectively predict in vivo effects on 17β-estradiol (E2) and vitellogenin (VTG) concentrations in female fathead minnows. Five chemicals identified as aromatase inhibitors in mammalian-based ToxCast assays were screened for their ability to inhibit fathead minnow aromatase in vitro. Female fathead minnows were then exposed to three of those chemicals, letrozole, epoxiconazole, and imazalil, in concentration response (five concentrations plus control), for 24 h. Consistent with AOP-based expectations, all three chemicals caused significant reductions in plasma E2 and hepatic VTG transcription. Characteristic compensatory up-regulation of aromatase and follicle stimulating hormone receptor (FSHR) transcripts in ovary was observed for letrozole but not the other two compounds. Considering the overall patterns of concentration-response and temporal concordance among endpoints, data from the in vivo experiments strengthen confidence in the qualitative relationships outlined by the AOP. Quantitatively, the qAOP model provided predictions that fell within the standard error of measured data for letrozole, but not for imazalil and epoxiconazole. However, the inclusion of measured plasma concentrations of the test chemicals as inputs improved model predictions, with all predictions falling within the range of measured values. Results highlight both the utility and limitations of the qAOP and its potential use in 21st century ecotoxicology.
Keywords: Endocrine disruption, adverse outcome pathway, new approach methodologies, computational toxicology, ecotoxicology
Graphical Abstract

INTRODUCTION
A vision for toxicity testing in the 21st century is to evaluate chemicals using batteries of high throughput screening assays that can be conducted rapidly and cost-effectively (Krewski et al. 2010). While a few high throughput assays measure apical endpoints like survival or development of intact complex organisms (e.g., Danio rerio embryos, Caenorhabditis elegans), recognizing the desire to reduce, refine, and/or replace animal testing (Russel and Burch, 1959) most measure more mechanistic endpoints like gene expression, enzyme activities, transcription factor activation, etc. in cell-based or cell-free systems (Kavlock et al. 2012). As a result, most data from high throughput screening assays do not directly translate to effects on survival, growth, development, and/or reproduction that have long served as the foundation for ecological risk assessment. To use mechanistic data for evaluating hazard, it is important to understand how the endpoint measured in an assay relates to one or more apical hazards of regulatory significance.
The adverse outcome pathway (AOP) framework was developed as a systematic and formalized approach for assembling and communicating the scientific support associating a mechanistically oriented biological change with adverse outcomes of regulatory interest (Ankley et al. 2010; Villeneuve et al. 2014). Adverse outcome pathways are described as a series of measurable key events that represent major milestones along a sequence of biological changes expected to occur if the interaction between a stressor and a molecular or cellular level biological target is adequate to elicit an adverse apical effect (Ankley et al. 2010; Villeneuve et al. 2014). Key events in an AOP are linked together by key event relationships that outline the biological understanding and empirical evidence that supports a causal relationship between two key events (Villeneuve et al. 2014). Ideally, key event relationships also capture quantitative understanding of how much change in the upstream key event, for how long, and under what conditions, is needed to evoke some level of change in the downstream key event (OECD 2018; Wittwehr et al. 2017). When the quantitative understanding of the key event relationships that make up an AOP is sufficient, AOPs can potentially be used to predict the probability or severity of an apical adverse outcome based on a measurement of one of the key events earlier in the causal sequence (Conolly et al. 2017). This level of development is sometimes referred to as a quantitative AOP (qAOP; Conolly et al. 2017; Villeneuve et al. 2014).
One of the first examples of an AOP for which this level of quantitative understanding has been developed is one linking aromatase inhibition to reproductive impairment in fish, and potentially other oviparous vertebrates (Conolly et al. 2017; Villeneuve 2016; https://aopwiki.org/aops/25; AOP: 25; Figure 1). The molecular initiating event for this AOP is inhibition of the enzyme aromatase (CYP19) which catalyzes the conversion of androgens such as testosterone and androstenedione to the estrogens 17β-estradiol and estrone, respectively (Payne and Hales 2004). Estrogens produced in the ovary circulate to the liver where they can stimulate estrogen receptor-regulated transcription of the egg yolk precursor protein vitellogenin (VTG; Nelson and Habibi 2013). Vitellogenin, released into circulation, is in turn taken up into developing oocytes during the process of oocyte growth and maturation ultimately supporting the development of viable oocytes needed for successful reproduction (Lubzens et al. 2010). Consequently, inhibition of aromatase can lead to decreased production of estrogens, vitellogenin, and impaired oogenesis, ultimately impacting reproductive success (Figure 1).
Figure 1.

Graphical representation of AOP-25 linking aromatase inhibition to reduced cumulative fecundity (https://aopwiki.org/aops/25). Boxes represent key events; arrows indicate key event relationships.
Conolly et al. (2017) used a series of models, aligned with this AOP, to estimate a benchmark dose for apical effects of iprodione, a chemical identified as an aromatase inhibitor in high throughput screening, for which apical data concerning reproductive outcomes were not available. More recently, Doering et al. (2019a, 2019b) proposed and demonstrated that by correcting for species-specific differences in in vitro sensitivity to aromatase inhibition, the quantitative response-response relationships, developed primarily using data from fathead minnow (Pimephales promelas), could be applied for other fish species with an asynchronous mode of oocyte development. Thus, this AOP represents an early example of how qualitative and quantitative understanding, organized using the AOP framework, can be used to translate high throughput screening data to predicted apical effect concentrations that could be used in lower tier risk assessments.
While the potential applicability of this AOP for predicting effects of aromatase inhibitors in other fish species has been examined (Doering et al. 2019a, 2019b), an additional question is how effective the qAOP construct is for predicting effects of a range of different aromatase inhibiting compounds. This is a critical question, as one of the principles of the AOP framework is that AOPs are not chemical specific (Villeneuve et al. 2014). Rather, within their domain of applicability with regard to sex, life stage, and taxa, they are expected to represent the generalized response of biological systems to any stressor that acts through a given molecular initiating event, or on one of the other key events along the AOP, in a similar manner. The quantitative response-response relationships for the aromatase inhibition qAOP construct were largely based on responses to fadrozole, a highly specific, non-steroidal, aromatase inhibitor of limited or no environmental relevance (Conolly et al. 2017; Cheng et al. 2016). It was hypothesized, however, that by expressing the concentration of other aromatase inhibiting chemicals as a function of the concentration of fadrozole that produces the same magnitude of biological effect in a given aromatase assay (i.e., fadrozole equivalents; FAD-EQ), the qAOP construct could be applied to a wide range of other chemicals (Conolly et al. 2017). The primary aim of the present series of studies was to evaluate the hypothesis that the qAOP construct aligned with AOP25 (https://aopwiki.org/aops/25), can successfully be applied to predict in vivo effects of previously untested chemicals.
As a first step toward achieving this aim, the current paper addresses three primary questions. First, we evaluated whether compounds that inhibit aromatase activity in mammalian-based high throughput screening assays also inhibit fathead minnow aromatase in vitro. Second, we examined whether compounds that inhibit fathead minnow aromatase in vitro elicit short-term in vivo responses consistent with progression along AOP 25 (Figure 1; https://aopwiki.org/aops/25). Third, we compared empirical results with model predictions for selected key events and exposure scenarios to evaluate whether expressing other chemicals as FAD-EQ, without adjusting for chemical-specific differences in absorption, distribution, metabolism, and/or elimination, would be adequate for reasonably quantitative prediction of effects over the first several key events in the AOP. Additionally, in previous studies, up-regulation of cyp19a1a and follicle stimulating hormone receptor (fshr) mRNA transcripts has been consistently observed as part of a compensatory response to aromatase inhibition (Villeneuve et al. 2009; Ankley et al. 2009; Villeneuve et al. 2013; Skolness et al. 2013). Consequently, a secondary objective was to evaluate whether these seemingly characteristic compensatory responses generalize to other aromatase inhibitors as well.
MATERIALS AND METHODS
Selection of putative aromatase inhibitors
The U.S. Environmental Protection Agency’s interactive chemical safety for sustainability (iCSS) ToxCast Dashboard (https://actor.epa.gov/dashboard/; initially accessed 04–17-2014) was used to identify chemicals that elicited a positive response in ToxCast assays designed to detect aromatase inhibition; TOX21_Aromatase_Inhibition and NVS_ADME_hCYP19A1 (US EPA CompTox Chemicals Dashboard [1], [2]). In total, 20 chemicals tested and active in both assays were identified (Supplementary Table S.1). Five chemicals were selected for study: letrozole, anastrozole, imazalil, epoxiconazole, and 4-hexylresorcinol. Chemicals were chosen based on several considerations. First, they spanned a range of potencies as indicated by in vitro AC50s (concentration at which 50% of their maximal assay-specific activity was observed), particularly in the TOX21_Aromatase_Inhibition assay. Second, they ranged in specificity, from pharmaceuticals designed explicitly to inhibit aromatase (e.g., letrozole, anastrozole) to pesticides that likely affect multiple steroidogenic enzymes (e.g., imazalil, epoxiconazole) and/or other cytochrome P450s, and even less specifically to a topical ointment/food additive not intended to specifically target cytochrome P450s (e.g., 4-hexylresorcinol). In the case of 4-hexylresorcinol, the aromatase activity observed fell in the same concentration range where a non-specific “burst” of biological activities was observed at concentrations near those shown to be cytotoxic (Judson et al. 2016). Third, there were no previous publications reporting results of exposures of fathead minnows to these chemicals. Finally, logistic factors relevant to fish testing such as availability, cost, adequate water solubility, etc., were considered.
Letrozole (>99% purity) and anastrozole (>99%) were purchased from USP (Rockville, MD, USA). Imazalil (>98.5%) and epoxiconazole (>98.5%) were purchased from LGC Standards (Teddington, UK). The 4-hexylresorcinol (>97.5%) was purchased from Acros Organics (Fair Lawn, NJ, USA).
Stock solutions for use in in vitro assays were prepared directly in methanol and subsequently diluted during assay preparation. Stock solutions for in vivo experiments were prepared by wetting neat chemical in 1 L of filtered water from Lake Superior and sonicating using an ultrasonic bath. Aqueous stocks were diluted up to 18 L with sand filtered and UV treated Lake Superior water (i.e., the same water used in the on-site aquatic culture facility) and stirred for a minimum of 24 h. Stock concentrations were verified prior to beginning toxicant flow, and exposure tank concentrations were verified prior to loading fathead minnows and over the course of each in vivo study.
In vitro aromatase assays
The aromatase assays included in ToxCast employ the human aromatase protein (NVS_ADME_hCYP19A1) or a human cell line (Tox21_Aromatase_Inhibition). Consequently, before examining in vivo responses in the fathead minnow we first wanted to confirm that chemicals identified as aromatase inhibitors in the ToxCast high throughput assays could inhibit fathead minnow aromatase in vitro. Post-mitochondrial supernatants (PMS) of ovary tissue collected from sexually mature female fathead minnows were treated with six concentrations of each chemical. The concentrations varied by chemical (Table 1), but all were tested using 3-fold serial dilutions in triplicate. All in vitro treatments, regardless of test chemical concentration, contained 1% methanol, the carrier used to prepare the stock solutions and each dilution. To account for background and non-specific activity, aliquots of PMS were heat inactivated by immersion in an 80°C water bath for 10 min. A heat inactivated PMS sample was incubated with each concentration of test chemical yielding seven heat inactivated blanks for each chemical tested. In vitro aromatase assays were carried out as described by Villeneuve et al. (2006). Briefly, 5 μl of the appropriate chemical stock was added to 50 μl of PMS or heat inactivated PMS. Reactions were then initiated by adding 150 μl of phosphate buffer containing 160 nM of 1β−3H androstenedione (Perkin Elmer, Waltham, MA, USA; 25.3 Ci/mmol) and 1 mM NADPH. Samples were incubated for 4 h, and aromatase activity was determined based on tritiated water released during the conversion of labeled androstenedione to estrone, using the same extraction and quantification approach described by Ankley et al. (2005). The original six concentrations of letrozole resulted in an incomplete concentration-response curve. Thus, to improve point estimates of effect concentrations, an additional six concentrations (three overlapping the original range) were tested in a second assay (Table 1). Concentrations yielding 50% inhibition (IC50s) were estimated by non-linear regression with a sigmoidal dose-response model in GraphPad Prism 7.04 (GraphPad Software).
Table 1.
Overview of nominal concentrations tested in an in vitro aromatase inhibition assay using control fathead minnow (Pimephales promelas) ovary post-mitochondrial supernatant and in 24 h in vivo exposures of female fathead minnows.
| Test Chemical | In vitro aromatase assay (μM) | 24 h in vivo exposures (μg/L) |
|---|---|---|
| Fadrozole | 0, 0.005, 0.016, 0.048, 0.14, 0.43, 1.28 | N/A |
| Letrozole | Assay 1: 0, 0.44, 1.3, 3.9, 11.8, 35.5, 107 Assay 2b: 0, 0.016, 0.049, 0.15, 0.44, 1.3, 4.0 |
0a, 0.5, 7.5, 25, 75, 250a |
| Anastrozole | 0, 0.45, 1.35, 4.0, 12.1, 36.4, 109 | N/A |
| Imazalil | 0, 0.66, 1.97, 5.9, 17.8, 53.0, 159 | 0, 2.5, 8, 25, 80, 250 |
| Epoxiconazole | 0, 0.43, 1.28, 3.9, 11.6, 34.7, 104 | 0, 8, 25, 80, 250, 800 |
| 4-hexylresorcinol | 0, 0.54, 1.63, 4.9, 14.7, 44.0, 132 | N/A |
Concentrations also tested in 2, 6, and 12 h in vivo exposures, in addition to 24 h.
The original six concentrations of letrozole resulted in an incomplete concentration-response curve. Thus, to improve estimation of an IC50, an additional six concentrations (three overlapping the original range) were tested in a second assay.
Model predictions
A computational model of the fathead minnow brain-pituitary-gonadal-liver axis (Cheng et al. 2016) was used to simulate the effects of a continuous 24 h exposure to letrozole, anastrozole, imazalil, and epoxiconazole. This 12 compartment dynamic mass-balance model employs a system of ordinary differential equations to simulate circulating concentrations of 17β-estradiol (E2), testosterone, and VTG, accounting for empirically observed compensatory feedback behaviors. Because the model was calibrated for fadrozole exposures, toxic equivalency factors (TEFs) were calculated for each chemical by dividing the assay-specific AC50 or IC50 of fadrozole (hydrochloride) by the AC50 or IC50 for the other aromatase inhibitor of interest (Table 2; Equation 1; Supplementary Table S.2; Figures S.1, S.2; using updated AC50 values from https://actor.epa.gov/dashboard/ accessed 05–09-2016). The resulting TEF was then used to calculate a fadrozole concentration expected to produce a biological response equivalent to any given nominal concentration of the target chemical (Table 2; Equation 2). This approach assumes that the chemicals produce parallel slopes and equal efficacy in the assay of interest (Putzrath 1997). Deviations from those assumptions are one source of error in the model predictions.
Table 2.
Estimated 50% inhibitory concentrations for fadrozole and five other aromatase inhibitors based on an in vitro assay with fathead minnow ovary post-mitochondrial supernatant and associated toxicity equivalency factors (Equation 1).
| Test Chemical | IC50 estimate (μM) | TEF |
|---|---|---|
| Fadrozole | 0.073 | 1.0 |
| Letrozole | 0.57 | 0.12 |
| Anastrozole | 0.60 | 0.12 |
| Imazalil | 6.1 | 0.012 |
| Epoxiconazole | 8.9 | 0.008 |
| 4-hexylresorcinol | >130 | <0.0006 |
| Equation 1. |
| Equation 2. |
Prior to the experiments, concentration response data were simulated for six concentrations of each chemical, plus the control condition (0, 0.8, 2.5, 8, 25, 80, 250 μg/L). As a result, the molar concentration of each chemical varied among simulations, as did the FAD-EQ for each chemical. The model was used to generate predicted outputs for two endpoints, plasma concentrations of 17β-estradiol (E2) and plasma concentrations of VTG. These endpoints correspond with key events 219 and 221 in AOP 25 (Figure 1; https://aopwiki.org/events/219; https://aopwiki.org/events/221). Following completion of the in vivo experiments, the models were re-run using the mean measured concentrations of the test chemicals detected in the tank water or in the fish plasma as inputs. Additionally, for letrozole, simulated results at the 2, 6, and 12 h time points were plotted for the 250 μg/L concentration for comparison with time-course data collected for that chemical.
Fathead minnow exposures
To evaluate model predictions 24 h fathead minnow exposures were conducted with three chemicals, letrozole, imazalil, and epoxiconazole. Anastrozole was excluded because its potency, specificity, and properties (e.g., Log P, molecular weight, solubility) were very similar to that of letrozole. Additionally, 4-hexylresorcinol was excluded based on its low potency in the fathead minnow in vitro aromatase assay. Each chemical tested in vivo was delivered in a continuous flow system without the use of carrier solvents. Each experiment included six treatments consisting of a control group and five concentrations of the test chemical, with three replicate tanks per treatment (Table 1). Concentration ranges were based on initial model outputs for the different chemicals. Chemical delivery to each tank was initiated at least 24 h prior to adding fish. To initiate the experiment, tanks were loaded with eight, sexually mature (5–7 m old) female fathead minnows. Loading was staggered by replicate so that fish from all treatments could be sampled within 24 ± 1 h of their initial loading time and fish were not fed during the experiment. At the end of the 24 h exposure period, fish were anesthetized in buffered tricaine methanesulfonate prior to sample collection. Four females per tank were allocated for biological measurements, while the other four females were used for measurement of plasma concentrations of the test chemical. Fish used in all experiments were obtained from an on-site culture unit at the US EPA Great Lakes Toxicology and Ecology Division. Laboratory procedures involving the fish were performed in accordance with the Animal Welfare Act and Interagency Research Animal Committee guidelines (National Research Council, 1996).
For fish allocated for biological measurements, plasma was collected from the caudal vasculature using a microhematocrit tube. Ovaries were removed, weighed, and then divided into three subsamples: one snap frozen in liquid nitrogen and stored at −80°C for RNA extraction; one portion snap frozen and then archived at −80°C; and a final portion transferred to a glass tube containing 500 μl of medium 199 supplemented with 0.1 mM isobutylmethylxanthine (Sigma I7018) and 1 μg/ml 25-hydroxycholesterol (Sigma) for use in an ex vivo steroidogenesis assay (Villeneuve et al. 2009). Liver and brain (including the pituitary gland) tissues were also collected and snap frozen in liquid nitrogen and subsequently stored at −80°C.
For fish allocated for analytical chemistry, plasma was collected from the caudal vasculature in the same manner as for biological measurements. However, the rest of fish was left intact, wrapped in solvent rinsed aluminum foil, and stored frozen at −20°C.
In the case of letrozole, in addition to conducting a 24 h exposure at multiple concentrations, additional fish (n=8 in three replicate tanks per sampling time) were exposed to 250 μg letrozole/L for 2, 6, or 12 h along with a time-matched set of controls, to evaluate time-course responses. Fish from the letrozole time-course experiment were sampled as described for the 24 h exposures, with four fish per tank randomly allocated for biological measurements and the remaining four fish per tank allocated for analytical chemistry.
Exposure verification
Chemical concentrations for in vivo exposures were determined by liquid chromatography-mass spectrometry (LC-MS) using an Agilent 1100 Series LC-MSD. Exposure water was collected directly from tanks prior to loading fish and subsequently at ~8 h and 24 h following exposure start. Analysis methods for each chemical are detailed in supplementary information (Supplementary Information SM.1). Limits of quantification were: letrozole 0.1 μg/L; epoxiconazole 1.0 μg/L; imazalil 0.1 μg/L.
Concentrations of each chemical were also determined in plasma of the fish allocated for analytical chemistry after exposure. Plasma was extracted using Novum solid-liquid extraction cartridges (1 mL; Phenomenex, Torrance, CA). Plasma (volumes ranging 1 – 6 μL/individual fish) was spiked with internal standard, diluted with 0.5 M ammonium hydroxide, loaded onto cartridges and allowed to sorb for 5 min, then eluted with 1.2 mL ethyl acetate. Samples were evaporated to dryness under a gentle stream of nitrogen at 35°C and reconstituted in 100 μL of mobile phase. Chemical analysis was performed on an Agilent 1200 Series 6410 LC-MS (Agilent Technologies, Wilmington, DE). Additional methodological details are provided in supplementary information (Supplementary Information SM.2). Limits of quantification in plasma were: letrozole 1.0 μg/L plasma; epoxiconazole 4.2 μg/L plasma; imazalil 12.5 μg/L plasma.
In vivo key event measurements
Measurements corresponding with up to four key events along AOP 25 were made using samples from the in vivo studies (Figure 1). Impacts on E2 synthesis by ovarian granulosa cells (https://aopwiki.org/events/3; letrozole and epoxiconazole) were measured using an ex vivo steroidogenesis assay (McMaster et al. 1995 adapted as described in Villeneuve et al. 2009). Briefly, ovary subsamples transferred to supplemented medium 199 were incubated for 12 h at 25°C. Following incubation, the tissue subsample was removed, weighed and the medium collected into a microcentrifuge tube and stored frozen at −20°C. Testosterone and 17β-estradiol released into the medium were extracted with diethyl ether and measured by radioimmunoassay (U.S. EPA 2002). While testosterone production is not a key event in the AOP, evaluation of potential impacts on testosterone production could provide insights into whether steroidogenic enzymes upstream of aromatase were impacted by the test chemical.
Impacts on circulating E2 concentrations (https://aopwiki.org/events/219; all chemicals) were also quantified by radioimmunoassay following diethyl ether extraction of the plasma (U.S. EPA 2002). Hepatic vtg mRNA expression, as determined by real-time quantitative polymerase chain reaction (qPCR; detailed below) was used as an indicator of VTG synthesis in liver tissue (https://aopwiki.org/events/285; all chemicals). Finally, changes in plasma VTG concentrations (https://aopwiki.org/events/221; letrozole and epoxiconazole only) were evaluated by enzyme linked immunosorbent assay using a polyclonal antibody to fathead minnow VTG (U.S. EPA, 2002).
Gene expression measurements
Relative abundance of mRNA transcripts coding for cytochrome P450 (CYP) side chain cleavage (cyp11a), 17α-hydroxylase/17,20 lyase (cyp17), aromatase A (cyp19a1a), and follicle stimulating hormone receptor (fshr) in ovary tissue and vtg, cyp3a, and cyp1a1 in liver tissue were quantified using Taqman RNA to CT 1-step kits (Applied Biosystems, Foster City, CA, USA). Vitellogenin mRNA was measured as a proxy for VTG synthesis in liver since impacts on VTG protein production often take greater than 24 h to manifest (Villeneuve et al. 2009; 2013). Expression of cyp11a, cyp17, cyp19a1a, and fhsr mRNAs were of interest relative to previously observed compensatory upregulation after exposures to aromatase inhibitors and/or other inhibitors of steroidogenesis (e.g. Villeneuve et al. 2009; Ankley et al. 2009; Ankley et al. 2012). Finally, cyp3a and cyp1a1 mRNAs were examined because they can both be induced and the activities of their associated proteins inhibited by a number of fungicide compounds (e.g., azoles like imazalil and epoxiconazole; https://comptox.epa.gov/dashboard) and may play a role in endogenous biotransformation of the test chemicals and/or endogenous steroids (Niwa et al. 2015).
Total RNA was extracted from ovary and liver samples using Qiagen RNeasy Plus mini kits (Qiagen, Valencia, CA, USA). Concentration and purity of total RNA samples were evaluated using a Nanodrop ND-1000 spectrophotometer (Nanodrop Technologies, Wilmington, DE, USA). Samples were diluted to 10 ng total RNA/μl for use in qPCR assays. Each 20 μl reaction contained 20 ng total RNA template, 300 nM of the appropriate gene-specific forward and reverse primers and 150 nM of the appropriate gene-specific probe labeled with a FAM reporter and 3’-Black Hole Quencher 1 (Integrated DNA Technologies; Coralville, IA, USA; Supplementary Table S.3). Samples were reverse transcribed at 48.0°C for 15 min and held at 95°C for 10 min, followed by 40 cycles of PCR amplification (denature at 95°C for 15 sec; anneal/extend at 60°C for 60 sec) using a 7500 Real-Time PCR system (Applied Biosystems). Transcript abundance was estimated from interpolation against a standard curve consisting of six dilutions of a gene-specific mRNA standard curve. Each plate also included a no-template control, reference samples for evaluation of interassay variability, and duplicate samples for evaluation of intraassay variability. Additional details regarding primer design as well as generation of mRNA standards using high yield in vitro transcription were reported previously (Ankley et al. 2007; Villeneuve et al. 2007).
Statistics
The IC50 values in the in vitro aromatase assay were initially calculated for fadrozole based on log inhibitor concentration versus aromatase activity fit using a four parameter Hill function (GraphPad Prism 7.04; Supplementary Figure S.1). For the previously untested chemicals, aromatase activity was normalized to the maximum basal activity for the pooled PMS used for each assay (100%). Interpolation against a sigmoidal fit (GraphPad Prism 7.04) of the data expressed as % of control aromatase activity was used to calculate the concentration corresponding to a 50% reduction in activity (Supplementary Figure S.2). Point estimates were used to calculate TEFs (Equation 1) and FAD-EQ concentrations (Equation 2) for input into the computational model (Cheng et al. 2016; Conolly et al. 2017).
In vivo data were evaluated for normality using a Kolmogorov-Smirnov test and homogeneity of variance using Levene’s test (Statistica 13). Data or log-transformed data meeting the assumptions of parametric statistics were evaluated by one-way ANOVA followed by Duncan’s multiple range test to determine statistically significant (p<0.05) differences across the concentrations tested. For the letrozole experiment, time-course data were evaluated by t-tests comparing time-matched controls with the responses in the 250 μg letrozole/L treatment. For the few data that were not normally distributed even after log transformation, a non-parametric Kruskal-Wallis test was employed.
RESULTS
In vitro aromatase inhibition
Four of the five chemicals identified as putative aromatase inhibitors based on their activity in mammalian-based ToxCast high throughput screening assays also inhibited aromatase activity in fathead minnow ovary PMS (Table 2; Supplementary Figures S.1, S.2). Letrozole and anastrozole had similar potency but were about 10-fold less potent than fadrozole. Imazalil and epoxiconazole were about 100-fold less potent than fadrozole. The least potent was 4-hexylresorcinol, which did not inhibit fathead minnow ovary PMS, even at concentrations up to 130 μM.
In vivo effects of letrozole
Measured concentrations of letrozole in water collected from exposure tanks were slightly above nominal over the course of the exposures but there was clear separation of test concentrations across the treatment groups (Supplementary Figure S.3). Letrozole concentrations in the plasma of exposed fish were generally around 20% of the measured water concentrations (Table 3) and showed concentration and time-dependent increases (Supplementary Figure S.4). Letrozole was not detected in control exposure water (<0.1 μg/L) or plasma from control fish (<1.0 μg/L).
Table 3.
Ratio of measured plasma concentration: measured water concentration for each chemical tested in vivo. Sample sizes n=12 except where indicated by footnote.
| Letrozole nominal water conc. (μg/L) | Letrozole plasma:water ratio Mean ± SD | Epoxiconazole nominal water conc. (μg/L) | Epoxiconazole plasma:water ratio Mean ± SD | Imazalil measured water conc. (μg/L) | Imazalil plasma:water ratio Mean ± SD |
|---|---|---|---|---|---|
| 7.5 | 0.21 ± 0.08 | 8 | 67 ± 17 | 3.3c | 12 ± 2.9 |
| 25 | 0.21 ± 0.10 | 25 | 57 ± 19 | 12.4d | 16 ± 3.2 |
| 75 | 0.18 ± 0.10 | 80 | 54 ± 24 | 28e | 18 ± 6.0 |
| 250 (2 h) | 0.13 ± 0.04 | 250 | 52 ± 23 | 61 | 18 ± 4.9 |
| 250 (6 h) | 0.16 ± 0.04 | 800b | 34 ± 10 | 275 | 25 ± 6.3 |
| 250 (12 h) | 0.21 ± 0.09 | ||||
| 250 (24 h)a | 0.18 ± 0.06 | ||||
n=11
n=10
n=9
n=8
n=15
The 24 h exposure to letrozole impacted multiple key events aligned with the aromatase inhibition AOP (Figure 2A–H). Exposure to 250 μg/L for 2 and 12 h significantly reduced ex vivo E2 production (Figure 2B). However, at 24 h, none of the letrozole concentrations tested showed a significant effect on ex vivo E2 production (Figure 2A). In contrast, at 24 h plasma E2 concentrations were reduced at all concentrations of letrozole tested (Figure 2C). In fish exposed to 250 μg letrozole/L, reduced plasma E2 could be detected in as little as 2 h and remained significantly decreased across the rest of the time-course (Figure 2D). Synthesis of VTG as indicated by hepatic expression of vtg mRNA was significantly reduced at nearly all concentrations tested (Figure 2E), but in fish exposed to 250 μg letrozole/L the effect was not detectable until 24 h (Figure 2F). Plasma concentrations of VTG protein were not significantly reduced in any treatment at 24 h (Figure 2G) but were decreased in fish exposed to 250 μg/L for 12 h (Figure 2H). Exposure to letrozole had no effect on ex vivo testosterone production (Supplementary Figure S.5).
Figure 2.
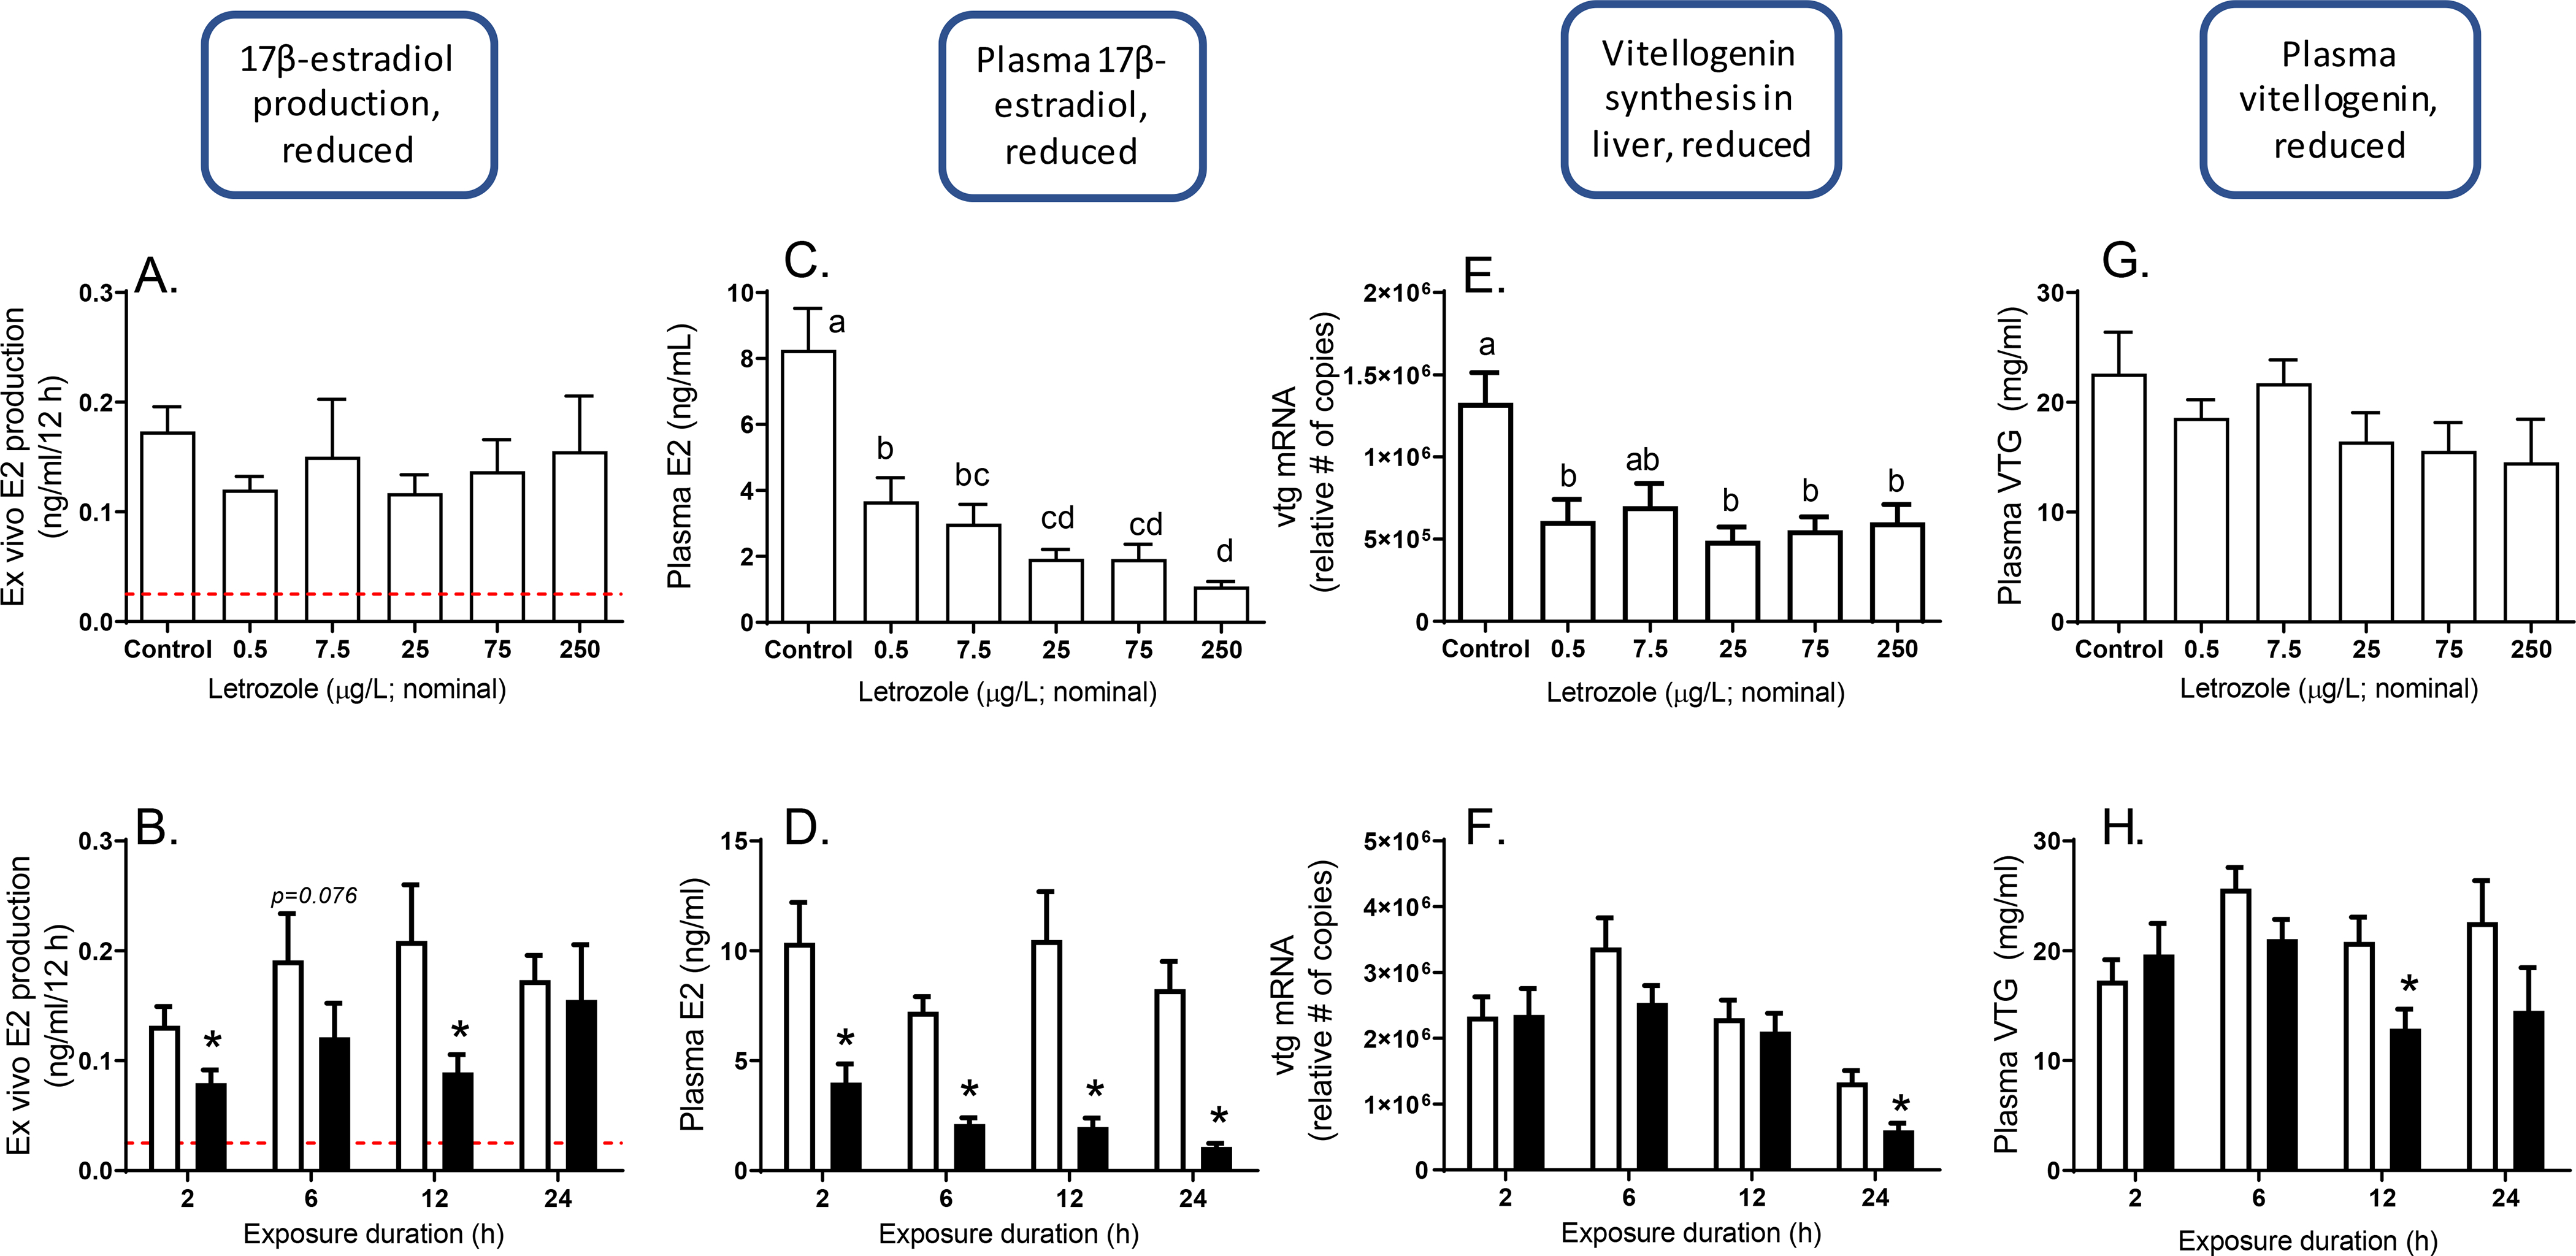
Ex vivo production of 17β-estradiol (E2), plasma concentrations of E2, hepatic expression of vitellogenin (vtg) mRNA, and plasma concentrations of vitellogenin protein (VTG), measured in samples collected from female fathead minnows following 24 h of exposure to letrozole (top plots) or 2, 6, 12, or 24 h of exposure to letrozole (bottom plots; control [white bars] and 250 μg/L [black bars] only). For 24 h concentration-response plots (top), different letters indicate p<0.05 based on one-way ANOVA followed by Duncan’s post hoc test. For time course plots (bottom) asterisks indicate a significant difference between control and treated (250 μg/L) groups within each time point (p<0.05; t-test). Error bars = standard error. Samples sizes n=12 for ex vivo E2; n=11–12 for plasma E2; n=12 for hepatic vtg mRNA, and n=10–12 for plasma vtg. Dashed line indicates E2 concentrations detected in blanks (no tissue).
The relative abundance of cyp19a1a mRNA transcripts in the ovary was significantly increased in fish exposed to 250 μg letrozole/L for 6 or 24 h (Figure 3B) and there was an apparent concentration-dependent increase in expression, although it was only significantly greater than expression in the controls at 250 ug/L (Figure 3A). Following 24 h of exposure to letrozole, the abundance of fshr mRNA transcripts was increased by nearly all concentrations tested (Figure 3C). Exposure to 250 μg letrozole/L for 24 h also increased expression of cyp11a and cyp17 (Supplementary Figures S.6B, D), but there was not a clear concentration-dependence in the effect (Supplementary Figures S.6A, C). Hepatic expression of cyp1a1 and cyp3a mRNAs were increased by the letrozole exposure, although not in a clearly concentration-dependent fashion (Supplementary Figure S.6E, G). Exposure to 250 μg letrozole /L induced cyp1a1 mRNA. This was one of the earliest responses, showing a significant increase within 6 h and remaining elevated through 24 h (Supplementary Figure S.6F). In contrast, significant induction of cyp3a mRNA was not detected until 24 h of exposure (Supplementary Figure S.6H).
Figure 3.

Relative abundance of mRNA transcripts coding for aromatase (cyp19a1a) or follicle stimulating hormone receptor (fshr) detected in ovary tissue collected from female fathead minnows exposed to letrozole for 24 h (top plots) or 2, 6, 12, or 24 h (bottom plots; control [white bars] and 250 μg/L [black bars] only). For 24 h concentration-response plots (top), different letters indicate p<0.05 based on one-way ANOVA followed by Duncan’s post hoc test. For time course plots (bottom) asterisks indicate a significant difference between control and treated groups within each time point (p<0.05; t-test). Error bars = standard error. Sample sizes n=10–12.
In vivo effects of epoxiconazole
Measured water concentrations of epoxiconazole did not differ markedly from nominal over the course of the exposure, and epoxiconazole concentrations in control tanks were below the detection limit (1 μg/L; Supplementary Figure S.7). Plasma concentrations of epoxiconazole increased as a function of water concentration (Supplementary Figure S.8). However, in contrast to letrozole in which plasma concentrations were significantly less than water concentrations, epoxiconazole plasma concentrations exceeded water concentrations by a factor of 30- to nearly 70-fold (Table 3). For reference, epoxiconazole has a log Kow around 3.4 and estimated bioconcentration factor of 145 compared to log Kow of 2.1 and bioconcentration factor of 26.4 for letrozole (US EPA CompTox Chemicals Dashboard [5], [6]).
Plasma concentrations of epoxiconazole in most control fish were below the detection limit of 4.2 μg/L, however there were four controls, from two different replicate tanks, with plasma epoxiconazole concentrations in the range of 32–148 μg/L. Considering the plasma:water concentration ratios (Table 3), it is plausible that epoxiconazole water concentrations < 1.0 μg/L could still yield detectable plasma epoxiconazole concentrations in some individuals. However, given that some individuals had detectable plasma concentrations while others did not, and the fact that different fish were used for chemical and biological analyses, there was not a sound basis to exclude individuals from the biological analyses. Thus, based on evidence that water concentrations were below the detection limit and neither the plasma nor water concentrations overlapped those of the lowest treatment group (Supplementary Figures S.7, S.8), we chose to proceed with the analyses without any modifications to the control group composition. That said, biological results nonetheless should be considered in light of the possibility that the control group may have been inadvertently exposed to a low level of epoxiconazole.
Exposure to epoxiconazole impacted three of the four key events evaluated for AOP 25 (Figure 4). Ex vivo E2 production was significantly reduced at 250 μg epoxiconazole/L or greater (Figure 4A) while plasma E2 concentrations were impacted at concentrations greater than or equal to 80 μg/L (Figure 4B). Hepatic vtg mRNA expression was also impacted in a manner consistent with the AOP (Figure 4C) but was effected at all concentrations tested, although reductions in circulating E2 were only significant at higher epoxiconazole concentrations. Plasma VTG was not significantly altered by 24 h of in vivo exposure in any treatment group (Figure 4D).
Figure 4.

Ex vivo production of 17β-estradiol (E2), plasma concentrations of E2, hepatic expression of vitellogenin (vtg) mRNA, and plasma concentrations of VTG protein, measured in samples collected from female fathead minnows following 24 h of exposure to epoxiconazole. Different letters indicate p<0.05 based on one-way ANOVA followed by Duncan’s post hoc test. Error bars = standard error. Samples sizes n=12 for ex vivo E2; n=10–12 for plasma E2; n=12 for hepatic vtg mRNA, and n=11–12 for plasma VTG. Dashed line indicates E2 concentrations detected in blanks (no tissue).
Beyond the key events, epoxiconazole had no significant effect on ex vivo testosterone production (Supplementary Figure S.9). In contrast to letrozole, there was no evidence of a compensatory up-regulation of cyp19a1a or fshr mRNA following exposure to epoxiconazole (Figure 5), nor were there effects on the expression of cyp11a or cyp17 mRNAs (Supplementary Figure S.10). In hepatic tissue epoxiconazole stimulated expression of mRNAs coding for hepatic CYPs, with cyp1a1 transcription significantly induced at concentrations of 25 μg epoxiconazole/L and greater, and cyp3a transcription was induced at the highest test concentration (Supplementary Figure S.10).
Figure 5.

Relative abundance of mRNA transcripts coding for aromatase (cyp19a1a) or follicle stimulating hormone receptor (fshr) detected in ovary tissue collected from female fathead minnows exposed to epoxiconazole for 24 h. Different letters indicate p<0.05 based on one-way ANOVA followed by Duncan’s post hoc test. Error bars = standard error. Sample sizes n=11–12.
In vivo effects of imazalil
During the24 h in vivo imazalil exposure there were technical issues associated with stock delivery to the test tanks that resulted in deviations from the targeted nominal concentration and the relevant distributions of sample size within each treatment. Specifically, 0.52 μg imazalil/L was detected in the third replicate of the control tanks (Figure 6). Additionally, the third replicate tank in the 8 μg/L nominal treatment group received a concentration more consistent with the 25 μg/L nominal treatment. Given these two issues, samples were regrouped based on measured water concentrations to more accurately evaluate treatment effects. Control replicate three was treated as an independent group with a sample size of n=4, leaving n=8 from two replicate tanks as unexposed controls. Replicate 3 from the 8 μg/L nominal treatment was regrouped with the 25 μg/L nominal treatment, leaving a sample size of n=8, with two replicate tanks, for the 8 μg/L nominal treatment group and n=16, four replicate tanks, for the 25 μg/L nominal group (Figure 6A). Measured plasma concentrations of imazalil were consistent with the water concentration results, with fish from replicate three of the 8 μg/L nominal treatment having plasma imazalil concentrations closer to those found in the 25 μg/L nominal treatment group (Figure 6B). In the case of control replicate 3, concentrations of imazalil in the plasma of fish from that tank were less than the 12.5 μg/L limit of quantification, but a small detected peak indicated that internal exposure occurred, supporting the decision to consider control replicate 3 as a separate group in the analysis. Overall, plasma concentrations of imazalil exceeded water concentrations by a factor of 12–25 following 24 h of exposure (Table 3). For reference, the log Kow of imazalil is around 3.9 with a predicted bioconcentration factor around 220 (US EPA CompTox Chemicals Dashboard [7]).
Figure 6.

Measured concentrations of imazalil in tank water (A) and plasma collected from female fathead minnows exposed for 24 h (B). (A) Mean ± SD of three tanks; 4 measurements per tank over the course of the exposures. (B) Mean ± SD. Sample sizes within each nominal treatment group: control (n=11); 2.5 (n=9); 8 (n=12); 25 (n=11); 80 (n=12); 250 (n=12). Numbers above each group of columns represents the mean ± SD for the treatment group, across all replicate tanks (A) or replicate fish (B). Limits of quantification: Water 0.1 μg/L. Plasma 12.5 μg/L.
We were able to evaluate effects of imazalil on three key events in AOP 25. Consistent with the AOP, exposure to imazalil yielded a significant reduction in plasma E2 concentrations (Figure 7A). However, the effect on vtg mRNA abundance was more ambiguous with a significant increase for the four fish from control replicate 3 and a statistically significant decrease at 61 μg imazalil/L. Effects observed at the other concentrations of imazalil were not statistically different from the controls (Figure 7B). However, due to the dosing issues, the lesser number of replicates in the control group yielded less power to detect statistical differences than in the letrozole or epoxiconazole experiments. Once again, a significant effect on plasma VTG was not detected in the 24 h exposure.
Figure 7.

Plasma concentrations of 17β-estradiol (E2), hepatic expression of vitellogenin (vtg) mRNA, and plasma concentrations of vitellogenin protein (VTG) measured in samples collected from female fathead minnows following 24 h of exposure to imazalil. Due to deviations from nominal concentrations in certain treatment tanks, samples were grouped by measured imazalil concentrations in the tank water. Different letters indicate p<0.05 based on one-way ANOVA followed by Duncan’s post hoc test. Error bars = standard error. Sample sizes within each group (Plasma E2, vtg mRNA, plasma VTG): control (7, 8, 8); 0.52 (3, 4, 3); 3.3 (11, 12, 12), 12.4 (5, 8, 8), 28 (12, 15, 13), 61 (12, 11, 10), 275 (11, 12, 9).
Exposure to imazalil had relatively little impact on endpoints that were not key events in AOP 25. No significant effects on cyp19a1a, fshr, cyp11a, or cyp17 mRNA abundance in ovary were detected (Figure 8, Supplementary Figure S.11A, B). There was some induction of hepatic cyp1a1 mRNA, but only at the highest concentration tested (275 μg/L; Supplementary Figure S.11C). However, in contrast with the other two chemicals, exposure to imazalil resulted in decreased expression of cyp3a mRNA in several of the treatment groups, although the effect did not show clear dose dependence (Supplementary Figure S.11D). Once again, we note the uneven sample sizes associated with regrouping of replicates for the analysis.
Figure 8.

Relative abundance of mRNA transcripts coding for aromatase (cyp19a1a) or follicle stimulating hormone receptor (fshr) detected in ovary tissue collected from female fathead minnows exposed to imazalil for 24 h. Due to deviations from nominal concentrations in certain treatment tanks, samples were grouped by measured imazalil concentrations in the tank water. There were no significant differences among treatments based on one-way ANOVA followed by Duncan’s post hoc test. Error bars = standard error. Sample sizes within each group: control (8), 0.52 (4); 3.3 (11), 12.4 (8), 28 (14), 61 (11), 275 (12).
Evaluation of model predictions
To evaluate the utility of the qAOP for predicting short-term concentration-response and/or time-course behaviors for previously untested chemicals, a set of model predictions were generated using measured water and plasma concentrations of the three chemicals tested in vivo. Generally, the distributions of measured plasma E2 and plasma VTG data overlapped the average basal levels used for model parameterization, which were derived from a long-term average of concentrations measured in many studies conducted with control adult fathead minnows (Watanabe et al. 2007; Supplementary Figure S.12). One notable exception was the plasma E2 concentrations measured in the epoxiconazole experiment. For epoxiconazole the average concentration measured in controls was nearly 10-fold lower than the historical average. However, a detailed data quality evaluation revealed no technical or calculation errors that explained the deviation from historical population means, so the data were retained.
The deterministic qAOP model predictions based on measured water concentrations of letrozole generally fell within the standard error of the mean of the measured population for either the concentration-response or time-course. An exception was for plasma VTG in the concentration-response experiment where the water concentration-based model slightly overestimated the impact on VTG (Figure 9B). Adjusting model inputs to letrozole concentrations measured in fish plasma did not improve concordance with the empirical results (Figure 9A, C).
Figure 9.

Comparison of measured concentrations (closed circles) of plasma 17β-estradiol (E2; left column) or vitellogenin (VTG; right column) versus model predicted concentrations. Modeled concentrations were estimated based on either measured water concentrations (open squares) or measured plasma concentrations (open triangles) of the test chemical as input parameters. A-D results for letrozole exposures. A and B depict the 24 concentration-response data for plasma E2 and VTG, respectively. C and D depict the time-course data for 250 μg letrozole/L treatments. E and F depict the concentration-response for 24 h exposures to epoxiconazole. G and H depict the concentration-response for 24 h exposures to imazalil. Error bars = SEM. The deterministic model results provide a single value, thus no error bars are shown for modeled data.
For epoxiconazole and imazalil, the model predictions underestimated the impact on plasma E2 concentrations. This might be expected for the model predictions based on water concentrations, given that plasma concentrations of both epoxiconazole and imazalil exceeded those in water by a factor of 12–67. However, even the model results based on measured plasma concentrations underpredicted the effects, albeit to a lesser degree. For epoxiconazole, the lower basal E2 concentrations measured in the sample population likely contributed to the absolute deviation between the deterministic model predictions and the empirical results. For plasma VTG, the deviation was opposite of model results based on measured plasma concentrations of imazalil over-estimating the impact of 24 h of exposure on plasma VTG (Figure 9F, H). In the case of epoxiconazole, the relative lack of significant effect on plasma VTG was predicted by the model based on measured water concentrations. However, for imazalil, both model outputs predicted a concentration dependent decrease in plasma VTG, which was not observed empirically.
DISCUSSION
The overall aim of the present study was to provide additional insights regarding the ability of a qAOP construct linking aromatase inhibition to reproductive impairment (https://aopwiki.org/aops/25; Conolly et al. 2017), to predict in vivo effects of untested aromatase inhibitors identified by in vitro screening assays. Application of the qAOP for chemicals other than the reference chemical used to develop and calibrate the original model (fadrozole) is critical if a predictive approach to concentration-response characterization in a chemical risk assessment is to be broadly useful. Thus, it is important to test this assumption.
Agreement among in vitro relative potency estimates
To evaluate veracity of the model, we first assessed whether aromatase inhibitors identified in mammalian high throughput assays were relevant for identifying chemicals that can inhibit fish aromatase. Qualitatively, there was good agreement between the fathead minnow in vitro aromatase assay and the two ToxCast assays evaluated. The two pharmaceutical aromatase inhibitors (letrozole and anastrozole) had the lowest IC50s, followed by the two fungicides that target cytochrome P450s (imazalil and epoxiconazole), but not aromatase specifically (Supplementary Table S.2). The food additive (4-hexylresorcinol) that only showed in vitro activity in the non-specific range of ToxCast responses was the only compound producing no effect on fathead minnow aromatase activity. Thus, from a qualitative standpoint, the order of potencies was quite consistent between mammalian and fish assays.
At a quantitative level, there were significant differences in the relative potencies (compared to the reference chemical fadrozole) among the three assays (Supplementary Table S.2). For example, comparing letrozole and fadrozole, the ToxCast Novascreen assay (NVS_ADME_hCYP19a1) identifies letrozole as being nearly 80 times more potent than fadrozole. The Tox21_Aromatase inhibition assay results suggest letrozole was approximately equipotent to fadrozole, while the fathead minnow assay suggested letrozole was about 10-fold less potent than fadrozole. While the differences in relative potency estimates were less dramatic for the other three active chemicals, in all cases estimated relative potency based on one of the three assays differed from that of the other two by around a factor of 10. For the present study, we assumed that the relative potencies derived from the fathead minnow in vitro aromatase assay would be most suitable for the model evaluation, but it is clear that uncertainty in the initial relative potency estimates can be a substantial source of error in the predictions.
To illustrate this, model predictions were generated for the letrozole 24 h concentration-response experiment using the mean measured water concentrations of letrozole (Supplementary Figure S.13) as inputs to the model, and the relative potencies based on the three different in vitro assays were applied as the potency adjustment (Supplementary Table S.2; Equation 2). The source of the relative potency estimate had a very noticeable influence on how well the model predictions aligned with the measured mean and standard errors (Supplementary Figure S.13). Thus, when there is substantial uncertainty in the relative potency of the chemical, or which assay most accurately represents that relative potency, other sources of model error may be rather trivial compared to the uncertainty in the relative potency of the chemical itself.
Concordance of test results with AOP25 (https://aopwiki.org/aops/25)
Key events in an AOP are expected to be causally related such that the “upstream” events cause the “downstream” events in the sequence to occur. Consequently, empirical support for an AOP is evaluated in terms of evidence that support a causal relationship between key events (Becker et al. 2015). In the context of concentration-response and time course, the expected pattern is that upstream key events will be impacted at concentrations equal to or lower, and time points earlier, than those that affect the downstream key events. In principle, deviations from these expected patterns could suggest either inaccuracy in the relationships depicted or potential influences of additional mechanisms not captured in a given AOP. However, in practice technical factors such as the relative sensitivity and precision of the measurement methods, magnitude of interindividual variability, and associated differences in statistical power can confound evaluation of concordance. Thus, it is generally important to consider such technical factors and the overall trends across many experiments in evaluating support for an AOP from a weight-of-evidence perspective (Becker et al. 2015)
Overall, the results of 24 h exposures to three in vitro aromatase inhibitors that had not been previously tested in fathead minnows were broadly concordant with AOP 25. Concentrations of letrozole required to reduce circulating E2 concentrations were equal to or less than those required to impact the downstream event of reduced VTG synthesis (Figure 2C, E). In terms of temporal concordance, the upstream key events of reduced E2 production and reduced plasma E2 concentrations were impacted within just 2 h of exposure (Figure 2B, D), while impacts on vitellogenin transcription or plasma concentrations weren’t detected until at least 12 h of exposure (Figure 2F, H). Ex vivo E2 production results deviated from concentration-response concordance, with no significant effects being observed at any concentration (Figure 2A). However, the ex vivo steroid production assay, which involves incubation of the ovary tissue for 12 h after removal from the animal and associated blood circulation, relies on persistence of the chemical in the tissue. The fact that plasma concentrations of letrozole were less than water concentrations (Table 3) suggests rapid biotransformation or even active removal. Thus, it is plausible that concentrations in the excised ovary tissue were substantially lower than the actual in vivo concentrations during continuous flow-through exposure, which may explain the discrepancy. It is also notable that in the 250 μg letrozole/L time course, cyp19a1a mRNA transcripts were significantly up-regulated after 6 and 24 h of exposure (Figure 3B) and that these were the two time-points at which a significant impact of 250 μg letrozole/L was not detected (Figure 2B). This suggests that rapid compensatory up-regulation of aromatase expression in the tissue may also contribute to an observed lack of effects on E2 synthesis measured after 24 h of exposure. In another 24 h time-course experiment with the aromatase inhibitor prochloraz, Skolness et al. (2011) observed significant effects on ex vivo E2 production after 6 and 12 h of exposure, but not 24 h, while compensatory up-regulation of cyp19a1a was detected at all time-points and greatest in terms of fold-change at 24 h. Consequently, results for letrozole provide qualitative support for the AOP (Figure 1).
Evidence for a causal relationship between the key events outlined for the AOP (Figure 1) was not as compelling for epoxiconazole. Three of the key events measured were impacted by exposure to the chemical for 24 h (Figure 4A–C). However, an effect on VTG synthesis, as reflected by mRNA abundance was detected at 8 μg/L, while exposure to 80 μg/L of the pesticide was required to produce a significant change in plasma E2, and 250 μg/L was needed to significantly reduce ex vivo E2 production. Some of this lack of concentration-response concordance may be due to simple differences in the statistical power and sensitivity to detect the specific endpoint responses. However, epoxiconazole did not induce compensatory up-regulation of either cyp19a1a or fshr transcripts (Figure 5) observed for fadrozole and letrozole (Villeneuve et al. 2009; Supplementary Figure S.6). Epoxiconazole did cause a strong concentration-dependent induction of hepatic cyp1a1, which codes for a cytochrome P450 isozyme that can metabolize steroids like E2 (Niwa et al. 2015) (Supplementary Figure S.10). Thus, it is possible that epoxiconazole is impacting key events included in AOP25, but perhaps through a somewhat different, or more complex, causal chain than that outlined in the AOP. That is, aromatase may not be the molecular target most sensitive to epoxiconazole exposure. Both inhibition of several cyp2 isoforms and impacts on progesterone, and hydroxypregnenolone production in H259R cells were detected at epoxiconazole concentrations about 10-fold lower than those that impacted aromatase activity (based on relative AC50s; US EPA CompTox Chemicals Dashboard [3]). Furthermore, both cyp1a and cyp3a isoforms can metabolize steroid hormones including E2 (Niwa et al. 2015). Thus, it is possible that epoxiconazole’s effects on circulating E2 concentrations may result from increased metabolism of endogenous E2 and/or effects on other steroidogenic enzymes upstream of aromatase. At the very least, its mode of action is more pleiotropic than that of letrozole, suggesting AOP25 alone may provide an incomplete representation of relevant in vivo effects leading to decreased E2 and VTG for this chemical.
Imazalil reduced plasma E2 at the same concentrations that vtg mRNA abundance was significantly decreased (Figure 7). Consequently, the results were concordant with the proposed causal sequence for the AOP (Figure 1). Similar to epoxiconazole, imazalil’s effect on aromatase activity was not its most potent activity in the suite of ToxCast assays (US EPA Comptox Chemicals Dashboard [4]). Effects on multiple cyp2 isoforms and protein tyrosine phosphatase were observed at concentrations almost two orders of magnitude lower than those that impacted in vitro aromatase activity. Likewise, the H295R cell-based steroidogenesis assay (Karmaus et al. 2016) showed impacts on the production of multiple steroid intermediates upstream of both the action of aromatase and the production of E2. The potential for multiple mode(s) of action may explain why, once again, the compensatory up-regulation of cyp19a1a and fshr mRNA so commonly observed in fish exposed to selective aromatase inhibitors like fadrozole (Villeneuve et al. 2006; Villeneuve et al. 2009; Villeneuve et al. 2013; Schroeder et al. 2017) was not observed for imazalil.
Across the three in vivo experiments, effects on the most downstream key event of decreased plasma VTG concentrations was not observed. This does not indicate a lack of concordance with the AOP. Rather, the 24 h exposure duration was likely insufficient to detect effects on this key event. This is supported by a follow up investigation in which a 60 h exposure to imazalil was shown to elicit a concentration-dependent decrease in plasma VTG (unpublished data to be reported elsewhere). Collectively, the data for the three chemicals suggests that the causal sequence of events outlined in the AOP is likely accurate. However, at least in the case of epoxiconazole and, possibly imazalil, additional modes of action are likely influencing the measured outcomes leading to some deviations from the patterns of response observed for chemicals designed to be specific for aromatase. An AOP network that includes impacts related to other impacted protein targets may be needed for more accurate prediction for the less specifically-acting chemicals.
Concordance of empirical results with model predictions
Given the likelihood that at least two of the three chemicals tested in vivo were likely impacting molecular targets in addition to aromatase at the concentrations tested, there is reason to suspect that a qAOP model developed using data for a highly selective aromatase inhibitor (fadrozole) may not perform well for all chemicals identified as potential aromatase inhibitors. Indeed, the model predictions for letrozole, a targeted drug similar to fadrozole, performed better than those for epoxiconazole or imazalil (Figure 9). In the case of imazalil and epoxiconazole, adjusting for in vivo toxicokinetics by using measured plasma concentrations as an input, improved model predictions compared to those using water concentrations (Figure 9E, G). The predictions for the plasma VTG key event were not improved (Figure 9F, H), but this likely reflects a temporal inaccuracy in the modeled lag between the effects on plasma E2 and those on plasma VTG rather than an issue with the input dose. The results suggest that although the AOP itself, and the qAOP developed around it, are not specific to a given chemical (Villeneuve et al. 2014), the chemical-specific properties that influence the effective dose at the target tissue need to be considered. Failure to do so will likely result in greater inaccuracies in the modeled outcomes.
For comparative purposes, the deterministic model results were compared against the mean and standard error of the measured data. However, in considering the overall utility and accuracy of the qAOP models, it is also important to consider variability in the measured data. The outputs of the current deterministic model yield discrete values that are reflective of the mean of a sampled population over many studies (i.e., a large sample size). However, the measured data from a given single experiment are comparatively variable and noisy. For example, among controls for the current set of studies, plasma E2 concentrations varied by up to an order of magnitude (Supplementary Figure S.12A), while plasma VTG concentrations in controls varied by around factor of five (Supplementary Figure S.12B). Statistical hypothesis testing was used to determine significant effects across treatments. However, ideally one would fit a regression line to the concentration response data for each endpoint to compare empirically derived against model predicted benchmark doses. However, goodness of fit for regression models based on the in vivo plasma E2 and VTG concentrations were quite low, resulting in EC50 estimates that were unbounded given the substantial level of uncertainty. In effect, while consideration of standard errors suggest the models did not accurately predict the mean behavior of the sample population of exposed fish, if the full range of data points within the sample population were considered, all modeled results fall in the empirical range observed among individuals. Thus, despite the apparent error observed, all the model predictions generated fell within a biologically-realistic range of response.
Prospects for the qAOP
Overall, AOP 25 and its derived qAOP provided a biologically reasonable prediction of the impacts of three aromatase inhibitors that had not been previously tested in the fathead minnow. Qualitatively, all the expected key events were observed. While some deviation from concentration-response concordance among upstream to downstream events was observed, the overall patterns across the three studies broadly supported the causal sequence of events depicted in the AOP. Adjusting the model inputs for chemical toxicokinetics by using measured plasma concentrations improved model fit for the two chemicals (epoxiconazole and imazalil) that showed bioaccumulation, but not for the chemical with plasma concentrations less than water concentrations (letrozole). Nonetheless, adjusting for differences in potential uptake or bioaccumulation relative to fadrozole, whenever the qAOP construct is applied to a new compound appears prudent. Similarly, work by Doering et al. (2019a; 2019b) showed that adjustment for differences in species sensitivity can also improve accuracy when applying the qAOP construct to predict effects across different fish species. Even with those adjustments, uncertainty can still be expected. The qAOP construct could not flawlessly predict the outcomes for all chemicals, endpoints, concentrations, and/or time-points tested. However, the differences between the predicted and empirical results appear just as likely to be driven by error in the measured relative potencies and/or variability in the measured key events among individuals as from error in the model construct. As with most models, the appropriate application for this qAOP construct is to provide a reasonable hypothesis/estimate when empirical results are unavailable and/or not feasible to generate. However, when applied in that context, it appears that the AOP and qAOP constructs can reasonably predict salient aspects of biological response to previously untested chemicals at both a qualitative, and at least semi-quantitative level. Thus, we feel that the qAOP will be useful for a variety of applications including risk-based screening and prioritization and integrated approaches to testing and assessment in which qAOP-based hypothesis generation can inform design of confirmatory testing that may be required to support decision-making.
Supplementary Material
Acknowledgement:
The authors thank Anthony Schroeder and Rory Conolly for additional technical support and input and Tammy Stoker and Lidia Ceriani for critical feedback on the manuscript. This research was supported by US EPA’s Chemical Safety for Sustainability National Research program.
Footnotes
Disclaimer: Mention of trade names or commercial products does not constitute endorsement or recommendation for use. The contents of this manuscript neither constitute, nor necessarily reflect US EPA policy.
Data accessibility: All data associated with this manuscript can be accessed at data.gov
REFERENCES
- Ankley GT, Bencic DC, Cavallin JE, Jensen KM, Kahl MD, Makynen EA, Martinovic D, Mueller ND, Wehmas LC, Villeneuve DL. 2009. Dynamic nature of alterations in the endocrine system of fathead minnows exposed to the fungicide prochloraz. Toxicol Sci. 112:344–353. [DOI] [PubMed] [Google Scholar]
- Ankley GT, Bennett RS, Erickson RJ, Hoff DJ, Hornung MW, Johnson RD, Mount DR, Nichols JW, Russom CL, Schmieder PK, Serrrano JA, Tietge JE, Villeneuve DL. 2010. Adverse outcome pathways: a conceptual framework to support ecotoxicology research and risk assessment. Environ Toxicol Chem. 29:730–741. [DOI] [PubMed] [Google Scholar]
- Ankley GT, Cavallin JE, Durhan EJ, Jensen KM, Kahl MD, Makynen EA, Thomas LM, Wehmas LC, Villeneuve DL. 2012. A time-course analysis of effects of the steroidogenesis inhibitor ketoconazole on components of the hypothalamic-pituitary-gonadal axis of fathead minnows. Aquat Toxicol. 114–115:88–95. [DOI] [PubMed] [Google Scholar]
- Ankley GT, Jensen KM, Kahl MD, Makynen EA, Blake LS, Greene KJ, Johnson RD, Villeneuve DL. 2007. Ketoconazole in the fathead minnow (Pimephales promelas): reproductive toxicity and biological compensation. Environ Toxicol Chem. 26:1214–1223. [DOI] [PubMed] [Google Scholar]
- Ankley GT, Kuehl DW, Kahl MD, Jensen KM, Linnum A, Leino RL, Villeneuvet DL. 2005. Reproductive and developmental toxicity and bioconcentration of perfluorooctanesulfonate in a partial life-cycle test with the fathead minnow (Pimephales promelas). Environ Toxicol Chem. 24:2316–2324. [DOI] [PubMed] [Google Scholar]
- Becker RA, Ankley GT, Edwards SW, Kennedy SW, Linkov I, Meek B, Sachana M, Segner H, Van Der Burg B, Villeneuve DL, Watanabe K, Barton-Maclaren TS. 2015. Increasing scientific confidence in adverse outcome pathways: application of tailored Bradford-Hill considerations for evaluating weight of evidence. Regul Toxicol Pharmacol. 72:514–537. [DOI] [PubMed] [Google Scholar]
- Cheng WY, Zhang Q, Schroeder A, Villeneuve DL, Ankley GT, Conolly R. 2016. Editor’s highlight: Computational modeling of plasma vitellogenin alterations in response to aromatase inhibition in fathead minnows. Toxicol Sci. 154:78–89. [DOI] [PubMed] [Google Scholar]
- Conolly RB, Ankley GT, Cheng W, Mayo ML, Miller DH, Perkins EJ, Villeneuve DL, Watanabe KH. 2017. Quantitative adverse outcome pathways and their application to predictive toxicology. Environ Sci Technol. 51:4661–4672. [DOI] [PMC free article] [PubMed] [Google Scholar]
- Doering JA, Villeneuve DL, Fay KA, Randolph EC, Jensen KM, Kahl MD, LaLone CA, Ankley GT. 2019a. Differential sensitivity to in vitro inhibition of cytochrome P450 Aromatase (CYP19) activity among 18 Freshwater Fishes. Toxicol Sci. 170:394–403. [DOI] [PubMed] [Google Scholar]
- Doering JA, Villeneuve DL, Poole ST, Blackwell BR, Jensen KM, Kahl MD, Kittelson AR, Feifarek DJ, Tilton CB, LaLone CA, Ankley GT. 2019b. Quantitative response-response relationships linking aromatase inhibition to decreased fecundity are conserved across three fishes with asynchronous oocyte development. Environ Sci Technol. 53:10470–10478. [DOI] [PubMed] [Google Scholar]
- Judson R, Houck K, Martin M, Richard AM, Knudsen TB, Shah I, Little S, Wambaugh J, Woodrow Setzer R, Kothiya P, Phuong J, Filer D, Smith D, Reif D, Rotroff D, Kleinstreuer N, Sipes N, Xia M, Huang R, Crofton K, Thomas RS. 2016. Editor’s highlight: analysis of the effects of cell stress and cytotoxicity on in vitro assay activity across a diverse chemical and assay space. Toxicol Sci. 152:323–339. [DOI] [PMC free article] [PubMed] [Google Scholar]
- Karmaus AL, Toole CM, Filer DL, Lewis KC, Martin MT. 2016. High-throughput screening of chemical effects on steroidogenesis using H295R human adrenocortical carcinoma cells. Toxicol Sci. 150:323–332. [DOI] [PMC free article] [PubMed] [Google Scholar]
- Kavlock R, Chandler K, Houck K, Hunter S, Judson R, Kleinstreuer N, Knudsen T, Martin M, Padilla S, Reif D, Richard A, Rotroff D, Sipes N, Dix D. 2012. Update on EPA’s ToxCast program: providing high throughput decision support tools for chemical risk management. Chem Res Toxicol. 25:1287–12302. [DOI] [PubMed] [Google Scholar]
- Krewski D, Acosta D Jr, Andersen M, Anderson H, Bailar JC 3rd, Boekelheide K, Brent R, Charnley G, Cheung VG, Green S Jr, Kelsey KT, Kerkvliet NI, Li AA, McCray L, Meyer O, Patterson RD, Pennie W, Scala RA, Solomon GM, Stephens M, Yager J, Zeise L. 2010. Toxicity testing in the 21st century: a vision and a strategy. J Toxicol Environ Health B Crit Rev. 13:51–138. [DOI] [PMC free article] [PubMed] [Google Scholar]
- Lubzens E, Young G, Bobe J, Cerdà J. 2010. Oogenesis in teleosts: how eggs are formed. Gen Comp Endocrinol. 165:367–389. [DOI] [PubMed] [Google Scholar]
- McMaster ME, Munkittrick KR, Jardine JJ, Robinson RD, Van Der Kraak GJ. 1995. Protocol for measuring in vitro steroid production by fish gonadal tissue. Canadian Technical Report of Fisheries and Aquatic Sciences 1961. Burlington, ON, Canada: Fisheries and Oceans Canada. [Google Scholar]
- National Research Council, Institute for Laboratory Animal Research. Guide for the Care and Use of Laboratory Animals. National Academy Press, Washington, D.C, 1996. [Google Scholar]
- Nelson ER, Habibi HR. 2013. Estrogen receptor function and regulation in fish and other vertebrates. Gen Comp Endocrinol. 192:15–24. [DOI] [PubMed] [Google Scholar]
- Niwa T, Murayama N, Imagawa Y, Yamazaki H. 2015. Regioselective hydroxylation of steroid hormones by human cytochromes P450. Drug Metab Rev. 47:89–110. [DOI] [PubMed] [Google Scholar]
- Organisation for Economic Cooperation and Development. 2018. User’s handbook supplement to the guidance document for developing and assessing adverse outcome pathways. ENV/JM/MONO(2016)12. Paris, France. [Google Scholar]
- Payne AH, Hales DB. 2004. Overview of steroidogenic enzymes in the pathway from cholesterol to active steroid hormones. Endocr Rev. 25:947–970. [DOI] [PubMed] [Google Scholar]
- Putzrath RM. 1997. Estimating relative potency for receptor-mediated toxicity: reevaluating the toxicity equivalence factor (TEF) model. Regul Toxicol Pharmacol. 25:68–78. [DOI] [PubMed] [Google Scholar]
- Russel WMS, Burch RL. 1959. (as reprinted in 1992). The principles of humane experimental technique. Wheathampstead UK. University Federation for Animal Welfare. [Google Scholar]
- Schroeder AL, Ankley GT, Habib T, Garcia-Reyero N, Escalon BL, Jensen KM, Kahl MD, Durhan EJ, Makynen EA, Cavallin JE, Martinovic-Weigelt D, Perkins EJ, Villeneuve DL. 2017. Rapid effects of the aromatase inhibitor fadrozole on steroid production and gene expression in the ovary of female fathead minnows (Pimephales promelas). Gen Comp Endocrinol. 252:79–87. [DOI] [PMC free article] [PubMed] [Google Scholar]
- Skolness SY, Blanksma CA, Cavallin JE, Churchill JJ, Durhan EJ, Jensen KM, Johnson RD, Kahl MD, Makynen EA, Villeneuve DL, Ankley GT. 2013. Propiconazole inhibits steroidogenesis and reproduction in the fathead minnow (Pimephales promelas). Toxicol Sci. 132:284–297. [DOI] [PubMed] [Google Scholar]
- Skolness SY, Durhan EJ, Garcia-Reyero N, Jensen KM, Kahl MD, Makynen EA, Martinovic-Weigelt D, Perkins E, Villeneuve DL, Ankley GT. 2011. Effects of a short-term exposure to the fungicide prochloraz on endocrine function and gene expression in female fathead minnows (Pimephales promelas). Aquat Toxicol. 103(3–4):170–178. [DOI] [PubMed] [Google Scholar]
- U.S. EPA (U.S. Environmental Protection Agency). 2002. A short term test method for assessing the reproductive toxicity of endocrine-disrupting chemicals using the fathead minnow (Pimephales promelas). EPA/600/R-01/067. Duluth, MN: US EPA Mid-Continent Ecology Division. [Google Scholar]
- US EPA CompTox Chemicals Dashboard [1] accessed 03/05/2020; https://comptox.epa.gov/dashboard/assay_endpoints/TOX21_Aromatase_Inhibition
- US EPA CompTox Chemicals Dashboard [2] accessed 03/05/2020; https://comptox.epa.gov/dashboard/assay_endpoints/NVS_ADME_hCYP19A1
- US EPA CompTox Chemicals Dashboard [3] accessed 04/21/2020; https://comptox.epa.gov/dashboard/dsstoxdb/results?search=DTXSID1040372#bioactivity
- US EPA CompTox Chemicals Dashboard [4] accessed 04/21/2020; https://comptox.epa.gov/dashboard/dsstoxdb/results?search=DTXSID8024151#bioactivity
- US EPA CompTox Chemicals Dashboard [5] accessed 09/29/2020; https://comptox.epa.gov/dashboard/dsstoxdb/results?search=DTXSID1040372
- US EPA CompTox Chemicals Dashboard [6] accessed 09/29/2020; https://comptox.epa.gov/dashboard/dsstoxdb/results?search=DTXSID4023202
- US EPA CompTox Chemicals Dashboard [7] accessed 09/29/2020; https://comptox.epa.gov/dashboard/dsstoxdb/results?search=DTXSID8024151
- Villeneuve DL, Blake LS, Brodin JD, Greene KJ, Knoebl I, Miracle AL, Martinovic D, Ankley GT. 2007. Transcription of key genes regulating steroidogenesis in control and ketoconazole- or vinclozolin-exposed fathead minnows. Toxicol Sci. 98: 395–407. [DOI] [PubMed] [Google Scholar]
- Villeneuve DL, Breen M, Bencic DC, Cavallin JE, Jensen KM, Makynen EA, Thomas LM, Wehmas LC, Conolly RB, Ankley GT. 2013. Developing predictive approaches to characterize adaptive responses of the reproductive endocrine axis to aromatase inhibition: I. Data generation in a small fish model. Toxicol Sci. 133:225–233. [DOI] [PubMed] [Google Scholar]
- Villeneuve DL, Crump D, Garcia-Reyero N, Hecker M, Hutchinson TH, LaLone CA, Landesmann B, Lettieri T, Munn S, Nepelska M, Ottinger MA, Vergauwen L, Whelan M. 2014. Adverse outcome pathway (AOP) development I: strategies and principles. Toxicol Sci. 142:312–320. [DOI] [PMC free article] [PubMed] [Google Scholar]
- Villeneuve DL, Knoebl I, Kahl MD, Jensen KM, Hammermeister DE, Greene KJ, Blake LS, Ankley GT. 2006. Relationship between brain and ovary aromatase activity and isoform-specific aromatase mRNA expression in the fathead minnow (Pimephales promelas). Aquat Toxicol. 76:353–368. [DOI] [PubMed] [Google Scholar]
- Villeneuve DL, Mueller ND, Martinović D, Makynen EA, Kahl MD, Jensen KM, Durhan EJ, Cavallin JE, Bencic D, Ankley GT. 2009. Direct effects, compensation, and recovery in female fathead minnows exposed to a model aromatase inhibitor. Environ Health Perspect. 117:624631. [DOI] [PMC free article] [PubMed] [Google Scholar]
- Villeneuve DL. 2016. Adverse outcome pathway on aromatase inhibition leading to reproductive dysfunction (in fish). OECD Series on Adverse Outcome Pathways 4. Organisation for Economic Co-operation and Development, Paris, France. Available from: https://doi.org/10/1787/5jlsv05mx433-en. [Google Scholar]
- Watanabe KH, Jensen KM, Orlando EF, Ankley GT. 2007. What is normal? A characterization of the values and variability in reproductive endpoints of the fathead minnow, Pimephales promelas. Comp Biochem Physiol C Toxicol Pharmacol. 146:348–356. [DOI] [PubMed] [Google Scholar]
- Wittwehr C, Aladjov H, Ankley G, Byrne HJ, de Knecht J, Heinzle E, Klambauer G, Landesmann B, Luijten M, MacKay C, Maxwell G, Meek ME, Paini A, Perkins E, Sobanski T, Villeneuve D, Waters KM, Whelan M. 2017. How adverse outcome pathways can aid the development and use of computational prediction models for regulatory toxicology. Toxicol Sci. 155:326–336. [DOI] [PMC free article] [PubMed] [Google Scholar]
Associated Data
This section collects any data citations, data availability statements, or supplementary materials included in this article.