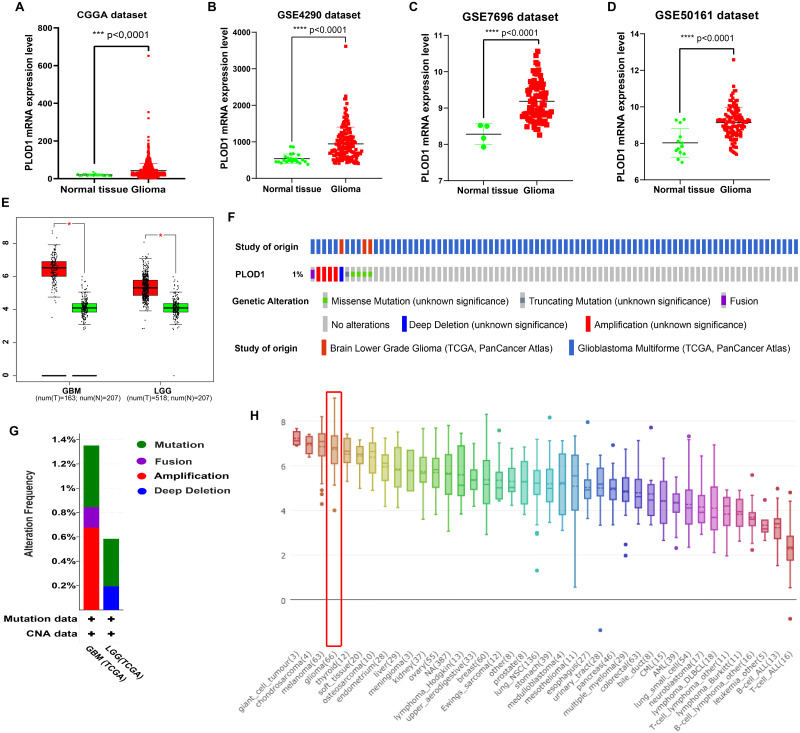
Figure 2. PLOD1 gene expression in glioma and normal tissue.
PLOD1 gene expression in glioma and normal tissue. (A) Comparison of PLOD1 expression levels between glioma and normal tissue in the CGGA datasets. (B) GSE4290 dataset. (C) GSE7696 dataset. (D) GSE50161 dataset. (E) PLOD1 expression levels of GBM and LGG in GEPIA analysis, comparing to normal tissue respectively. (F) The genomic alteration of PLOD1 using cBioPortal online analysis. (G) Mutation types of PLOD1. (H) PLOD1 expression level across various cancer cell lines, including glioma cell lines (rank 4th, indicated by red boxes) from the CCLE database (Y-axis represents the expression level of PLOD1 in different cancer cell lines).

