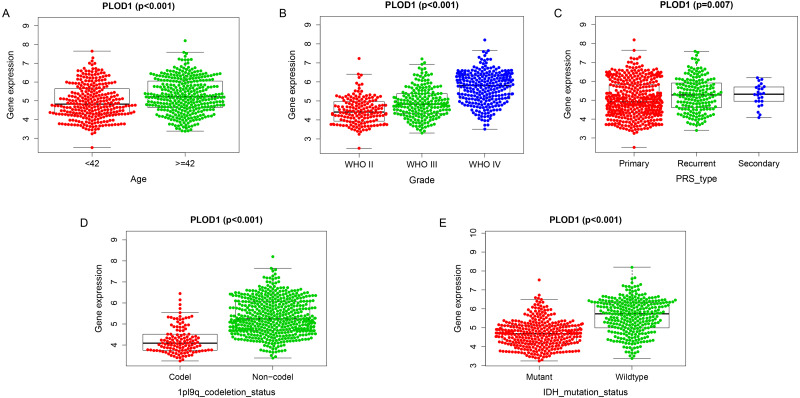
Figure 5. Correlation analysis with clinicopathologic characteristics of PLOD1 in glioma.
(A) Age (<42, n = 294; ≥ 42, n = 342), (B) grade (WHO II, n = 164; WHO III, n = 207; WHO IV, n = 265), (C) PRS type (Primary, n = 433; Recurrent, n = 179; Secondary, n = 24), (D) 1p19q codeletion status (Codel, n = 126; Non-codel, n = 510), and (E) IDH mutation status (Mutant, n = 347; Wildtype, n = 289).

