

Abstract
Ultraviolet photodissociation (UVPD) has emerged as a useful technique for characterizing peptide, protein, and protein complex primary and secondary structure. 193 nm UVPD, specifically, enables extensive covalent fragmentation of the peptide backbone without the requirement of a specific sidechain chromophore and with no precursor charge state dependence. We have modified a commercial quadrupole-ion mobility-time of flight (Q-IM-TOF) mass spectrometer to include 193 nm UVPD following ion mobility. Ion mobility (IM) is a gas-phase separation technique that enables separation of ions by their size, shape, and charge, providing an orthogonal dimension of separation to mass analysis. Following instrument modifications, we characterized the performance of, and information that could be generated from, this new setup using the model peptides substance P, melittin, and insulin chain B. These experiments show extensive fragmentation across the peptide backbone and a variety of ion types as expected from 193 nm UVPD. Additionally, y-2 ions (along with complementary a+2 and b+2 ions) N-terminal to proline were observed. Combining the IM separation and mobility gating capabilities with UVPD, we demonstrate the ability to accomplish both mass- and mobility-selection of bradykinin des-Arg9 and des-Arg1 peptides followed by complete sequence characterization by UVPD. The new capabilities of this modified instrument demonstrate the utility of combining IM with UVPD because isobaric species cannot be independently selected with a traditional quadrupole alone.
Graphical Abstract

Introduction
Proteins demonstrate significant diversity within many important biological processes. Heterogeneity can complicate analysis, but progress in mass spectrometry (MS) instrument development has driven forward the use of this technology in proteome research.1–3 Tandem MS is routinely used to covalently fragment peptides and proteins, enabling protein identification in addition to characterizing any modifications present within a sample. Developments in activation methods have enabled faster and more in-depth protein characterization within recent years.4–8 The most common activation method, collision-induced dissociation (CID) involves accelerating the ions of interest into a neutral background gas resulting in a stepwise buildup of internal energy and dissociation via the lowest energy pathways.9–11 For covalent fragmentation of peptides and proteins, this typically results in the observation of predominantly b- and y-type ions.9 While CID is easy to operate, available on virtually every commercial tandem mass spectrometer, and in many ways the “gold standard” of dissociation methods, the tendency to dissociate via these lower-energy routes can result in loss of labile post-translational modifications (PTMs) and limited sequence coverage.12,13 Electron-based methods, such as electron-capture dissociation (ECD) and electron-transfer dissociation (ETD), result in fragments that are generated prior to energy randomization, resulting in more non-specific fragmentation with fewer amino acid-specific cleavages and the observation of c- and z-type fragments.9,14 Advantageously, electron-based methods allow the retention of PTMs and provide fragments complementary to those generated by CID.9 However, these techniques are largely dependent on precursor charge density and, consequently, the structure of the precursor, in order to accomplish effective dissociation although combination of these techniques with collisional activation has demonstrated some success in overcoming this challenge.15
Ultraviolet photodissociation (UVPD) has demonstrated utility in interrogating the structure of peptides and proteins.6,16,17 Following absorption of one or more photons, dissociation can occur via two pathways: direct dissociation from the excited states or internal conversion and intramolecular vibrational redistribution leading to dissociation.9,18,19 Dissociation of peptides and proteins via UVPD leads to great diversity in fragments observed (predominantly a, b, c, x, y, and z-type fragments), enabling greater confidence in characterizing protein sequence and proteoforms.6 Multiple wavelengths have been used for UVPD studies, each with their own advantages and disadvantages. At longer UVPD wavelengths (240–400 nm), lasers typically have a smaller footprint and do not require expensive or hazardous gases to operate, but specific chromophores are required to absorb the UV photons. At 266 nm, aromatic sidechains are required, for example.9,18 Lowering the wavelength to 193 nm, however, enables absorption of photons by the peptide backbone and removes the requirement for specific sidechains.6 Additionally, 193 nm UVPD has demonstrated extensive sequence coverage irrespective of precursor charge state.6,20 UVPD at 157 nm has shown similar advantages to 193 nm with respect to ion types and sequence coverage (at this wavelength, excitation of most bonds is possible), but practical challenges arise with the need to transmit the entire laser beam in vacuo.21,22 Both 157 nm and 193 nm UV lasers require larger footprints and hazardous gases (F2 and ArF, respectively), but the benefits of extensive sequence information typically outweigh these challenges. The use of UVPD in top-down protein analysis has grown in recent years due to the depth of information that can be obtained about protein structure (from primary to quaternary) from this technique, including the ability to retain and localize PTMs, and ligand binding sites.6,16,23
Ion mobility (IM) is a useful gas-phase separation technique that enables distinction between isobaric species such as different conformations of the same ion or m/z-coincident oligomers.24–27 Traveling-wave ion mobility (TWIM) involves the movement of ions through a stacked ring ion guide (SRIG) that has wave-like DC potentials and is pressurized with a neutral background gas.28 The time it takes different ions to traverse this IM cell can be correlated with size, shape, and charge. The ability to selectively fragment different conformations of the same species can provide insight into higher-order structural features, enabling information to be obtained about peptides and proteins beyond the primary structure.25 Furthermore, recent work in the field of top-down protein analysis has targeted multistage dissociation to more thoroughly characterize diverse protein and protein complex systems.23,29,30 The use of a separation and selection step between these dissociation stages enables distinction of the parent ions from which fragments are generated and ion mobility has the distinct advantage of separating ions such as overlapping oligomeric states formed by surface-induced dissociation or ions with multiple conformations. Ion mobility is an ideal separation and selection method to combine prior to UVPD due to its ability to distinguish between such species. Using a technique known as “mobility gating” we can select ions based on their drift times, allowing each species to then be probed with UVPD. UVPD of drift time-selected ions has been accomplished previously with 266 nm31 and 213 nm25 wavelengths. Here, we present the modification of a commercial instrument platform to incorporate 193 nm UVPD following IM separation and characterize its performance for a series of model peptides.
Experimental
Materials
Substance P (sequence RPKPQQFFGLM-NH2), melittin from honey bee venom (sequence GIGAVLKVLTTGLPALISWIRKRQQ-NH2), insulin chain B (sequence FVNQHLC(SO3H)GSHLVEALYLVC(SO3H)GERGFFYTPKA), bradykinin des-Arg9 (1–8 fragment, sequence RPPGFSPF) acetate salt hydrate, bradykinin des-Arg1 (2–9 fragment, sequence PPGFSPFR), ubiquitin, H218O (97 atom% 18O), and trifluoroacetic acid (TFA) were all purchased from Sigma Aldrich (St. Louis, MO). Peptides were dissolved in 50:50 methanol:H2O and diluted to a final concentration of 10 μM. Ubiquitin (10 μM) was used for laser beam alignment and was buffer exchanged into 100 mM ammonium acetate using Micro Bio-Spin P6 columns (Bio-Rad, Hercules, CA) prior to mass spectrometry analysis.
Instrumentation
A Waters Synapt G2-S mass spectrometer modified to incorporate a laser beam from an Excimer laser filled with ArF gas to provide a 193 nm wavelength (ExciStar XS, Coherent, San Jose, CA), as shown in Figure S1, was used for all experiments. Many instrument modifications were made to incorporate the laser beam on the back end of the instrument similar to previous work incorporating a 213 nm or 266 nm laser on the back-end of this platform.31,32 In brief, a modified lid was used to incorporate a CaF2 window at the top of the time-of-flight region (manufactured by Waters Corporation). A modified pusher plate was installed within the pusher stack (manufactured by the University of Manchester machine shop) that houses a custom 45-degree (with respect to the ion beam path) fixed-angle mirror (14mm x 6mm x 2mm, protected aluminum coating, Rmax @ 193 nm, 45-degree, Rocky Mountain Instrument Co., Lafayette, CO) which allows the laser beam to be reflected collinear to the ion beam. The laser beam passes through the opening (2 mm) in the tophat lens housed at the end of the transfer cell stacked-ring ion guide (SRIG) for irradiation of ions that are trapped within the transfer cell. The laser beam was aligned to the approximate center of the transfer cell. While we cannot unequivocally state that no part of the laser beam passes through the aperture of the IM exit plate, the IM data showed no indication that fragments were generated in that region.
A combination of the instrument operating software (MassLynx v4.2) and Waters Research Enabled Software (WREnS) are used to trap ions within the transfer cell and trigger the laser to fire. The trapping script used to hold ions in the transfer cell and initiate laser irradiation was modified from previous work32 and is provided in the Supplementary Information alongside a diagram of relative trapping potentials (Figure S2). Specific settings used to trap each analyte were adjusted on a case-by-case basis to minimize CID-like activation upon trapping. The laser is triggered via a spare instrument voltage and the number of laser pulses per trapping event is controlled through the number of trapping scans and laser repetition rate, as described in more detail in the Supplementary Information.
Conformer-selective UVPD was accomplished by using the exit plate of the travelling-wave ion mobility (TWIM) cell as a time-controlled gate. A relatively high negative voltage (typically 20 V more negative) compared to standard operating conditions was applied to the exit plate to defocus ions (gate closed) and the standard operating voltage was applied to allow ions to pass through into the transfer cell (gate open). A diagram of relative potential voltages during the gate open and gate closed steps is provided in Figure S3. These voltages were applied to the IM exit plate in a time-dependent manner are included in the Supplementary Information.
Experimental Workflow
Ions were generated via nano-electrospray ionization using borosilicate capillaries that were pulled in-house using a micropipette tip puller (Sutter Instruments model P-97, Novato, CA). A platinum wire was placed inside the solution in the capillary and a potential was applied (0.5 to 1.1 kV) to generate ions. The “sampling cone” was set to 5–10 V to minimize peptide activation and the desired species was mass selected using the quadrupole. During UVPD-only experiments, the instrument was operated in “TOF mode” with a trap gas flow of 1–2 mL/min. During IM-UVPD experiments, the instrument was operated in “IM mode” to enable separation of ions in the TWIM cell and a specific conformation was selected using the mobility gating procedure outlined above followed by trapping in the transfer cell. In IM-UVPD experiments, the trap gas flow was set to 1.5 mL/min, helium cell gas flow was set to 180 mL/min, and IM gas flow was set to 45 mL/min or 65 mL/min. Trap wave velocity (W.V.) was 350 m/s and wave height (W.H.) was 4 V, IM W.V. was 500 m/s and W.H. was 17 V, and transfer W.V. was 180 and W.H. was 8 V. Typical fill times were 1 s and typical trapping times were 1 s. Typically, 5–30 laser shots with an energy of 1–3 mJ was used, as described in more detail in the relevant sections. Data were analyzed using a combination of MassLynx (v4.2, Waters Corporation, Wilmslow, UK), Microsoft Excel 2016 (Microsoft, USA), Protein Prospector (http://prospector.ucsf.edu, UC San Francisco), and ProSight Lite33 (Northwestern University, Evanston, IL). UVPD and CID MS/MS spectra were internally calibrated following data collection using 3–4 high intensity, high-confidence fragment assignments (provided in Table S1). Theoretical fragments of each peptide were generated using Protein Prospector and matched to the spectra manually with a maximum error of 25 ppm.34,35 Manually-deconvoluted lists of fragment masses were also identified using ProSight Lite. Theoretical isotope distributions were generated using the isotope model tool within the MassLynx software using a full-width half-max (FWHM) that matched that of the experimental isotope patterns. Experimental and theoretical isotope distribution data sets were interpolated and the relative ratio of each fragment type determined using the “interp1” and “lsqminnorm” functions within Matlab (MathWorks, Natick, MA) when relevant.
Results & Discussion
UVPD of peptides
Multiple model peptides were chosen to characterize instrument performance and investigate the information that could be obtained from this new instrument setup, such as sequence coverage and ion types. First, doubly charged substance P peptide ([M+2H]2+m/z = 674) was mass selected in the quadrupole followed by trapping and 193 nm UV irradiation in the transfer cell. The resulting UVPD spectrum and sequence coverage map are shown in Figure 1A. Clear isotope distributions can be observed for each fragment ion (Figure 1B). Complementary transfer-CID and trapping-only spectra are provided in Figure S4 for comparison. The trapping script was modified to balance efficient peptide trapping while minimizing CID-like activation. Trapping of substance P demonstrated some CID-type fragments, but clear differences were observed when the peptide was irradiated. Accomplishing UVPD of this peptide using the new instrument setup described above resulted in extensive fragmentation. N-terminus fragments a5-a10, b2-b10, and c4-c8 were observed whereas fewer C-terminus fragments (x9-x10, y8-y10, and z9) were generated, illustrating a stronger series of N-terminus containing fragments as would be predicted given the location of the basic arginine residue (R1). Fragments that represent cleavage at every interresidue location were observed, resulting in complete (100%) sequence coverage and the observation of a variety of ion types (including a, a+1, b, c, x, y, and z-type ions). In addition to the formation of typical UVPD ion types, the unusual y-136 (‘y), y-2 (“y), a+2 (a”), and b+2 (b”) ions were also observed following irradiation of this peptide as discussed in more detail below. Internal fragments and neutral losses (-H2O and -NH3) from b- and y-type ions were also observed, though there may be some influence from collisional-based activation resulting from the trapping and extraction steps. It is also worth noting that “CID-like” fragmentation (b- and y-type ions along with neutral losses) can be observed in UVPD spectra. This occurs when the energy from UV photons generates an excited electronic state which then results in internal conversion into vibrational modes followed by intramolecular vibrational distribution (IVR), which redistributes this energy throughout all available modes and subsequently results in fragmentation patterns comparable to CID.21,37 A strong phenylalanine immonium ion (m/z 120) was also observed in the low mass region of the UVPD spectra which aligns with previous studies that show stronger abundance of immonium ions from H, W, Y, and F amino acids upon photodissociation.38,39 The relative intensity of the F immonium ion decreased when the number of laser shots was increased, suggesting further fragmentation, which is attributed to its higher photoabsorptivity.38 Using 10 laser shots at 1 mJ resulted in UVPD spectra with clear isotope distributions. While comparable spectra could be obtained with a fewer number of laser shots, the S/N improved with increasing quantity of shots without causing any significant changes in ion types or sequence coverage but only causing changes in relative intensity of fragments (Figure S5).
Figure 1.
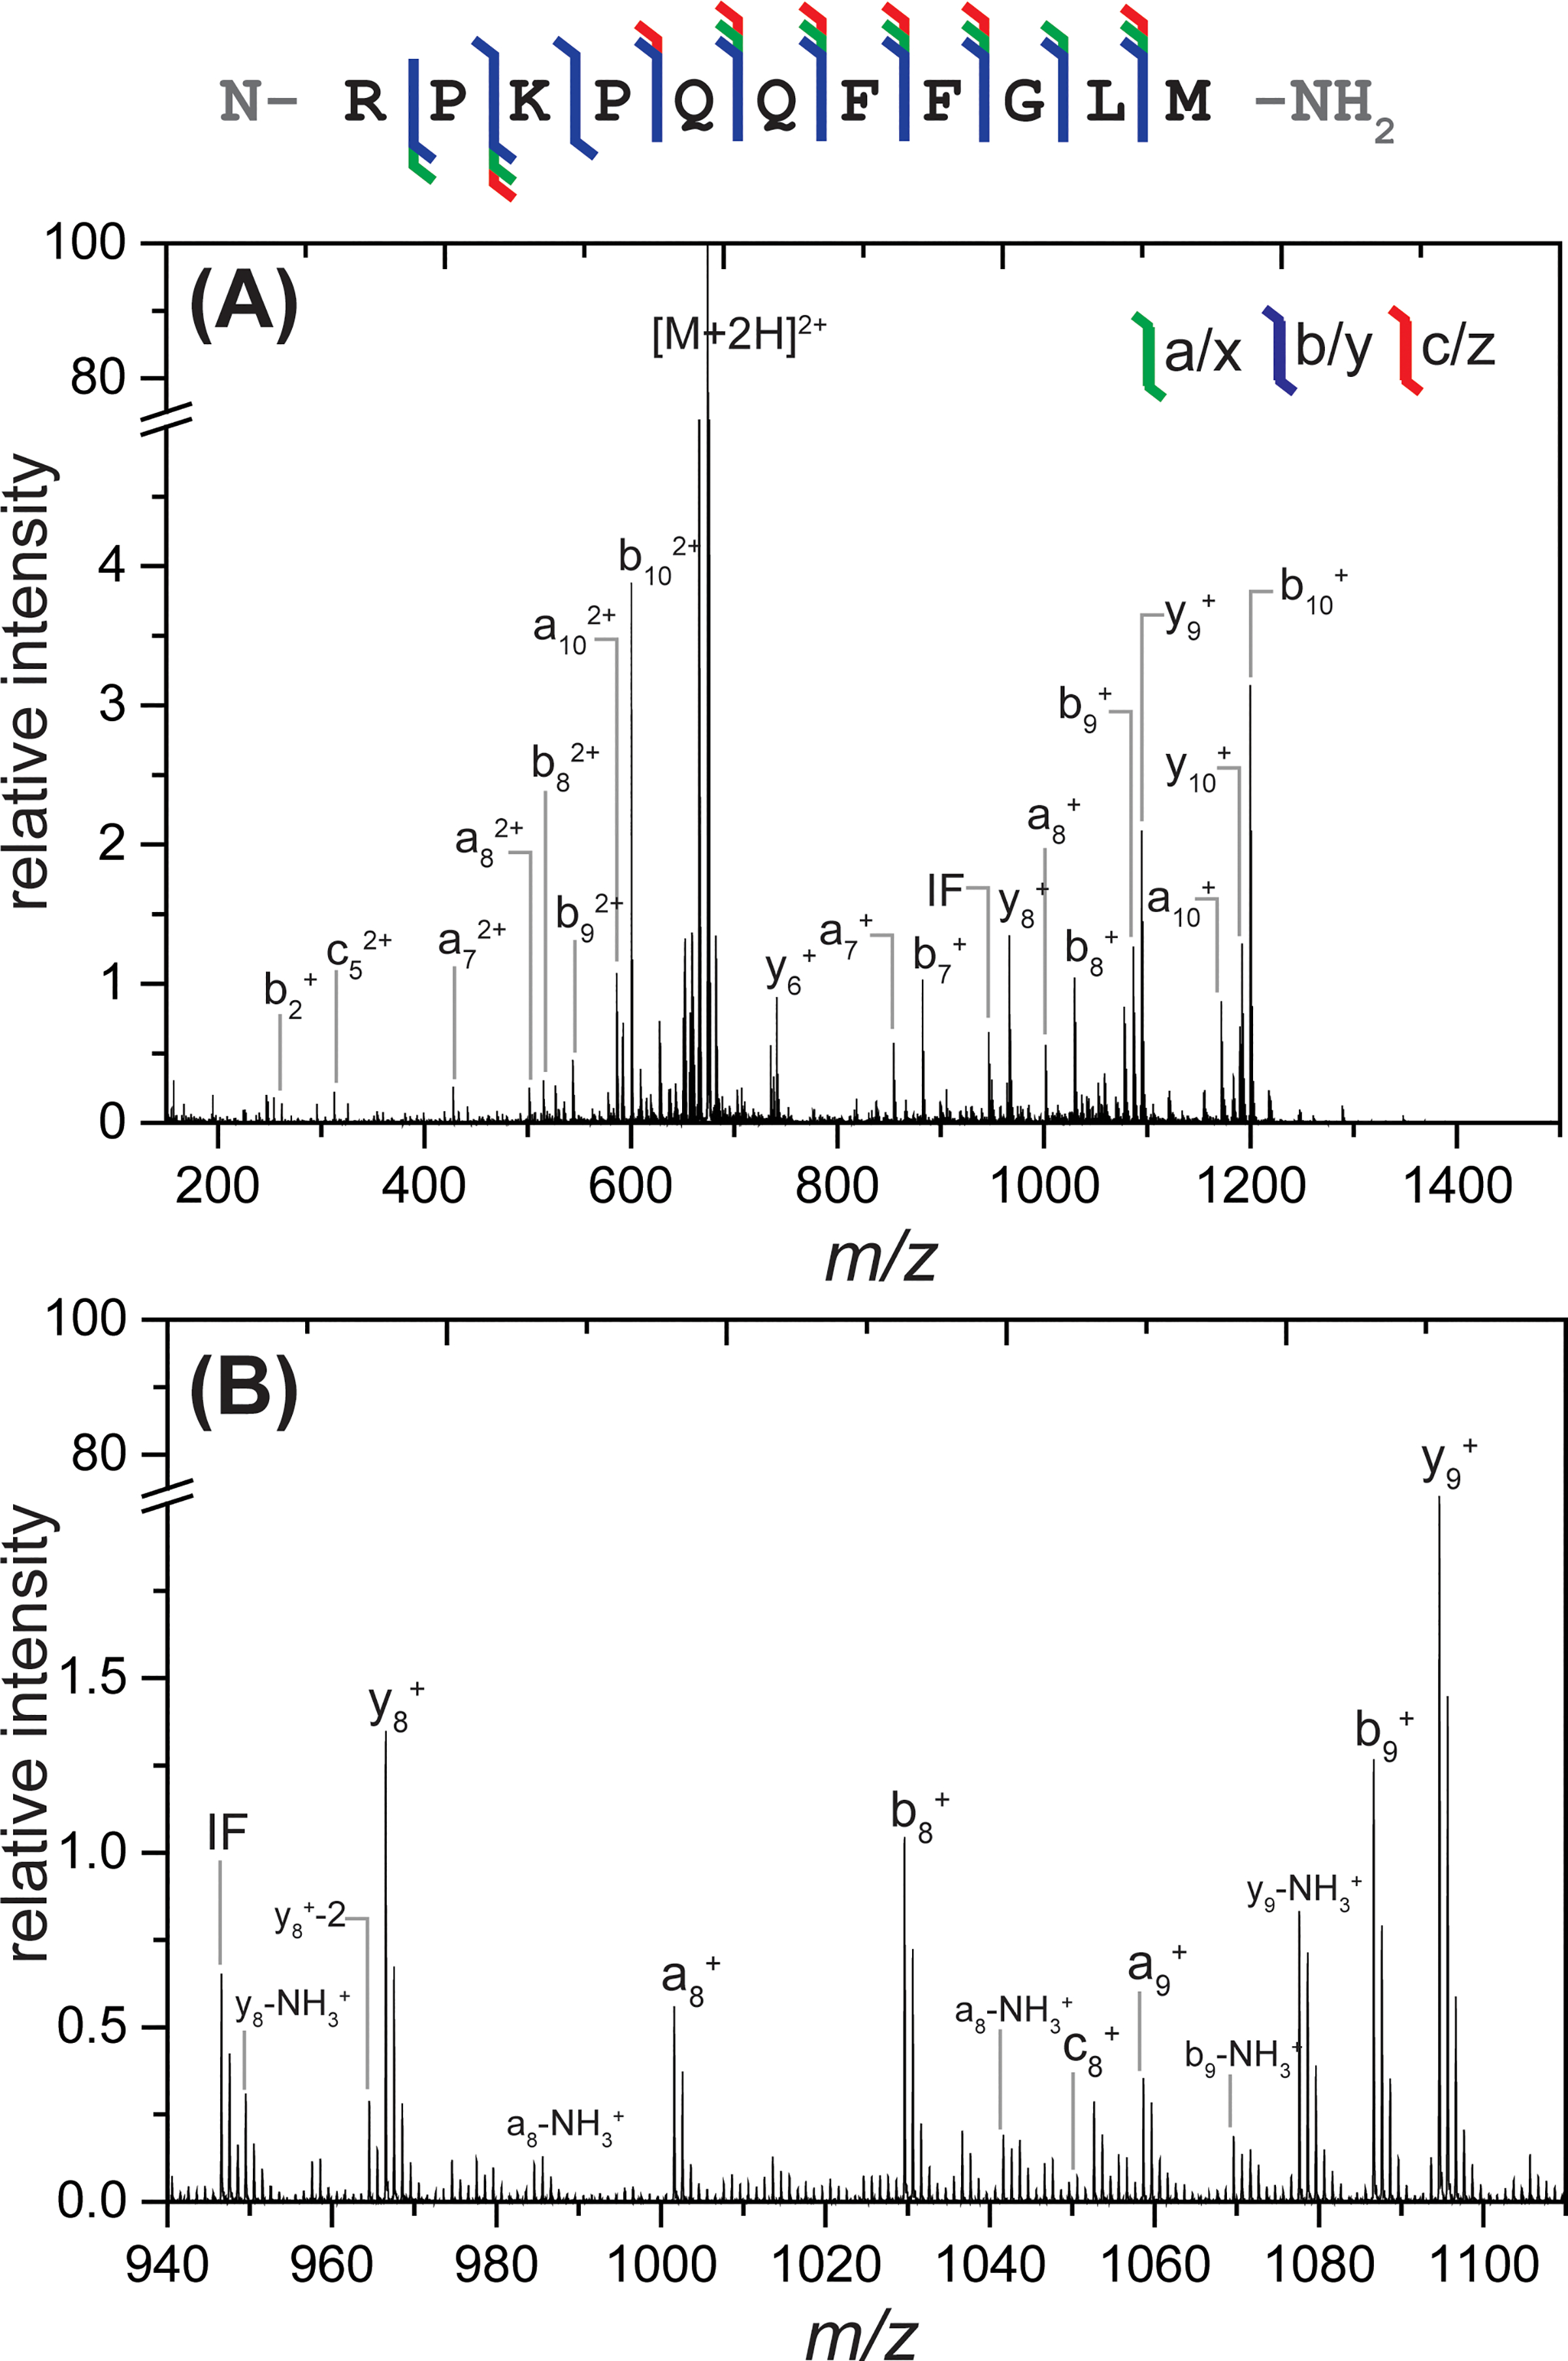
Sequence coverage map, (A) full MS/MS, and (B) zoomed-in higher m/z region observed from 193 nm UVPD of substance P 2+. The isotope distribution of each fragment can be clearly resolved with good signal-to-noise as illustrated in (B). 10 laser shots at 1 mJ were used for irradiation within a 1 s trapping time. A wide variety of ion types and extensive sequence coverage were observed. Major fragments are labeled. A break is included in the y-axis so that fragment ions can be more easily observed.
Next, quadruply charged melittin ([M+4H]4+ m/z = 712) was fragmented using the same instrument setup and the resulting UVPD spectrum and sequence map are shown in Figure 2. Complementary transfer-CID and trapping-only spectra are provided in Figure S6 for comparison. In these spectra, a slightly stronger series of C-terminus containing fragments was observed (y6-y24 and various z-type ions compared with b9-b24 and various a- and c-type ions), which is anticipated due to the location of two basic arginine residues towards the C-terminus of the melittin sequence. UVPD of this peptide resulted in only one missed cleavage, resulting in extensive sequence coverage (96%). Similar to spectra obtained with substance P, a variety of ion types were observed. Production of the d(a9)+ fragment demonstrates the utility of 193 nm UVPD in distinguishing between isobaric residues leucine and isoleucine, though these fragments are typically observed more frequently with singly charged precursors.38,40
Figure 2.
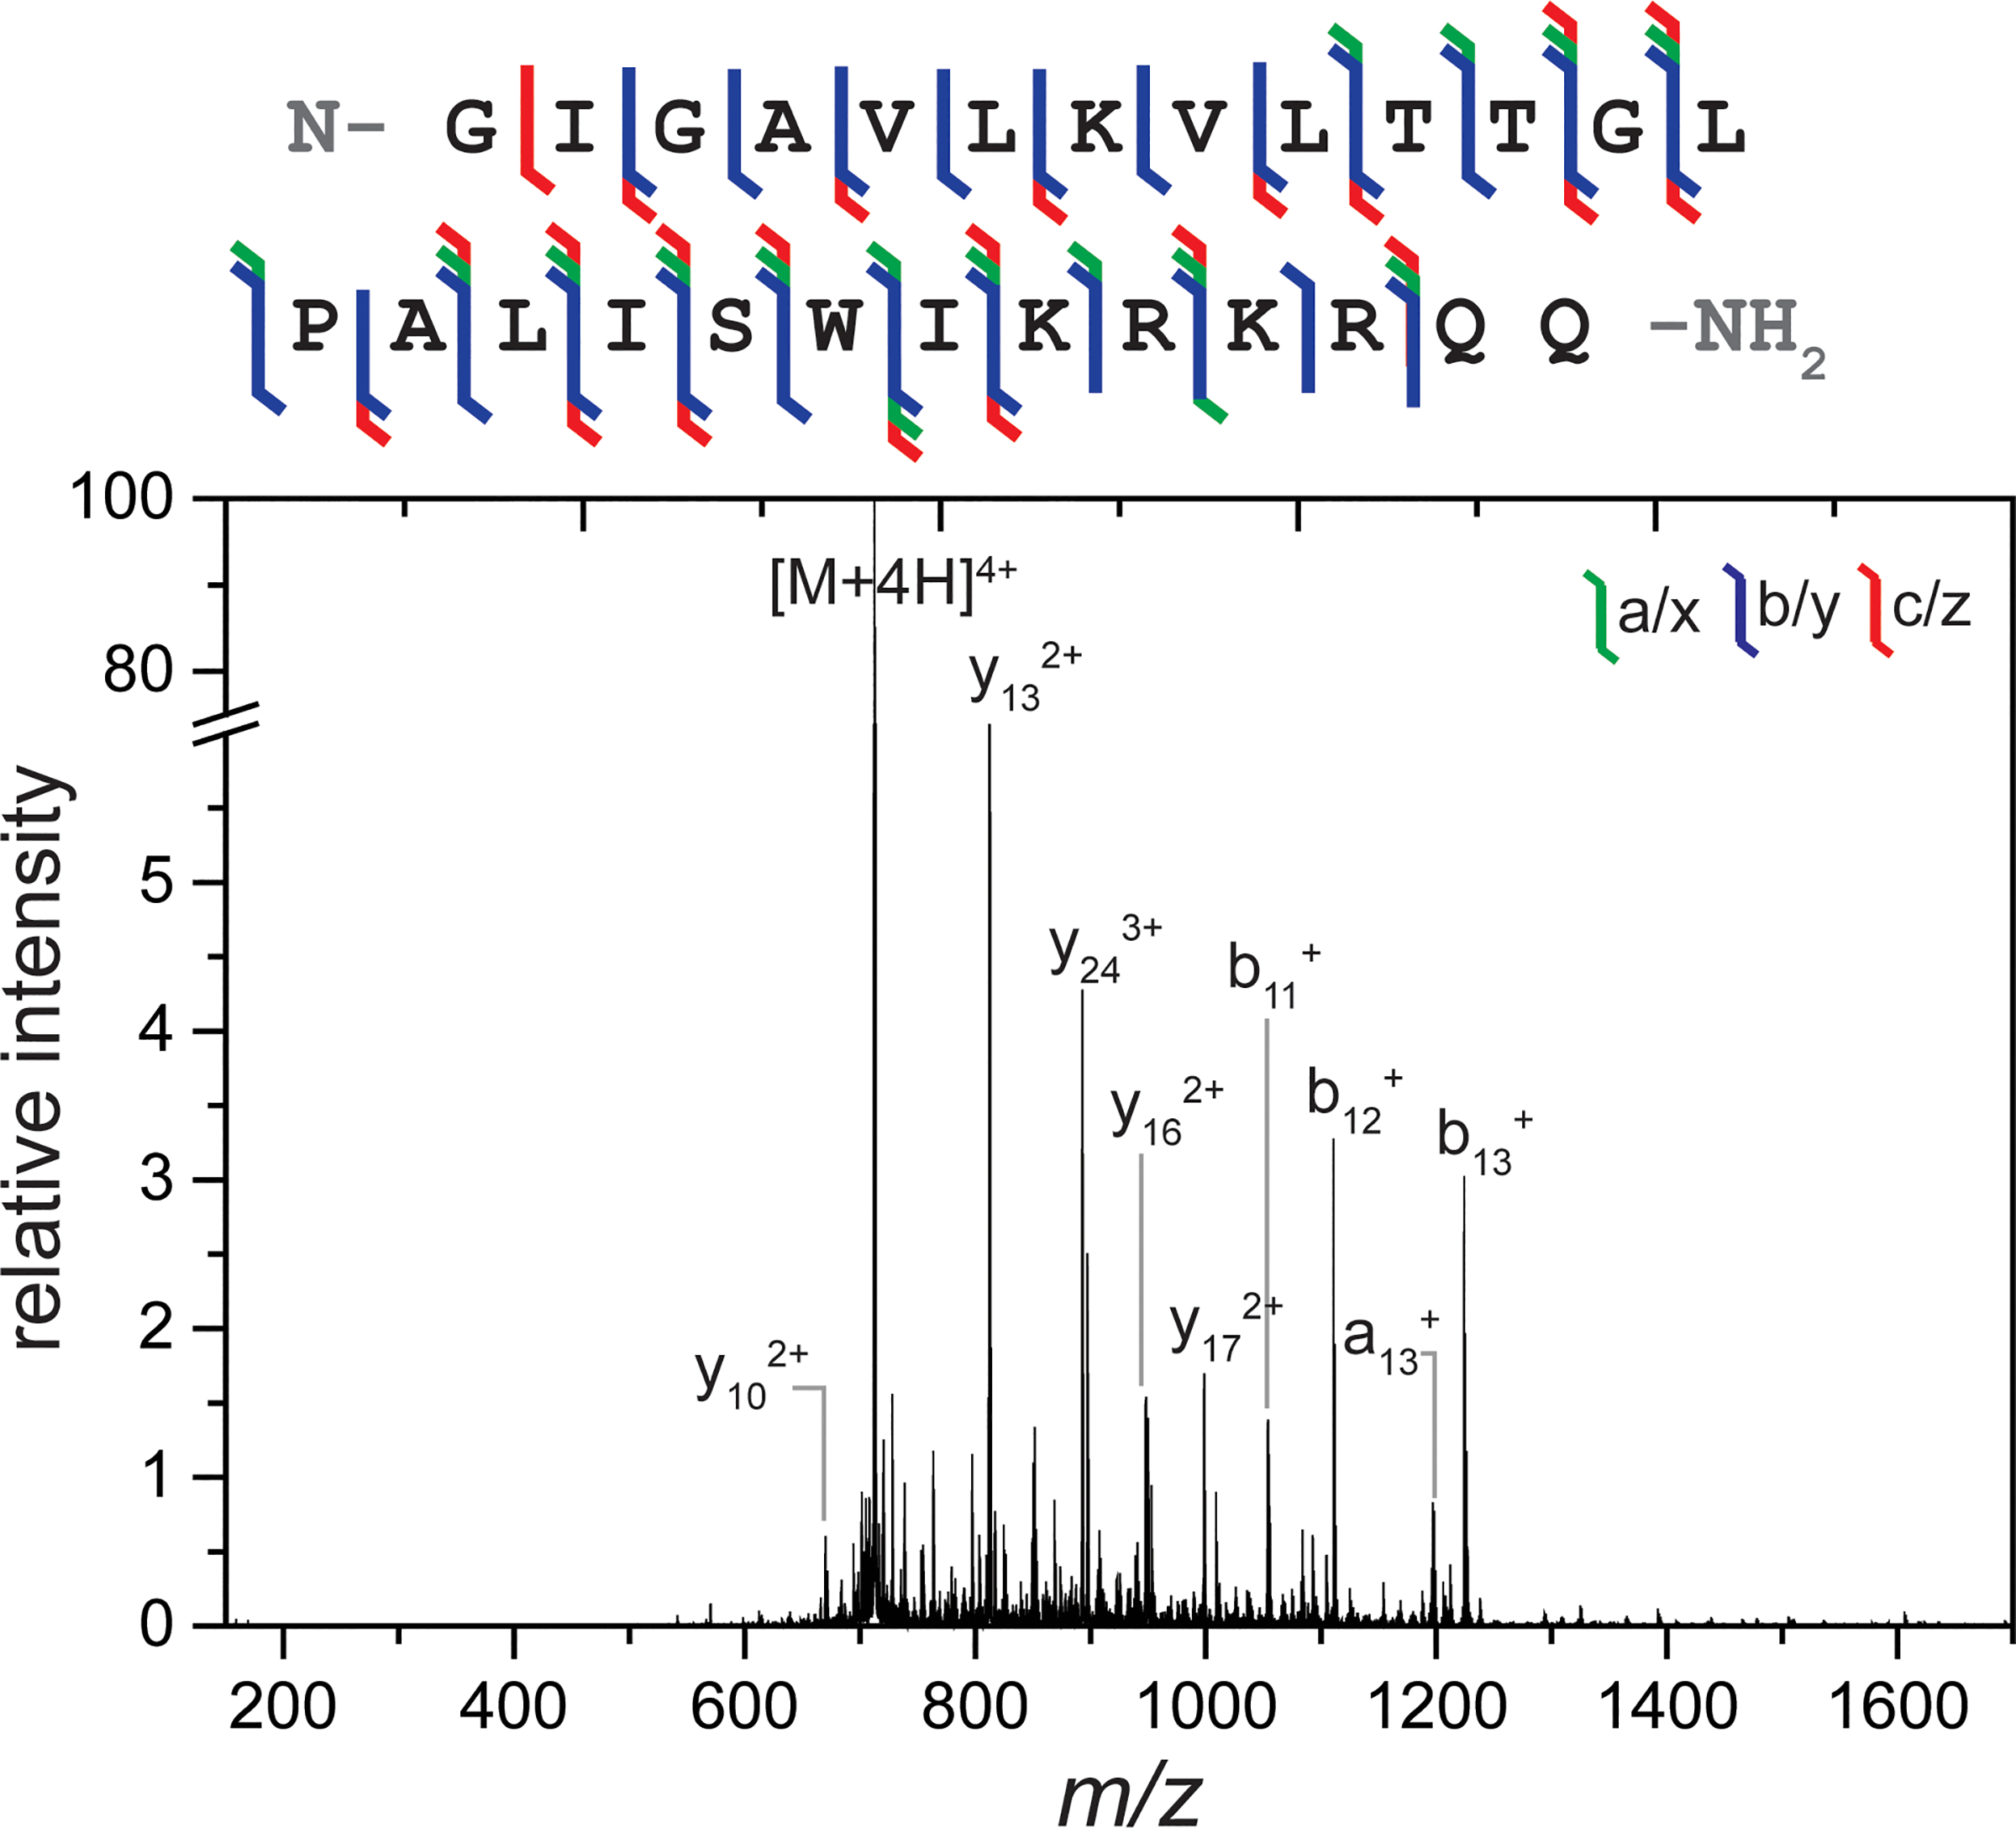
Sequence coverage map and full MS/MS spectrum observed from 193 nm UVPD of melittin 4+. 10 laser shots at 1 mJ were used for irradiation within a 1 s trapping time. A wide variety of ion types and extensive sequence coverage were observed. Major fragments are labeled. A break is included in the y-axis so that fragment ions can be more easily observed.
We next considered a slightly larger peptide, insulin chain B. Triply charged insulin chain B ([M+3H]3+ m/z = 1166) was fragmented using the same setup described above and the corresponding UVPD spectrum and sequence coverage map are shown in Figure 3. Complementary transfer-CID and trapping-only spectra are provided in Figure S7. Insulin chain A and chain B are typically linked to one another with two disulfide bonds that form between C7 (chain B) and C7 (chain A) in addition to between C19 (chain B) and C20 (chain A). To study the individual chains, these disulfide bonds are oxidized and formed sulfonic acids. Including these sulfonic acid modifications on both cysteine residues, the sequence coverage obtained from 193 nm UVPD under these experiments was 100% and demonstrated, once again, the same variety of ion types as observed for previous peptides.
Figure 3.
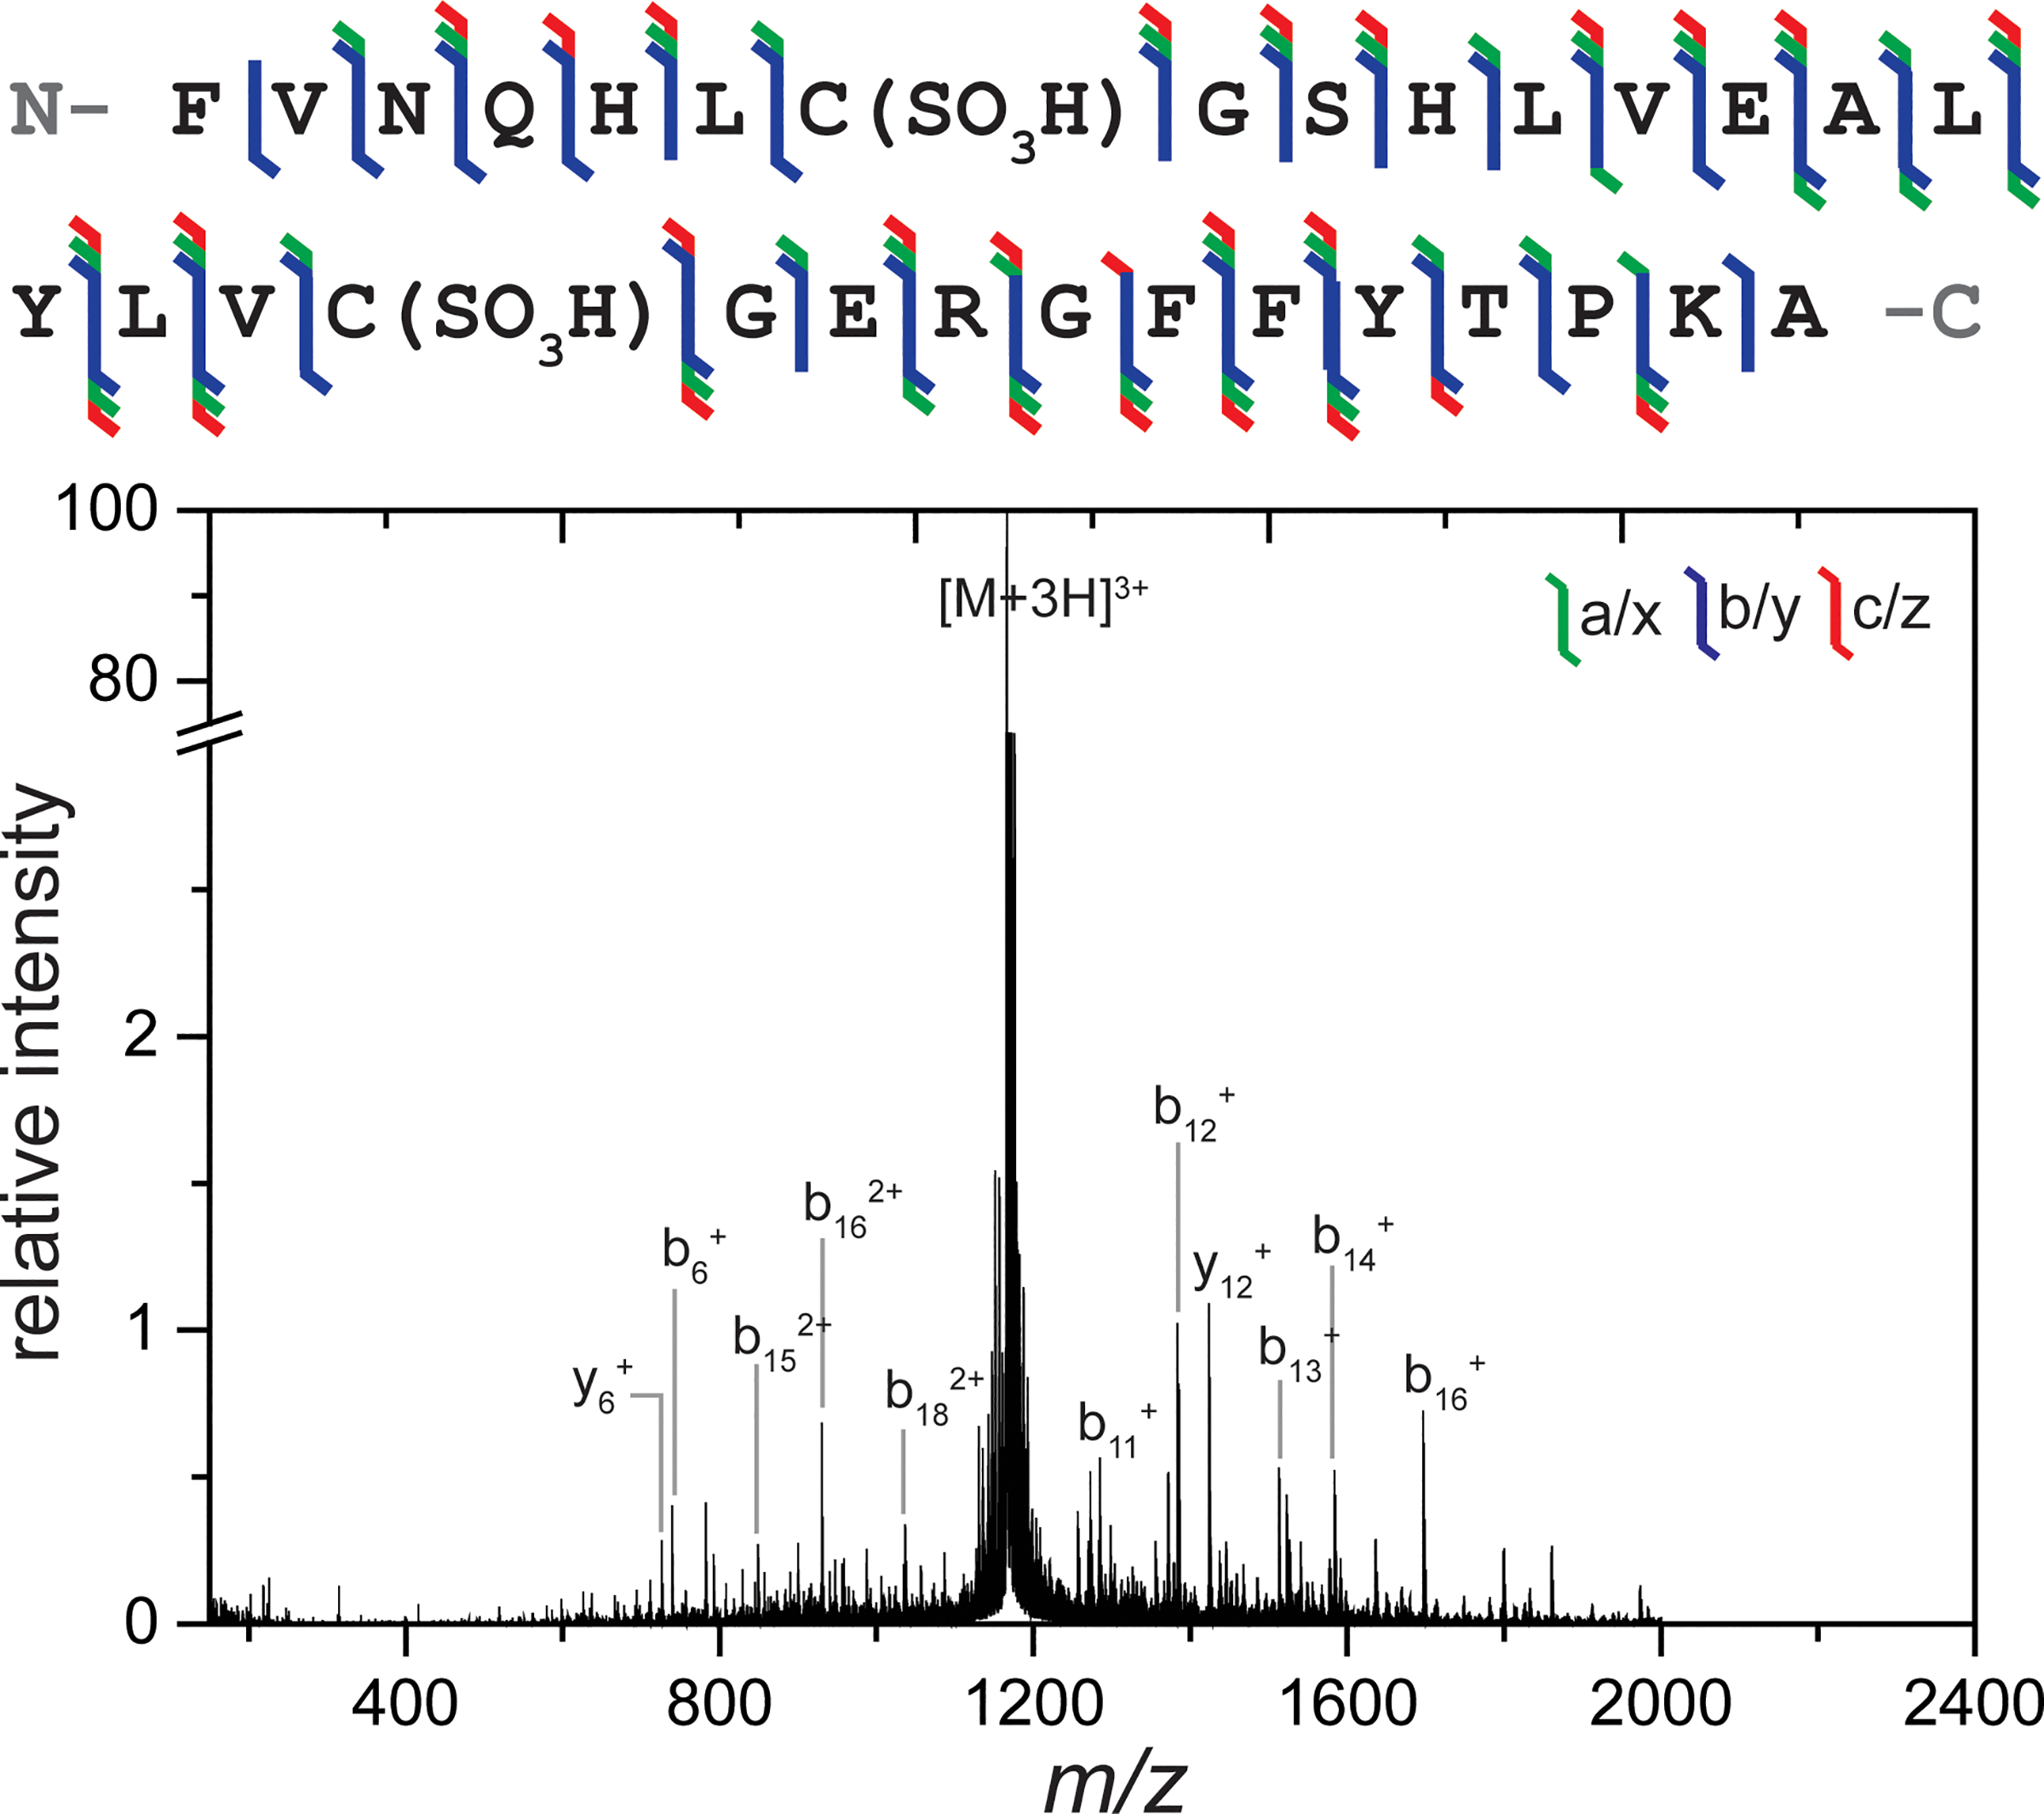
Sequence fragment map and full MS/MS spectrum observed from 193 nm UVPD of insulin chain B 3+. 10 laser shots at 1 mJ were used for irradiation within a 1 s trapping time. A wide variety of ion types and extensive sequence coverage were observed. Major fragments are labeled. A break is included in the y-axis so that fragment ions can be more easily observed.
Investigation of y-1 and y-2 fragment ions
After initial experiments to characterize instrument performance, it was clear that numerous y-type fragments presented different isotope distributions than expected with the presence of monoisotopic peaks at −1 Da and −2 Da mass shifts compared to the theoretical fragment monoisotopic mass. While y-1 fragments are briefly listed in some 193 nm literature,6 to the best of our knowledge there has been no in-depth discussion about y-2 fragments for 193 nm, although they have been discussed for 213 and 157 nm.41,42 The identity of these fragments as y-type ions was confirmed through 18O labeling of the C-terminus, as described in previous literature43–45 and in more detail in the Supplementary Information alongside Figure S8 and Table S2. It was determined through these labeling experiments, in combination with comparison to theoretical isotope distributions, that a mixture of y and y-1 (or, in some cases, y-2) fragments are observed rather than exclusively one ion type. When mapping the location of these unusual fragments along the peptide sequence, the observation of y-1 fragments did not show any apparent sequence-dependent trends (Figure S9). However, the y-2 fragments occurred exclusively N-terminal to proline residues (Figure S10).
Interestingly, previous work from Girod, et al. (213 nm) and Kim, et al. (157 nm) demonstrate the observation of these unusual y-2 fragments, alongside a+2 and b+2 complementary ions at the same location, N-terminal to proline.41,42 Both Girod, et al. and Kim, et al. utilized UVPD experimental findings coupled with molecular dynamics simulations to propose mechanisms that involve homolytic bond cleavage followed by electron and hydrogen rearrangements.41,42 The observation of y-2, a+2, and b+2 ions all occurred alongside the “typical” y-, a-, and b-type fragments. In the work presented here, the comparison of experimental data to theoretical isotope distributions also demonstrate the presence of both y and y-2 fragments when utilizing 193 nm UVPD, as illustrated in Figures S11 and S12. Similar to previous studies,41,42 a+2 and b+2 fragments complementary to the observed y-2 ions were typically observed in experiments accomplished with the 193 nm UVPD setup here. Comparison to theoretical isotope distributions confirm these fragments as well; they are clearly observed even when varying the number of laser shots or laser energy (Figures S13 and S14 demonstrate melittin a13+2 as an example). The single exception was the lack of the b13+2 ion for the melittin peptide. Our work here with 193 nm UVPD agrees well with these previous findings at other UV wavelengths, but additional studies will need to be conducted utilizing a more systematic investigation of peptides with and without proline to confirm initial observations. While sequence coverage determined from 193 nm UVPD of proteins and protein complexes has shown little-to-no charge state dependence, future work will also explore the potential impact of precursor charge state on fragmentation efficiency and patterns.6,20
UVPD of conformationally-selected peptides
Following successful fragmentation of mass-selected peptides with 193 nm UVPD on a Q-IM-TOF, we optimized a mobility gating method to conformationally-select ions prior to UV irradiation. Mobility gating has been accomplished on the Synapt platform previously using a grounded exit plate and the MassLynx look up table function31, but this setup limits the amount of activation that can be accomplished pre-IM (e.g. CID or SID) due to limits on voltages in the front-end instrument optics. Here, we have applied an external voltage to the exit plate that can be adjusted for “gate open” (ions pass through the IM exit) or “gate closed” (ions are defocused at the IM exit) enabling nearly identical mobility gating operation but with increased flexibility in pre-IM activation capabilities for future experiments. First, bradykinin des-Arg9 was used to explore the mobility gating isolation widths possible with this setup by applying a voltage to the IM exit plate rather than grounding as in Bellina, et al. and Theisen, et al.31,32 Using varying pulse output widths on the pulse/delay generator, the ATD width can be adjusted to be wider or narrower, as illustrated in Figure S16A–F. A pulse width of 0.05 ms corresponds to an observed ATD with a width of approximately 0.3 ms. These ions can then be trapped and irradiated with the laser and result in clear UVPD fragments (Figure S15G–J), even at narrower mobility gating widths (Figure S15J), although the signal is decreased due to the isolation of fewer ions. The ATD width that can be selected also depends on the “gate open” and “gate closed” voltages applied using the high voltage pulser, in which a greater difference between the two can result in narrower ATD selections, but this increases the influence of CID contamination.
To demonstrate this IM-UVPD setup, we chose bradykinin des-Arg1 (PPGFSPFR) and bradykinin des-Arg9 (RPPGFSPF) peptides mixed together in solution. These peptides are variants of the bradykinin peptide, where a single arginine residue is absent from each.
While their amino acid sequences differ from one another by the location of arginine, they have identical masses and therefore present at the same m/z. In these experiments, the doubly charged bradykinin des-Arg1 and des-Arg9 peptides were mass selected in the quadrupole ([M+2H]2+ m/z = 452). Due to differences in their conformations, these two peptides can be separated from one another using IM as illustrated in Figure 4A. Following mass selection, each individual peptide was conformationally selected using mobility gating (Figure 4B for the higher mobility peptide identified as des-Arg9 and Figure 4C for the lower mobility peptide identified as des-Arg1), trapped in the transfer cell, and irradiated with the 193 nm UV laser. Due to the lack of baseline resolution in IM, the front end of the first ATD peak and back end of the second ATD peak were selected for further analysis. The corresponding MS/MS spectra for each peptide are illustrated in Figure 4D and 4E for des-Arg9 and des-Arg1, respectively. Highlights of the low-m/z regions are shown in Figure 4F and 4G. Sequence maps and ion types observed for each peptide following fragmentation by UVPD are shown in Figure 4H and 4I. Complementary data for transfer-CID of the bradykinin des-Arg9 and des-Arg1 peptides is shown in Figure S16.
Figure 4.
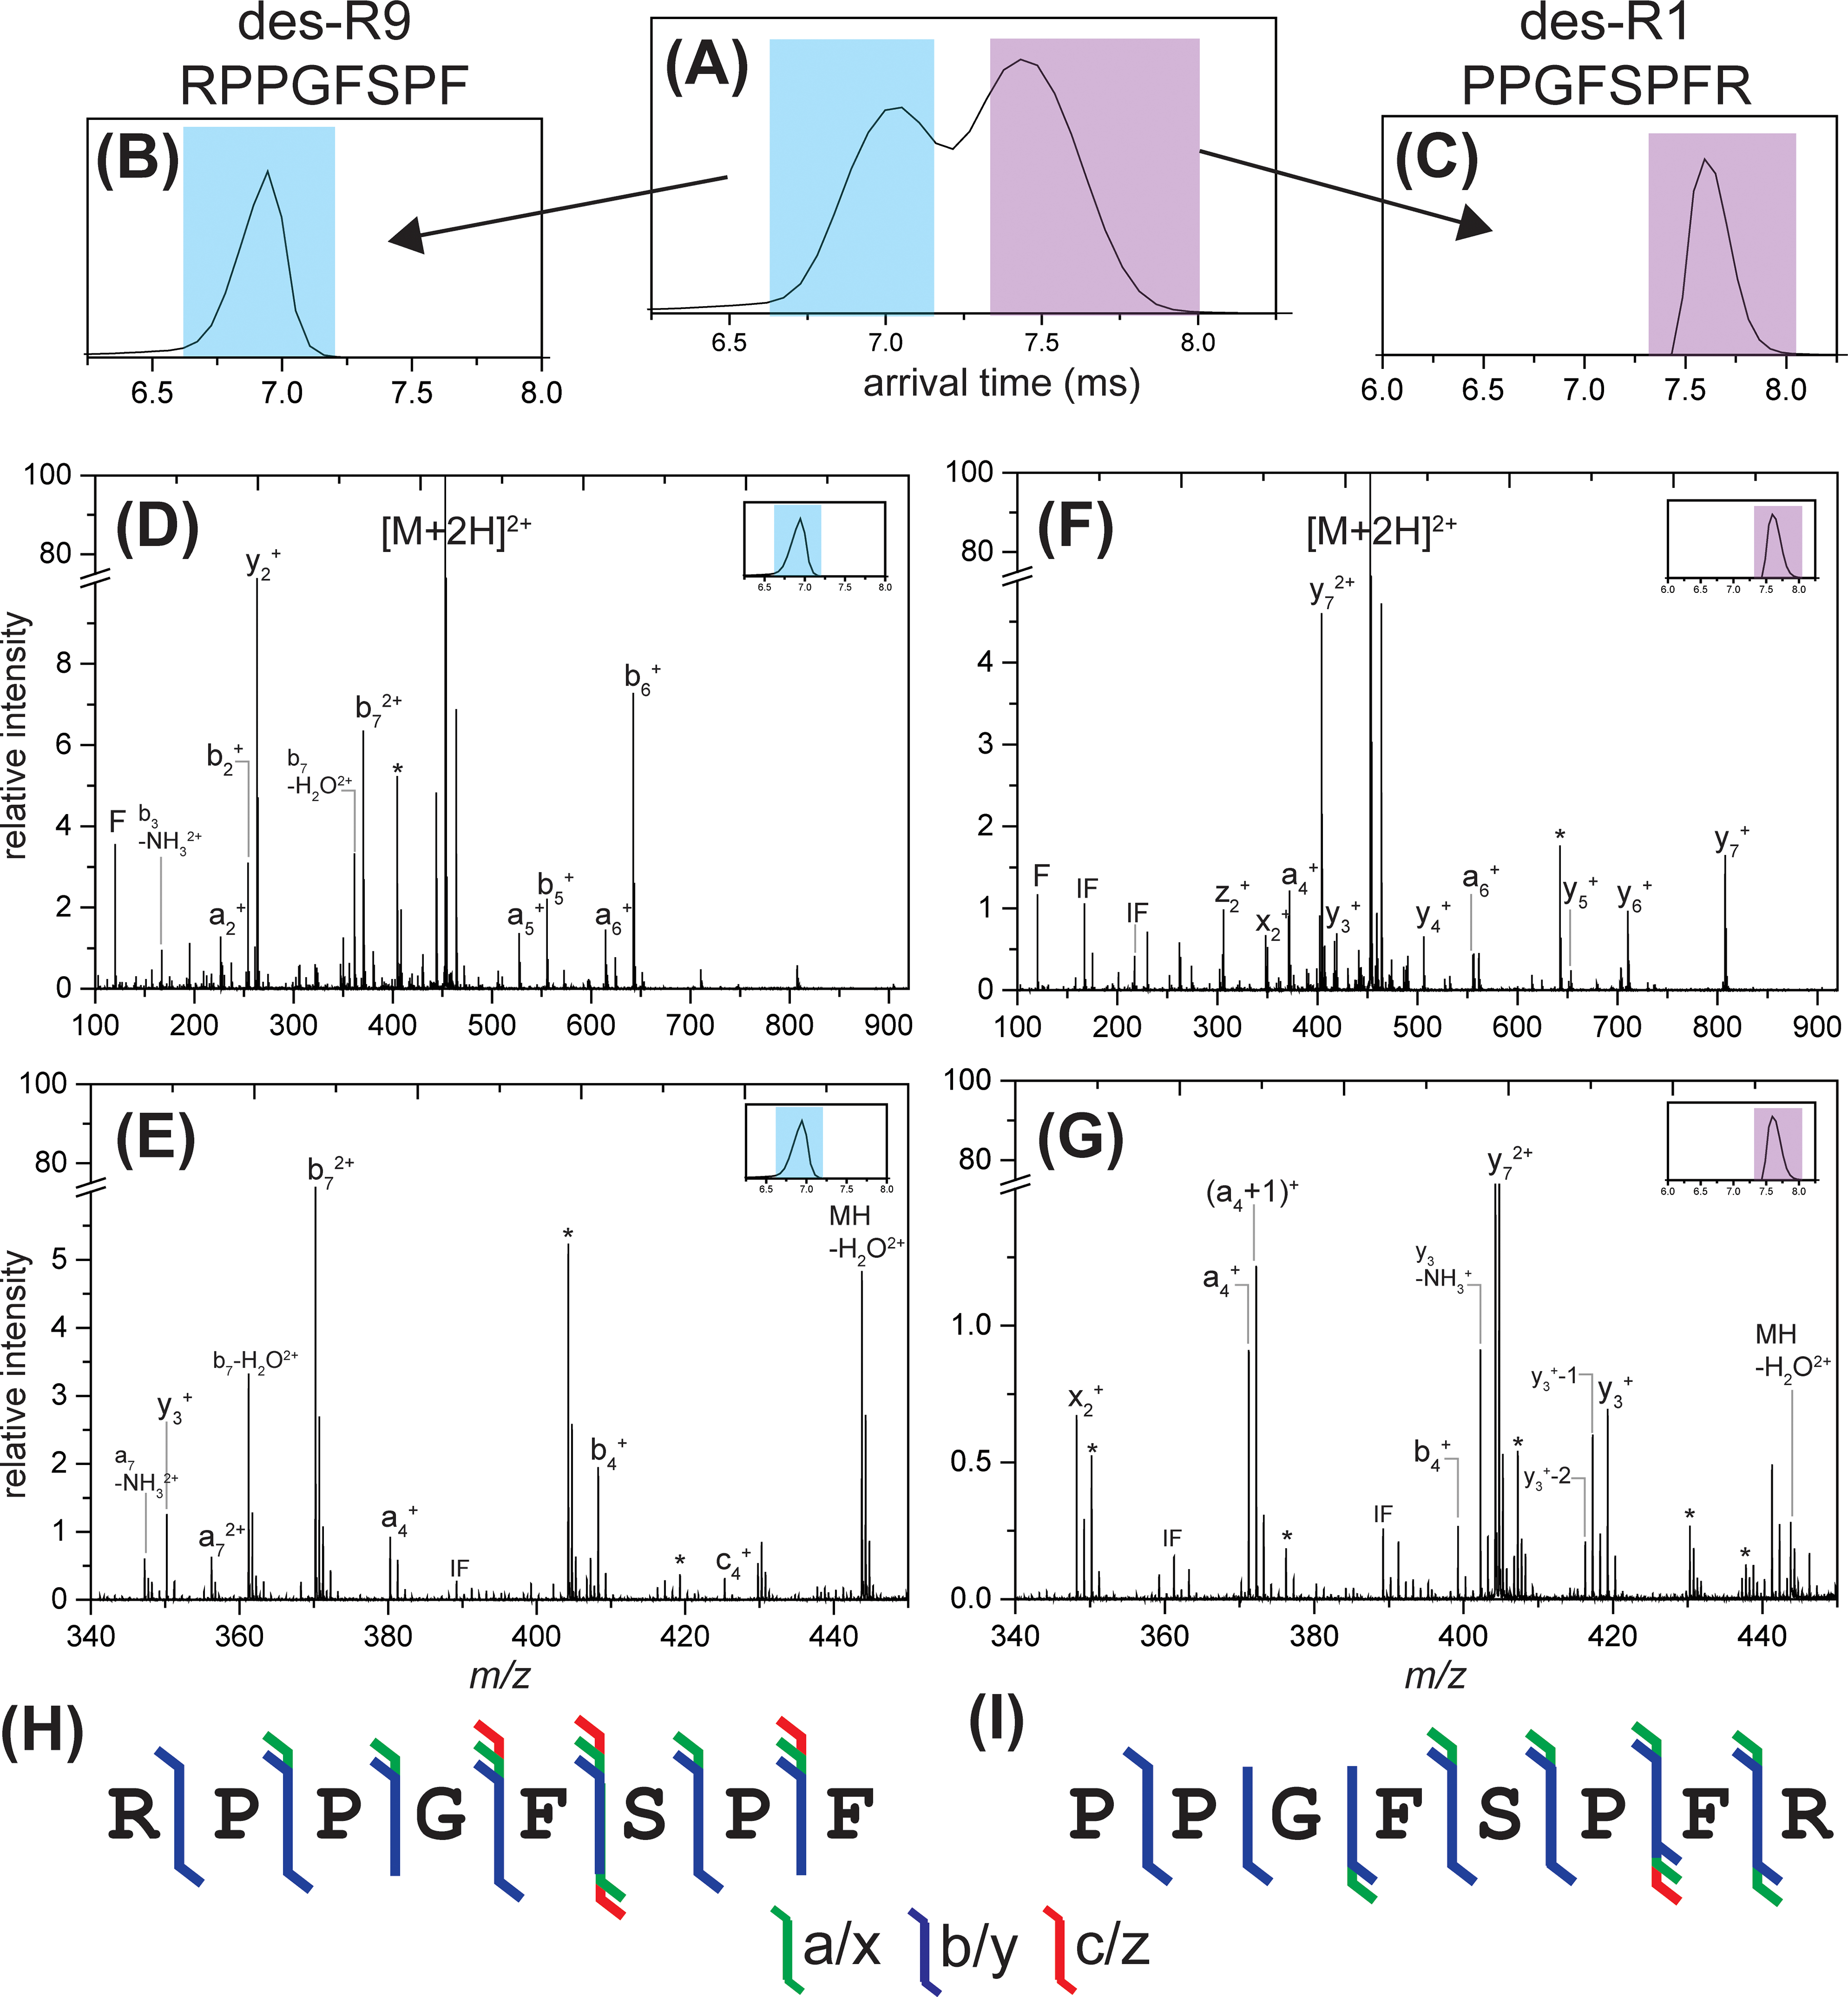
IM-UVPD of bradykinin des-Arg1/des-Arg9. (A) arrival time distribution (ATD) of bradykinin des-Arg9 (blue) and des-Arg1 (purple) mixture from separation within the TWIM cell. The m/z of each species is the same so they are unable to be separated from traditional mass analysis. (B) bradykinin des-Arg9 and (C) bradykinin des-Arg1 show the corresponding ATDs of the drift time-selected peptides using mobility gating. Following mobility gating, the peptides were individually trapped within the transfer SRIG and irradiated with the 193 nm laser, resulting in (D) full MS/MS spectrum and (E) zoomed-in spectrum of mobility-selected bradykinin des-Arg9 alongside (F) full MS/MS spectrum and (G) zoomed-in spectrum of mobility-selected bradykinin des-Arg1. (H) and (I) show the corresponding sequence coverage maps for UVPD of bradykinin des-Arg9 and des-Arg1, respectively. A break is included in the y-axis so that fragment ions can be more easily observed. Peaks resulting from laser noise or fragments arising from UVPD the non-mobility-selected peptide due to lack of IM baseline resolution are marked with an asterisk (*).
As anticipated, the MS/MS spectra from UVPD of the bradykinin des-Arg9 peptide demonstrate a strong b-ion series due to the basic arginine on the N-terminus as illustrated by high intensity b-type fragments and a complete b-type ion series. Comparably, the MS/MS spectra from UVPD of the bradykinin des-Arg1 peptide demonstrate a strong y-ion series due to the basic arginine on the C-terminus as illustrated by high intensity y-type fragments and a complete y-type ion series. The complete sequence information determined from UVPD of each peptide allows unambiguous assignment of the peptide responsible for each peak observed in the ATD. Using the same number of laser shots and the same laser pulse energy, the relative intensity of fragments occurring from the bradykinin des-Arg9 peptide was much greater (~5x) than the relative intensity of fragments generated from the des-Arg1 peptide. CID of these peptides illustrates a similar trend; greater CID energy is required to obtain comparable precursor depletion of the des-Arg1 peptide when compared to des-Arg9, which agrees with previous work fragmenting these singly charged peptides using both CID and SID in which higher energy collisions are required to obtain comparable precursor depletion of des-Arg1 when compared to des-Arg9.46–49 Despite a more compact conformation according to the arrival times, the observed higher intensity fragments of the des-Arg9 peptide for identical UVPD settings is somewhat counter-intuitive but can be explained by the mobile proton model. The doubly-charged bradykinin des-Arg9 has one proton sequestered to the basic arginine side chain on the N-terminus whereas the second proton is more mobile, resulting in fragmentation that can occur more easily from IVR. In contrast, the doubly protonated bradykinin des-Arg1 has one proton sequestered at the basic arginine and the other is localized to the next most basic site at the secondary amine of Pro at the N-terminus, resulting in a higher onset energy required for fragmentation by IVR.46
The IM-UVPD experiments discussed here demonstrate the ability to effectively deconvolute MS/MS spectra for m/z-coincident species. This capability can be useful in elucidating the fragments generated from different peptide or protein conformations as demonstrated here and future work will focus on implementing this technology to deconvolute fragments generated from m/z-coincident oligomers of homomeric protein complexes, e.g. those produced by SID.
Conclusions
We have demonstrated modification of a commercial ion mobility mass spectrometer to accomplish 193 nm UVPD in the transfer cell region, enabling mass-selected UVPD or conformationally-selected (IM-UVPD) UVPD of ions. The spectra generated from this new instrument setup show significant fragmentation as illustrated by complete or nearly-complete sequence coverage of model peptides without the requirement of specific sidechain chromophores. Many fragment ion types were observed including a, a+2 (a”), b, b+2 (b”), c, d, x, y, y-1 (‘y), y-2 (“y), and z ion types. We also report the observation of y-2 fragments and the complementary a+2 and b+2 ions at interresidue cleavages N-terminal to proline, aligning with previous work from 213 nm and 157 nm UVPD.
Combining ion mobility separation with this UVPD setup enables ions to be irradiated following a drift time selection step, allowing for effective deconvolution of MS/MS spectra from isobaric species that cannot be separated with mass selection alone. The mobility gating setup utilized here enables full functionality of front-end activation methods. We demonstrated the utility of IM-UVPD using a mixture of bradykinin des-Arg9 and des-Arg1 peptides. These peptides cannot be separated by m/z but instead their mobility separation and selection prior to UVPD enabled clear characterization of the respective peptide sequences.
Future work will include a more in-depth investigation of the y-2 fragment ions with a systematic study of proline- and non-proline-containing peptides to confirm initial observations that these fragments occur exclusively N-terminal to proline residues. Additionally, the trapping efficiency in the transfer cell will be improved to enable more effective trapping and irradiation of larger analytes. Ultimately, combination of an activation method such as CID or SID in the trap cell region of this instrument along with UVPD in the transfer cell would allow for more in-depth characterization for protein complexes via CID-IM-UVPD or SID-IM-UVPD. These experiments would allow non-covalent, subunit-subunit, interactions to be cleaved (CID or SID) before sequencing of the subunits via covalent cleavage (UVPD).
Supplementary Material
Acknowledgments
The authors gratefully acknowledge funding from the National Institutes of Health (NIH P41GM128577) awarded to V.H.W. We would also like to thank Dr. Emmy Hoyes of Waters Corporation for her help with modifying and optimizing WREnS scripts.
Footnotes
Supporting Information
“UVPD_SI.pdf” Additional experimental and instrument modification details, 18O labeling data, complementary transfer-CID and trapping-only spectra.
The authors declare the following financial competing interest(s): Jeffery Brown is an employee of Waters Corporation, which manufactures and sells Synapt G2-S instruments.
References
- (1).Aebersold R A Mass Spectrometric Journey into Protein and Proteome Research. Journal of the American Society for Mass Spectrometry 2003, 14 (7), 685–695. 10.1016/S1044-0305(03)00289-7. [DOI] [PubMed] [Google Scholar]
- (2).Yates JR Recent Technical Advances in Proteomics. F1000Res 2019, 8. 10.12688/f1000research.16987.1. [DOI] [PMC free article] [PubMed] [Google Scholar]
- (3).Mesri M Advances in Proteomic Technologies and Its Contribution to the Field of Cancer. Adv Med 2014, 2014. 10.1155/2014/238045. [DOI] [PMC free article] [PubMed] [Google Scholar]
- (4).Yates JR; Ruse CI; Nakorchevsky A Proteomics by Mass Spectrometry: Approaches, Advances, and Applications. Annual Review of Biomedical Engineering 2009, 11 (1), 49–79. 10.1146/annurev-bioeng-061008-124934. [DOI] [PubMed] [Google Scholar]
- (5).Zhang Y; Fonslow BR; Shan B; Baek M-C; Yates JR Protein Analysis by Shotgun/Bottom-up Proteomics. Chem Rev 2013, 113 (4), 2343–2394. 10.1021/cr3003533. [DOI] [PMC free article] [PubMed] [Google Scholar]
- (6).Shaw JB; Li W; Holden DD; Zhang Y; Griep-Raming J; Fellers RT; Early BP; Thomas PM; Kelleher NL; Brodbelt JS Complete Protein Characterization Using Top-Down Mass Spectrometry and Ultraviolet Photodissociation. J. Am. Chem. Soc. 2013, 135 (34), 12646–12651. 10.1021/ja4029654. [DOI] [PMC free article] [PubMed] [Google Scholar]
- (7).Zubarev RA; Kelleher NL; McLafferty FW Electron Capture Dissociation of Multiply Charged Protein Cations. A Nonergodic Process. J. Am. Chem. Soc. 1998, 120 (13), 3265–3266. 10.1021/ja973478k. [DOI] [Google Scholar]
- (8).Mikesh LM; Ueberheide B; Chi A; Coon JJ; Syka JEP; Shabanowitz J; Hunt DF The Utility of ETD Mass Spectrometry in Proteomic Analysis. Biochim. Biophys. Acta 2006, 1764 (12), 1811–1822. 10.1016/j.bbapap.2006.10.003. [DOI] [PMC free article] [PubMed] [Google Scholar]
- (9).Brodbelt JS Ion Activation Methods for Peptides and Proteins. Anal. Chem. 2016, 88, 30–51. [DOI] [PMC free article] [PubMed] [Google Scholar]
- (10).Sobott F; Watt SJ; Smith J; Edelmann MJ; Kramer HB; Kessler BM Comparison of CID Versus ETD Based MS/MS Fragmentation for the Analysis of Protein Ubiquitination. Journal of the American Society for Mass Spectrometry 2009, 20 (9), 1652–1659. 10.1016/j.jasms.2009.04.023. [DOI] [PubMed] [Google Scholar]
- (11).McLuckey SA Principles of Collisional Activation in Analytical Mass Spectrometry. J. Am. Soc. Mass Spectrom. 1992, 3 (6), 599–614. 10.1016/1044-0305(92)85001-Z. [DOI] [PubMed] [Google Scholar]
- (12).Paizs B; Suhai S Fragmentation Pathways of Protonated Peptides. Mass Spectrom Rev 2005, 24 (4), 508–548. 10.1002/mas.20024. [DOI] [PubMed] [Google Scholar]
- (13).Kim M-S; Zhong J; Kandasamy K; Delanghe B; Pandey A Systematic Evaluation of Alternating CID and ETD Fragmentation for Phosphorylated Peptides. PROTEOMICS 2011, 11 (12), 2568–2572. 10.1002/pmic.201000547. [DOI] [PMC free article] [PubMed] [Google Scholar]
- (14).Hart-Smith G A Review of Electron-Capture and Electron-Transfer Dissociation Tandem Mass Spectrometry in Polymer Chemistry. Analytica Chimica Acta 2014, 808, 44–55. 10.1016/j.aca.2013.09.033. [DOI] [PubMed] [Google Scholar]
- (15).Ledvina AR; Beauchene NA; McAlister GC; Syka JEP; Schwartz JC; Griep-Raming J; Westphall MS; Coon JJ Activated-Ion ETD (AI-ETD) Improves the Ability of ETD to Identify Peptides in a Complex Mixture. Anal Chem 2010, 82 (24), 10068–10074. 10.1021/ac1020358. [DOI] [PMC free article] [PubMed] [Google Scholar]
- (16).Morrison LJ; Brodbelt JS 193 Nm Ultraviolet Photodissociation Mass Spectrometry of Tetrameric Protein Complexes Provides Insight into Quaternary and Secondary Protein Topology. J. Am. Chem. Soc. 2016, 138 (34), 10849–10859. 10.1021/jacs.6b03905. [DOI] [PMC free article] [PubMed] [Google Scholar]
- (17).Sipe SN; Patrick JW; Laganowsky A; Brodbelt JS Enhanced Characterization of Membrane Protein Complexes by Ultraviolet Photodissociation Mass Spectrometry. Anal. Chem. 2020, 92 (1), 899–907. 10.1021/acs.analchem.9b03689. [DOI] [PMC free article] [PubMed] [Google Scholar]
- (18).Ly T; Julian RR Ultraviolet Photodissociation: Developments towards Applications for Mass-Spectrometry-Based Proteomics. Angewandte Chemie International Edition 2009, 48 (39), 7130–7137. 10.1002/anie.200900613. [DOI] [PubMed] [Google Scholar]
- (19).Yeh GK; Sun Q; Meneses C; Julian RR Rapid Peptide Fragmentation without Electrons, Collisions, Infrared Radiation, or Native Chromophores. J Am Soc Mass Spectrom 2009, 20 (3), 385–393. 10.1016/j.jasms.2008.10.019. [DOI] [PubMed] [Google Scholar]
- (20).Sipe SN; Brodbelt JS Impact of Charge State on 193 Nm Ultraviolet Photodissociation of Protein Complexes. Phys. Chem. Chem. Phys. 2019, 21 (18), 9265–9276. [DOI] [PMC free article] [PubMed] [Google Scholar]
- (21).Julian RR The Mechanism Behind Top-Down UVPD Experiments: Making Sense of Apparent Contradictions. J. Am. Soc. Mass Spectrom. 2017, 1–4. 10.1007/s13361-017-1721-0. [DOI] [PMC free article] [PubMed] [Google Scholar]
- (22).Thompson MS; Cui W; Reilly JP Fragmentation of Singly Charged Peptide Ions by Photodissociation at Λ=157 Nm. Angewandte Chemie International Edition 2004, 43 (36), 4791–4794. 10.1002/anie.200460788. [DOI] [PubMed] [Google Scholar]
- (23).Mehaffey MR; Sanders JD; Holden DD; Nilsson CL; Brodbelt JS Multi-Stage Ultraviolet Photodissociation Mass Spectrometry to Characterize Single Amino Acid Variants of Human Mitochondrial BCAT2. Anal Chem 2018, 90 (16), 9904–9911. 10.1021/acs.analchem.8b02099. [DOI] [PMC free article] [PubMed] [Google Scholar]
- (24).Gadkari VV; Harvey SR; Raper AT; Chu W-T; Wang J; Wysocki VH; Suo Z Investigation of Sliding DNA Clamp Dynamics by Single-Molecule Fluorescence, Mass Spectrometry and Structure-Based Modeling. Nucleic Acids Res. 2018, 46 (6), 3103–3118. 10.1093/nar/gky125. [DOI] [PMC free article] [PubMed] [Google Scholar]
- (25).Theisen A; Black R; Corinti D; Brown JM; Bellina B; Barran PE Initial Protein Unfolding Events in Ubiquitin, Cytochrome c and Myoglobin Are Revealed with the Use of 213 Nm UVPD Coupled to IM-MS. J. Am. Soc. Mass Spectrom. 2019, 30 (1), 24–33. 10.1007/s13361-018-1992-0. [DOI] [PMC free article] [PubMed] [Google Scholar]
- (26).Zhou M; Huang C; Wysocki VH Surface-Induced Dissociation of Ion Mobility-Separated Noncovalent Complexes in a Quadrupole/Time-of-Flight Mass Spectrometer. Anal. Chem. 2012, 84 (14), 6016–6023. 10.1021/ac300810u. [DOI] [PubMed] [Google Scholar]
- (27).Dixit SM; Polasky DA; Ruotolo BT Collision Induced Unfolding of Isolated Proteins in the Gas Phase: Past, Present, and Future. Curr Opin Chem Biol 2018, 42, 93–100. 10.1016/j.cbpa.2017.11.010. [DOI] [PMC free article] [PubMed] [Google Scholar]
- (28).Giles K; Pringle SD; Worthington KR; Little D; Wildgoose JL; Bateman RH Applications of a Travelling Wave-Based Radio-Frequency-Only Stacked Ring Ion Guide. Rapid Commun. Mass Spectrom. 2004, 18 (20), 2401–2414. 10.1002/rcm.1641. [DOI] [PubMed] [Google Scholar]
- (29).Wongkongkathep P; Han JY; Choi TS; Yin S; Kim HI; Loo JA Native Top-Down Mass Spectrometry and Ion Mobility MS for Characterizing the Cobalt and Manganese Metal Binding of α-Synuclein Protein. J. Am. Soc. Mass Spectrom. 2018, 29 (9), 1870–1880. 10.1007/s13361-018-2002-2. [DOI] [PMC free article] [PubMed] [Google Scholar]
- (30).Belov ME; Damoc E; Denisov E; Compton PD; Horning S; Makarov AA; Kelleher NL From Protein Complexes to Subunit Backbone Fragments: A Multi-Stage Approach to Native Mass Spectrometry. Anal. Chem. 2013, 85 (23), 11163–11173. 10.1021/ac4029328. [DOI] [PubMed] [Google Scholar]
- (31).Theisen A; Yan B; Brown JM; Morris M; Bellina B; Barran PE Use of Ultraviolet Photodissociation Coupled with Ion Mobility Mass Spectrometry To Determine Structure and Sequence from Drift Time Selected Peptides and Proteins. Anal. Chem. 2016, 88, 9964–9971. [DOI] [PubMed] [Google Scholar]
- (32).Bellina B; Brown JM; Ujma J; Murray P; Giles K; Morris M; Compagnon I; Barran PE UV Photodissociation of Trapped Ions Following Ion Mobility Separation in a Q-ToF Mass Spectrometer. Analyst 2014, 139, 6348–6351. [DOI] [PubMed] [Google Scholar]
- (33).Fellers RT; Greer JB; Early BP; Yu X; LeDuc RD; Kelleher NL; Thomas PM ProSight Lite: Graphical Software to Analyze Top-down Mass Spectrometry Data. Proteomics 2015, 15 (7), 1235–1238. 10.1002/pmic.201570050. [DOI] [PMC free article] [PubMed] [Google Scholar]
- (34).Thannhauser TW; Shen M; Sherwood R; Howe K; Fish T; Yang Y; Chen W; Zhang S A Workflow for Large-Scale Empirical Identification of Cell Wall N-Linked Glycoproteins of Tomato (Solanum Lycopersicum) Fruit by Tandem Mass Spectrometry. Electrophoresis 2013, 34 (16), 2417–2431. 10.1002/elps.201200656. [DOI] [PMC free article] [PubMed] [Google Scholar]
- (35).Helm D; Vissers JPC; Hughes CJ; Hahne H; Ruprecht B; Pachl F; Grzyb A; Richardson K; Wildgoose J; Maier SK; Marx H; Wilhelm M; Becher I; Lemeer S; Bantscheff M; Langridge JI; Kuster B Ion Mobility Tandem Mass Spectrometry Enhances Performance of Bottom-up Proteomics. Mol Cell Proteomics 2014, 13 (12), 3709–3715. 10.1074/mcp.M114.041038. [DOI] [PMC free article] [PubMed] [Google Scholar]
- (36).Roepstorff P; Fohlman J Letter to the Editors. Biomed. Mass Spectrom. 1984, 11 (11), 601. [DOI] [PubMed] [Google Scholar]
- (37).Zabuga AV; Kamrath MZ; Boyarkin OV; Rizzo TR Fragmentation Mechanism of UV-Excited Peptides in the Gas Phase. J Chem Phys 2014, 141 (15), 154309. 10.1063/1.4897158. [DOI] [PubMed] [Google Scholar]
- (38).Kelkar DA; Chattopadhyay A The Gramicidin Ion Channel: A Model Membrane Protein. Biochimica et Biophysica Acta (BBA) - Biomembranes 2007, 1768 (9), 2011–2025. 10.1016/j.bbamem.2007.05.011. [DOI] [PubMed] [Google Scholar]
- (39).DeGraan-Weber N; Ashley DC; Keijzer K; Baik M-H; Reilly JP Factors Affecting the Production of Aromatic Immonium Ions in MALDI 157 Nm Photodissociation Studies. J. Am. Soc. Mass Spectrom. 2016, 27 (5), 834–846. 10.1007/s13361-015-1329-1. [DOI] [PubMed] [Google Scholar]
- (40).Rady I; Siddiqui IA; Rady M; Mukhtar H Melittin, a Major Peptide Component of Bee Venom, and Its Conjugates in Cancer Therapy. Cancer Lett 2017, 402, 16–31. 10.1016/j.canlet.2017.05.010. [DOI] [PMC free article] [PubMed] [Google Scholar]
- (41).Girod M; Sanader Z; Vojkovic M; Antoine R; MacAleese L; Lemoine J; Bonacic-Koutecky V; Dugourd P UV Photodissociation of Proline-Containing Peptide Ions: Insights from Molecular Dynamics. J. Am. Soc. Mass Spectrom. 2015, 26 (3), 432–443. 10.1007/s13361-014-1038-1. [DOI] [PubMed] [Google Scholar]
- (42).Kim T-Y; Valentine SJ; Clemmer DE; Reilly JP Gas-Phase Conformation-Specific Photofragmentation of Proline-Containing Peptide Ions. J Am Soc Mass Spectrom 2010, 21 (8), 1455–1465. 10.1016/j.jasms.2010.04.007. [DOI] [PubMed] [Google Scholar]
- (43).Niles R; Witkowska HE; Allen S; Hall SC; Fisher SJ; Hardt M Acid-Catalyzed Oxygen-18 Labeling of Peptides for Proteomics Applications. Anal Chem 2009, 81 (7), 2804–2809. 10.1021/ac802484d. [DOI] [PMC free article] [PubMed] [Google Scholar]
- (44).Roe MR; McGowan TF; Thompson LV; Griffin TJ Targeted 18O-Labeling for Improved Proteomic Analysis of Carbonylated Peptides by Mass Spectrometry. Journal of the American Society for Mass Spectrometry 2010, 21 (7), 1190–1203. 10.1016/j.jasms.2010.03.029. [DOI] [PMC free article] [PubMed] [Google Scholar]
- (45).Castillo MJ; Reynolds KJ; Gomes A; Fenselau C; Yao X Quantitative Protein Analysis Using Enzymatic [18O]Water Labeling. Curr Protoc Protein Sci 2014, 76, 23.4.1–23.4.9. 10.1002/0471140864.ps2304s76. [DOI] [PMC free article] [PubMed] [Google Scholar]
- (46).Dongre AR; Jones JL; Somogyi A; Wysocki Vicki H. Influence of Peptide Composition, Gas-Phase Basicity, and Chemical Modification on Fragmentation Efficiency: Evidence for the Mobile Proton Model. J. Am. Chem. Soc. 1996, 118 (35), 8365–8374. [Google Scholar]
- (47).Laskin J; Bailey TH; Denisov EV; Futrell JH On the Relative Stability of Singly Protonated Des-Arg1 and Des-Arg9 Bradykinin. J. Phys. Chem. A 2002, 106 (42), 9832–9836. 10.1021/jp025604z. [DOI] [Google Scholar]
- (48).Pratihar S; Barnes GL; Laskin J; Hase WL Dynamics of Protonated Peptide Ion Collisions with Organic Surfaces: Consonance of Simulation and Experiment. J. Phys. Chem. Lett. 2016, 7 (16), 3142–3150. 10.1021/acs.jpclett.6b00978. [DOI] [PubMed] [Google Scholar]
- (49).Zhou M Incorporation of Surface Induced Dissociation into a Commercial Ion Mobility – Tandem Mass Spectrometer and Application of Mass Spectrometry Methods for Structural Analysis of Non-Covalent Protein Complexes, The Ohio State University, 2013. [Google Scholar]
Associated Data
This section collects any data citations, data availability statements, or supplementary materials included in this article.