
PLOS One logoLink to PLOS One
. 2021 May 17;16(5):e0251808. doi: 10.1371/journal.pone.0251808

Does varying the ingestion period of sodium citrate influence blood alkalosis and gastrointestinal symptoms?

Charles S Urwin 1,*, Rodney J Snow 2, Liliana Orellana 3, Dominique Condo 1,2, Glenn D Wadley 2, Amelia J Carr 1
Editor: Lars McNaughton4
PMCID: PMC8128256  PMID: 33999939

Abstract

Objectives

To compare blood alkalosis, gastrointestinal symptoms and indicators of strong ion difference after ingestion of 500 mg.kg-1 BM sodium citrate over four different periods.

Methods

Sixteen healthy and active participants ingested 500 mg.kg-1 BM sodium citrate in gelatine capsules over a 15, 30, 45 or 60 min period using a randomized cross-over experimental design. Gastrointestinal symptoms questionnaires and venous blood samples were collected before ingestion, immediately post-ingestion, and every 30 min for 480 min post-ingestion. Blood samples were analysed for blood pH, [HCO3-], [Na+], [Cl-] and plasma [citrate]. Linear mixed models were used to estimate the effect of the ingestion protocols.

Results

For all treatments, blood [HCO3-] was significantly elevated above baseline for the entire 480 min post-ingestion period, and peak occurred 180 min post-ingestion. Blood [HCO3-] and pH were significantly elevated above baseline and not significantly below the peak between 150–270 min post-ingestion. Furthermore, blood pH and [HCO3-] were significantly lower for the 60 min ingestion period when compared to the other treatments. Gastrointestinal symptoms were minor for all treatments; the mean total session symptoms ratings (all times summed together) were between 9.8 and 11.6 from a maximum possible rating of 720.

Conclusion

Based on the findings of this investigation, sodium citrate should be ingested over a period of less than 60 min (15, 30 or 45 min), and completed 150–270 min before exercise.

Introduction

Athletes competing in events of short-duration and high-intensity can limit the potentially deleterious effects of blood acidosis by ingesting buffering agents (such as sodium citrate and sodium bicarbonate) that induce blood alkalosis (a significant increase in blood pH and blood bicarbonate concentration ([HCO3-])) prior to exercise [13]. These dietary supplements have been reported to induce some gastrointestinal (GI) disturbances [46], but it has been proposed that sodium citrate may induce fewer GI symptoms than sodium bicarbonate [7, 8]. A recent investigation identified that sodium citrate was indeed associated with reduced GI disturbances compared to sodium bicarbonate when the supplements were ingested at the same dose (300 mg.kg-1 BM) [8]. These findings provide preliminary evidence that sodium citrate may be a preferred alkalising agent from a GI disturbance perspective.

While buffering agent ingestion is typically undertaken with the intent of improving subsequent exercise performance, equivocal effects on exercise performance have been reported after sodium citrate supplementation [911]. A recent review identified that an ergogenic benefit was more frequently reported when completing short-duration (> 60 s and < 420 s) and very high-intensity exercise (> 100% VO2max) compared to longer-duration exercise of any intensity [12]. Performance of an all-out or high-intensity exhaustive effort at the end of endurance exercise has also been reportedly improved by supplementation with sodium citrate [13, 14]. Other equivocal performance outcomes may be partially attributed to sub-optimal ingestion protocols, where supplementation failed to maximise blood alkalosis or was associated with excessive GI symptoms prior to the commencement of exercise, relative to other ingestion protocols [12].

Based on the induced blood alkalosis and gastrointestinal symptoms reported in prior dose-response investigations, sodium citrate is recommended to be ingested at a dose of 500 mg.kg-1 body mass (BM) [4, 15]. Ingestion in gelatine capsules rather than in solution is recommended to maximise blood alkalosis and palatability (i.e. participant preference) [16]. While sodium citrate dose and ingestion mode are somewhat established, no prior investigation has assessed the effect of the ingestion period (i.e. the time taken to complete ingestion of the entire dose of the supplement) on subsequent blood alkalosis, GI symptoms or palatability. The combined effect of a specific dose, mode and period of sodium citrate supplementation may also contribute to the suggested timing of ingestion (relative to the onset of exercise) required for performance benefit. Currently, sodium citrate supplementation is recommended to take place at least 180 min before the onset of exercise [4, 16], but changed physiological responses, palatability or GI symptoms according to the duration of the ingestion period have yet to be established.

A 30 min ingestion period has been most frequently implemented in sodium citrate investigations [4, 1720], with blood alkalosis regularly induced. Shorter (5 to 10 min [13, 2124]) and longer (90 to 150 min [2527]) ingestion periods have also been trialled across investigations, although both extremes present challenges in practice. Short ingestion periods may not allow sufficient time to ingest the number of capsules required to meet the recommended dose (~ 36 capsules per session in a prior investigation [16]), while longer periods could incur greater disruption to athletes’ event preparation. The extent to which a particular sodium citrate ingestion period is feasible for athlete implementation may also vary according to GI symptoms and palatability.

No prior sodium citrate investigation has monitored blood alkalosis for more than 240 min post-ingestion, with previously reported maximum alkalosis values occurring between 180 and 210 min after ingestion [4, 16]. Further examination of post-ingestion blood alkalosis for more than 240 minutes may allow more precise recommendations regarding the timing of sodium citrate supplementation in relation to the commencement of exercise. It has been proposed that a 6 mmol.L-1 increase in blood [HCO3-] following buffering agent ingestion may increase the likelihood of observing an ergogenic benefit [11, 28, 29]. However, it is unknown for how long elevated blood [HCO3-] remains above the 6 mmol.L-1 threshold following sodium citrate ingestion, adding to the requirement for an extended post-ingestion observation period. Extending this post-ingestion observation period to 480 min would double the time explored by prior investigations, and may be sufficient to observe the full time interval where blood alkalosis remains elevated following sodium citrate supplementation.

Sodium citrate supplementation likely induces blood alkalosis via alterations to strong ion difference (SID) [30, 31], but this has yet to be directly established. Changes in blood sodium ([Na+]), blood chloride ([Cl-]) and plasma citrate concentrations ([citrate]) can represent the balance between the rate of entry into and removal from the circulation of these ions following sodium citrate supplementation, providing an indication as to changes in SID.

The primary aim of this investigation was therefore to examine the effect of four different ingestion periods (15, 30, 45 and 60 min) of 500 mg.kg-1 BM sodium citrate on blood alkalosis (peak and time to peak for blood pH and [HCO3-]) over an extended (480 min) post-ingestion period. Secondary aims were to establish the effect of sodium citrate ingestion period on blood [Na+], blood [Cl-], plasma [citrate], GI symptoms, and palatability.

Methods

Participants

Healthy participants (n = 16; 8 males and 8 females; mean ± standard deviation for age, 25.4 ± 4.7 years; body mass, 68.3 ± 12.7 kg; height, 1.73 m ± 0.11 m; VO2peak, 46.0 ± 6.0 mL.kg.min-1) were recruited. Eligibility was assessed via a health status questionnaire, with individuals excluded if they reported any history of kidney disease or the use of medication that can modify blood acidity regulation. Participants were informed verbally and in writing of the nature of the investigation, including potential risks, and signed a written informed consent statement prior to testing. The Deakin University Human Research Ethics Committee approved all protocols (2018–257).

Study design overview

For each participant, assessment of maximal aerobic capacity (VO2peak), height and body mass was completed a minimum of three days prior to the first experimental testing session. VO2peak was determined as previously described by Urwin et al. [16], using an incremental increase in cycling intensity to volitional fatigue. These respiratory data were used to categorise participants as “healthy” or “physically fit” according to previously used nomenclature [32]. Participants were randomly allocated to a sequence of four ingestion periods (15, 30, 45 and 60 min ingestion periods) using a counter-balanced, crossover design. On the two days immediately before the first session, 24-hour food and activity diaries were completed by participants, with details of all food and fluid ingested, as well as the type, intensity and duration of exercise completed. On the day prior to the first session, eight of sixteen participants collected all excreted urine over an eight hour period in a provided container (pre-testing urine), which was kept refrigerated (at approximately 4° C), and delivered to the researcher upon arrival at the first session. Participants were required to commence the urine collection period immediately after voiding the bladder, starting at the same time of day as the subsequent sessions (e.g. 8:00 am). Participants avoided alcohol consumption and standardised their caffeine consumption for the 24 hours prior to each session, with adherence checked by a member of the research team. Participants arrived at the laboratory following an overnight fast that commenced at 10:00 pm the night before each session. The mean (± SD) number of days between sessions (washout period) was 5.9 (± 2.8) days.

Experimental testing sessions

Participants ingested 500 mg.kg-1 BM sodium citrate (34.2 ± 6.3 capsules per participant) in size 0 gelatine capsules (Melbourne Food Ingredient Depot, Melbourne, Australia) with 750 mL of a chilled sports drink (Powerade, Coca Cola, USA), prepared according to manufacturer instructions. Ingestion periods between sessions were 15, 30, 45 or 60 min. During the ingestion period, participants also consumed a standardised meal, comprising 1.75 g.kg-1 BM of carbohydrate [3336], including 750 mL of sports drink, bread, jam, bananas and muesli bars. According to manufacturer packaging, the co-ingested meals (including Powerade) contained a total of approximately 2 g of sodium, representing 18% of the total ingested sodium (given that approximately 9 g sodium was ingested as sodium citrate). The amount of citrate in the co-ingested meal is unknown as it is not listed on the manufacturers packaging nor included in Australian food databases due to the small amounts in the food supply, therefore the amount is likely negligible.

To ensure standardised ingestion, the capsules, drinks and meals were provided to participants in three equal portions throughout the ingestion period; at commencement, halfway through, and at the end. Participants remained seated for the next 480 min, and a second meal was provided 240 min after completion of sodium citrate ingestion, comprising the same foods, quantities and carbohydrate content as the initial co-ingested meal.

Tissue collection and analysis

Blood samples were collected via a cannula inserted in the antecubital vein. At baseline, immediately following the completion of ingestion, and then every 30 min for 480 min following the completion of ingestion, 1 mL of blood was drawn into a safePICO syringe (Radiometer, Copenhagen, Denmark), which was immediately analysed for blood pH, [HCO3-], [Na+] and [Cl-] using an ABL800Flex Blood-Gas Analyser (Radiometer, Copenhagen, Denmark). Another 4 mL of blood was drawn into a lithium-heparin coated vacutainer tube (McFarlane Medical, Melbourne, Australia) which was immediately centrifuged at 1,300 rpm for 10 min at 4°C, after which the plasma was stored at -80 °C. Subsequently, the plasma (100 μL) was deproteinised in 50 μL of 1.5 M perchloric acid and neutralised by addition of 37 μL of 2.1 M KHCO3 before being analysed for [citrate] using an enzymatic fluorometric assay [37, 38]. The intra-assay percentage coefficient of variation (%CV) for a mid-range citrate standard solution (i.e. 250μM) was 3.4%, and the inter-assay %CV was 10.3%.

Participants voided their bladder immediately before beginning sodium citrate ingestion. For the duration of each session (from the commencement of sodium citrate ingestion to 480 min post-ingestion), all excreted urine was collected and the volume (mL) assessed using a measuring cylinder. After mixing, a 1 mL aliquot of urine was obtained and stored at -80 °C until analysed for urinary [citrate] using the same method as for plasma. From urine volume and urinary [citrate] (μmol.L-1), total excreted citrate (mg) was calculated.

Validated questionnaires/scales

Participants completed GI symptoms questionnaires [39] at the same time-points as blood sampling. The severity of 10 GI symptoms (nausea, vomiting, bloating, abdominal cramps, early satiety, heartburn, sickness, loss of appetite, retrosternal discomfort, and upper abdominal pain) were rated on a 5-point Likert-type scale from 0 = no problem, to 4 = very severe problem. Palatability was quantified using a scale of participant preference immediately after completion of ingestion [40], with participants rating the extent to which they liked ingesting sodium citrate on a 9-point Hedonic scale from 1 = dislike extremely to 9 = like extremely.

Statistical analyses

Longitudinal measurements of blood variables were assessed using linear mixed models (LMM) including participant as a random effect, and fixed effects: treatment (ingestion period, four levels), time as a categorical variable (18 levels; baseline and 0 to 480 min post-ingestion at 30 min intervals), the interaction treatment by time and the order in which each treatment was administered. These LMM estimates were used to obtain the peak (gPeak; the maximum mean value as ascertained from cumulative group data, rather than for each participant in each individual session); time to gPeak (min; the time interval from the completion of ingestion to gPeak); and the time interval where mean values were significantly different from baseline but not significantly different from gPeak. This interval was estimated simultaneously for all treatments when the interaction was non-significant but also for the four treatments individually as an exploratory analysis. The same approach was used for minimum blood [Cl-] (gMin, time to gMin). A blood [HCO3-] increase of 6 mmol.L-1 has been suggested to increase the likelihood of an ergogenic benefit [11, 28, 41], therefore a time interval comprising those times where the lower limit of the 95% confidence interval (CI) for delta blood [HCO3-] exceeded this threshold was estimated.

The longitudinal data of each individual session were also summarised as follows: i) A smooth curve was fitted using a cubic spline function with B-spline bases and one knot [42], and the curve used to calculate: a) peak (iPeak; the maximum of the predicted values (minimum for blood [Cl-] (iMin)), as ascertained for each participant during each individual session); b) change from baseline to iPeak or iMin (iDelta); and c) time to iPeak or iMin measured from the completion of ingestion; ii) Area under the curve (AUC) for each session was determined using the trapezoidal method on the raw data. These four summary measures were compared using LMMs with treatment as a fixed effect and participant as a random effect. The same LMM was used to compare palatability, urine volume excreted and urinary [citrate].

Gastrointestinal symptoms data displayed minimal variability, and was summarised as: a) sum of the rating of all symptoms at each time point (range 0–40; 10 symptoms each ranging from 0–4); b) total session GI symptoms rating calculated as the sum of the rating of all symptoms at all time points (range 0–720; 18 time points, maximum of 40 at each time point); c) number of participants that reported each symptom at any time point. The sum of all symptoms (a) and the total session rating (b) were reported as mean and range. Stata v15 was used for all analyses. Results were considered statistically significant when p ≤ 0.05.

Results

Pattern over time

A main effect for time was detected in that all four treatments produced an increase in blood pH, [HCO3-], [Na+] and a decrease in blood [Cl-] from baseline (Figs 1A, 1C, 2A and 2C). A main effect for treatment was detected for blood pH, [HCO3-], [Na+] and [Cl-] (Table 1), with the respective pairwise comparisons of this effect displayed in S1 Table. No time by treatment interaction effects were detected for these blood variables (Figs 1B, 1D, 2B and 2D). There was a higher blood pH with the 15 min ingestion period compared with the 30, 45 and 60 min ingestion periods (Table 1). A higher blood [HCO3-] was detected for the 15 and 45 min ingestion periods when compared with the 60 min ingestion period (Table 1). There was a lower blood [Na+] with the 30 min ingestion period when compared to the 60 min ingestion period, and a lower blood [Cl-] with the 15 min ingestion period when compared to the 60 min ingestion period. Ingestion period (treatment) altered the pattern over time for plasma [citrate] (Fig 2E, p = 0.0324, time by treatment interaction), with the 15 min ingestion period associated with greater plasma [citrate] than other ingestion periods from 180 to 240 min post-ingestion.

Fig 1. Blood pH and blood [HCO3-] after 500 mg.kg-1 BM sodium citrate ingestion.
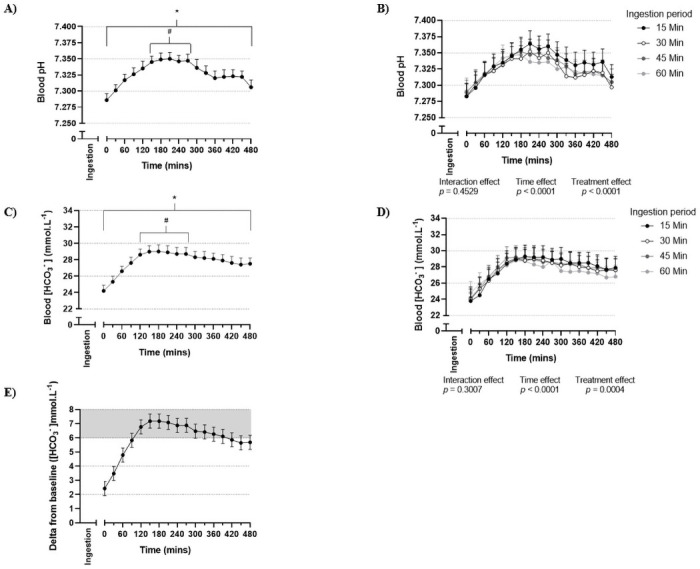
Fig 1

(A) Blood pH irrespective of ingestion period (n = 16 participants, 4 sessions per participant, 64 total observations). (B) Blood pH following the completion of ingestion of sodium citrate over 15, 30, 45 or 60 min (n = 16 participants per ingestion period). (C) Blood [HCO3-] (mmol.L-1) irrespective of ingestion period (n = 16 participants, 4 sessions per participant, 64 total observations). (D) Blood [HCO3-] (mmol.L-1) following the completion of ingestion of sodium citrate over 15, 30, 45 or 60 min (n = 16 participants per ingestion period). (E) Delta blood [HCO3-] (mmol.L-1) irrespective of ingestion period (n = 16 participants, 4 sessions per participant, 64 total observations). Values are mean and 95% confidence intervals. Zero (0) value on the x-axis corresponds to the completion of sodium citrate ingestion. Grey (shaded) area in (E) indicates 6 mmol.L-1 above baseline. * elevated (p < 0.05) compared to baseline. # time interval where values are above baseline (p < 0.05) and not below gPeak (the maximum mean value, as ascertained from cumulative group data; p > 0.05).

Fig 2. Blood [Na+], blood [Cl-] and plasma [citrate] after 500 mg.kg-1 BM sodium citrate ingestion.
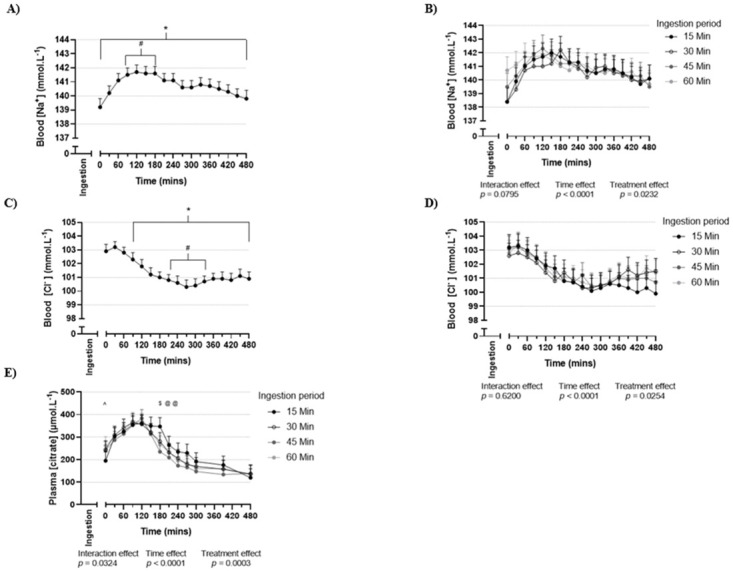
Fig 2

(A) Blood [Na+] (mmol.L-1) irrespective of ingestion period (n = 16 participants, 4 sessions per participant, 64 total observations). (B) Blood [Na+] (mmol.L-1) following the completion of ingestion of sodium citrate over 15, 30, 45 or 60 min (n = 16 participants per ingestion period). (C) Blood [Cl-] (mmol.L-1) irrespective of ingestion period (n = 16 participants, 4 sessions per participant, 64 total observations). (D) Blood [Cl-] (mmol.L-1) following the completion of ingestion of sodium citrate over 15, 30, 45 or 60 min (n = 16 participants per ingestion period). (E) Plasma [citrate] (μmol.L-1) following the completion of ingestion of sodium citrate over 15, 30, 45 or 60 min (n = 16 participants per ingestion period). Values are mean and 95% confidence intervals. Zero (0) value on the x-axis corresponds to the completion of sodium citrate ingestion. * elevated (p < 0.05) compared to baseline. # time interval where values are above baseline (p < 0.05) and not below gPeak (the maximum mean value, as ascertained from cumulative group data; p > 0.05). $ difference (p < 0.05) between 15 min all other ingestion periods. @ difference (p < 0.05) between 15 min and 45 min ingestion period. ^ difference (p < 0.05) between 15 min and 60 min ingestion period. gPeak for blood [Na+] occurred 120 min post-ingestion (A), gMin occurred 270 min post-ingestion for blood [Cl-] (C).

Table 1. Mean (95% confidence intervals) of the treatment effect for post-ingestion session values for blood variables (pH, [HCO3-], [Na+] and [Cl-]) following ingestion of 500 mg.kg-1 BM sodium citrate (n = 16 participants, 18 observations per participant per treatment).

15 min 30 min 45 min 60 min Treatment effect
ingestion period ingestion period ingestion period ingestion period (p value)
Blood pH 7.330 (7.325, 7.336) 7.318 (7.313, 7.324) a 7.321 (7.315, 7.327) a 7.321 (7.315, 7.326) a < 0.0001
Blood [HCO3-] (mmol.L-1) 27.7 (27.3, 28.0) 27.4 (27.0, 27.8) 27.4 (27.0, 27.8) 27.1 (26.7, 27.6) a d 0.0004
Blood [Na+] (mmol.L-1) 140.6 (140.3, 140.9) 140.3 (140.0, 140.6) c 140.6 (140.3, 140.8) 140.7 (140.5, 141.0) 0.0232
Blood [Cl-] (mmol.L-1) 101.3 (101.0, 101.5) 101.4 (101.1, 101.7) 101.4 (101.2, 101.6) 101.6 (101.4, 101.8) b 0.0254

Estimates obtained under a linear mixed model including participants as a random effect and fixed effects: treatment, time (categorical), time by treatment interaction. Estimates are presented only for blood variables with a non-significant interaction effect.

a 15-min ingestion period greater than compared ingestion period.

b 15-min ingestion period lower than compared ingestion period.

c 60-min ingestion period greater than compared ingestion period.

d 45-min ingestion period greater than compared ingestion period.

Baseline, peak and time to peak

No differences were detected between treatments for baseline values prior to sodium citrate ingestion for any blood variable (Tables 2 and 3). The overall time to gPeak was 210 min for blood pH (Fig 1A), 180 min for blood [HCO3-] (Fig 1D), 120 min for blood [Na+] (Fig 2A), and 270 min for gMin for blood [Cl-] (Fig 2D). The time interval where mean values were not significantly different from gPeak was 150–270 min for blood pH, and 120–270 min for blood [HCO3-]. The time interval where blood [HCO3-] significantly exceeded 6 mmol.L-1 above baseline was 120–270 min (Fig 1E). No differences by treatment were detected for iPeak or iDelta for any variable (Tables 2 and 3, S2 and S3 Tables). Time to iPeak for blood pH occurred earlier for the 60 min ingestion period compared to the 15 and 45 min ingestion periods (Table 2, for pairwise comparisons see S2 Table). Time to iPeak for blood [HCO3-] occurred earlier for the 45 min ingestion period compared to the 15 min ingestion period (Table 2 and S2 Table).

Table 2. Estimates of curve characteristics for blood pH and blood bicarbonate concentration ([HCO3-]) following ingestion of 500 mg.kg-1 BM sodium citrate over 15, 30, 45 or 60 min (n = 16 participants per treatment).

15 min 30 min 45 min 60 min
ingestion period ingestion period ingestion period ingestion period
Blood pH
Baseline ^ 7.256 (7.230, 7.282) 7.248 (7.222, 7.273) 7.234 (7.208, 7.259) 7.243 (7.218, 7.269)
iPeak ^ 7.357 (7.348, 7.366) 7.352 (7.343, 7.361) 7.361 (7.352, 7.371) 7.351 (7.342, 7.360)
iDelta ^ 0.112 (0.102, 0.121) 0.107 (0.098, 0.116) 0.116 (0.107, 0.126) 0.106 (0.097, 0.115)
Time to iPeak (min) ^ 240 (201, 279) a 225 (186, 264) 241 (203, 281) a 167 (128, 206)
Area under the curve ^ 3521 (3513, 3530) 3516 (3507, 3524) 3517 (3509, 3526) 3517 (3509, 3525)
Time interval (min)# 180–270 150–270 150–300 150–270
Blood bicarbonate concentration ([HCO3-])
Baseline (mmol.L-1) ^ 22.0 (20.8, 23.3) 22.1 (20.9, 23.3) 21.5 (20.3, 22.7) 21.5 (20.3, 22.7)
iPeak (mmol.L-1) ^ 29.6 (28.6, 30.5) 29.3 (28.3, 30.2) 29.7 (28.7, 30.6) 29.2 (28.3, 30.2)
iDelta (mmol.L-1) ^ 7.8 (6.8, 8.7) 7.5 (6.5, 8.4) 7.9 (7.0, 8.9) 7.4 (6.5, 8.4)
Time to iPeak (min) ^ 251 (203, 300) 242 (194, 290) 182 (134, 230) b 231 (182, 279)
Area under the curve ^ 13504 (12861, 14146) 13339 (12696, 13981) 13386 (12744, 14028) 13238 (12595, 13880)
Time interval (min) # 120–390 120–330 120–360 120–270

^ mean (95% confidence interval), estimated under a linear mixed model (LMM) including treatment as fixed effect and participant as random effect.

calculated from a smoothed curve for each participant during each individual session.

# time points where values were greater than baseline (p < 0.05) and not below gPeak (p > 0.05), estimated under a LMM including treatment, time (categorical) and their interaction. iPeak (the maximum value from each individual session); iDelta (change from baseline to iPeak); Time to iPeak (from completion of ingestion to iPeak).

a different (p < 0.05) from 60 min ingestion period.

b different (p < 0.05) from 15 min ingestion period.

Table 3. Estimates of curve characteristics for blood sodium ([Na+]), blood chloride ([Cl-]) and plasma citrate ([citrate]) following ingestion of 500 mg.kg-1 BM sodium citrate over a 15, 30, 45 or 60 min period (n = 16 participants per treatment).

15 min 30 min 45 min 60 min
ingestion period ingestion period ingestion period ingestion period
Blood sodium concentration ([Na+])
Baseline (mmol.L-1) ^ 137.9 (136.8, 139.1) 137.0 (135.8, 138.2) 137.3 (136.1, 138.4) 137.9 (136.8, 139.1)
iPeak (mmol.L-1) ^ 142.2 (141.6, 142.9) 142.3 (141.6, 143.0) 142.6 (142.0, 143.3) 142.2 (141.5, 142.8)
iDelta (mmol.L-1) ^ 4.7 (4.1, 5.4) 4.8 (4.1, 5.4) 5.1 (4.4, 5.7) 4.6 (4.0, 5.3)
Time to iPeak (min) ^ 210 (151, 269) 193 (134, 252) 180 (121, 239) 139 (80, 198)
Area under the curve ^ 67607 (67244, 67971) 67493 (67129, 67856) 67603 (67239, 67966) 67662 (67298, 68025)
Time interval (min) # 60–240 150–210 90–150 30–270
Blood chloride concentration ([Cl-])
Baseline (mmol.L-1) ^ 103.0 (102.0, 104.0) 102.9 (101.8, 103.9) 102.4 (101.3, 103.4) 103.4 (102.4, 104.5)
iPeak (mmol.L-1) ^ 99.4 (98.7, 100.0) 100.2 (99.6, 100.9) 100.2 (99.5, 100.9) 99.8 (99.2, 100.5)
iDelta (mmol.L-1) ^ -3.6 (4.2, -2.9) -2.7 (-3.3, -2.0) -2.7 (-3.4, -2.0) -3.1 (-3.8, -2.4)
Time to iPeak (min) ^ 394 (338, 449) 296 (241, 352) a 308 (252, 363) a 289 (233, 344) a
Area under the curve ^ 48546 (48195, 48896) 48614 (48263, 48964) 48632 (48282, 48983) 48709 (48359, 49060)
Time interval (min) # 180–480 150–420 150–480 150–480
Plasma citrate concentration ([citrate])
Baseline (μmol.L-1) ^ 141.8 (121.6, 162.0) 131.3 (110.2, 152.4) 130.5 (110.2, 150.7) 129.2 (109.0, 149.4)
iPeak (μmol.L-1) ^ 426.5 (386.9, 466.1) 419.0 (378.2, 459.8) 408.6 (369.2, 448.0) 432.9 (393.5, 472.3)
iDelta (μmol.L-1) ^ 293.4 (253.9, 333.0) 285.9 (245.1, 326.7) 275.5 (236.1, 314.9) 299.8 (260.4, 339.2)
Time to iPeak (min) ^ 122 (100, 144) 105 (83, 127) 105 (83, 127) 99 (77, 122)
Area under the curve ^ 118653 (106058, 131249) 111434 (98839, 124030) 103743 (91148, 116339) 111632 (98945, 124319)
Time interval (min) # 60–180 60–120 90–120 90–120

^ mean (95% confidence interval), estimated under a linear mixed model (LMM) including treatment as fixed effect and participant as random effect.

calculated from a smoothed curve for each participant during each individual session.

# time points where values were greater than baseline (p < 0.05) and not below gPeak (p > 0.05), estimated under a LMM including treatment, time (categorical) and their interaction. iPeak (the maximum value from each individual session); iDelta (change from baseline to iPeak); Time to iPeak (from completion of ingestion to iPeak). A different (p < 0.05) from 15 min ingestion period.

Gastrointestinal symptoms and palatability

The total session mean GI symptoms ratings (scale 0–720) ranged from 9.8 (60 min ingestion period) to 11.6 (15 min ingestion period) (Table 4). Mean GI symptoms (rating) did not exceed 1.2 out of a maximum of 40 at any given measurement time (Fig 3A). The most frequently reported symptoms (irrespective of severity) were sickness and nausea, reported by between four and six of 16 participants per session (Fig 3C). No differences were detected between treatments for palatability (score) (Table 4 and S4 Table).

Table 4. Gastrointestinal symptoms (rating, n = 16 participants), palatability (score, n = 16 participants) and urinary excretion values (n = 8 participants) following ingestion of 500 mg.kg-1 BM sodium citrate over 15, 30, 45 or 60 min.

Additional measures 15 min 30 min 45 min 60 min
ingestion period ingestion period ingestion period ingestion period
Gastrointestinal symptoms
Total session gastrointestinal symptoms rating (mean, range) 11.6 (0–66) 9.9 (0–37) 10.4 (0–72) 9.8 (0–50)
Palatability
Palatability score 5.3 (4.4–6.1) 5.9 (5.0–6.7) 5.4 (4.5–6.2) 5.5 (4.7–6.3)
(mean, 95% confidence intervals)
Urinary excretion
Urinary [citrate] (μmol.L-1) 3360.6 (2695.8–4025.3) 3223.4 (2558.6–3888.1) 3184.0 (2519.2–3848.7) 3305.8 (3641.0–3970.5)
Total excreted citrate (mg) 660.3 (518.0–802.7) 724.2 (581.9–866.5) 621.3 (479.0–763.6) 687.9 (545.6–830.2)
Delta excreted citrate 401.9 (222.4–581.5) 465.8 (286.3–645.4) 362.9 (183.4–542.5) 429.5 (250.0–609.1)
(total excreted citrate minus pre-testing citrate (mg))
Total urine excreted (mL) 1113.8 (703.9–1523.8) 1302.0 (892.0–1712.0) 1254.5 (844.6–1664.5) 1247.4 (837.4–1657.3)

For total session gastrointestinal symptoms rating, the maximum possible value was a rating of 720 (maximum of 40 at each time point, across 18 time points). For palatability score, the maximum possible value was a score of 9.

Fig 3. Gastrointestinal symptoms after 500 mg.kg-1 BM sodium citrate ingestion.
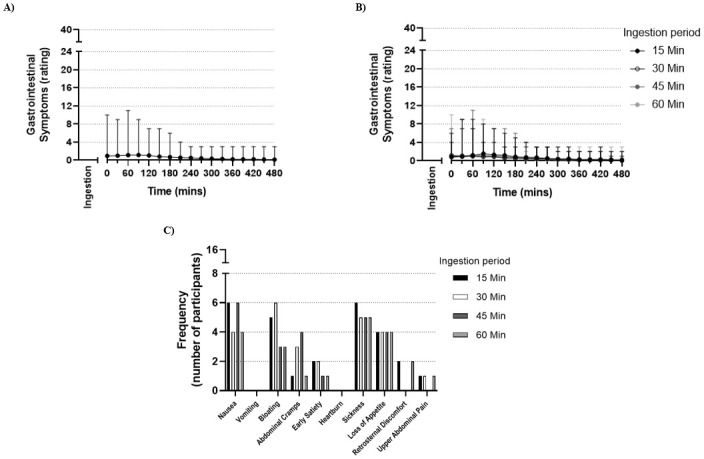
Fig 3

(A) Mean and range of gastrointestinal symptoms (rating) following completion of ingestion of sodium citrate, with a maximum possible rating of 40 at each time-point, irrespective of ingestion period (n = 16 participants, 4 sessions per participant, 64 total observations). (B) Mean and range of gastrointestinal symptoms (rating) following completion of ingestion of sodium citrate over 15, 30, 45 or 60 min, with a maximum possible rating of 40 at each time-point (n = 16 participants per ingestion period). (C) Frequency of each gastrointestinal symptom reported by all participants after ingestion of sodium citrate over 15, 30, 45 or 60 min (n = 16 participants). For both (A) and (B), zero (0) value on the x-axis corresponds to the completion of sodium citrate ingestion.

Urinary excretion

Mean pre-testing total urine volume was 1298 mL (95% CI: 889, 1706). There were no differences in total urine volume across treatments (Table 4), or between pre-testing urine collection and any of the sodium citrate treatments. The (mean, 95% CI) pre-testing excreted urinary citrate mass was 258.4 mg (117.2, 399.6). There was an increase in the amount of citrate excreted with all four sodium citrate treatments, with mean delta values ranging between 362.9 and 465.8 mg (Table 4).

Discussion

The primary aim of this investigation was to compare the effect of varying sodium citrate ingestion periods (15, 30, 45 and 60 min) on blood alkalosis and GI symptoms. A key finding of this investigation was that ingestion of 500 mg.kg-1 BM sodium citrate in gelatine capsules across a 60 min period was associated with a lower level of blood alkalosis (both blood pH and [HCO3-]) when compared to shorter ingestion periods. Blood alkalosis peaked at 180 (blood [HCO3-]) and 210 (blood pH) min after ingestion, and remained elevated above baseline for at least 480 min. Additionally, alkalosis (combining blood [HCO3-] and pH results) was both above baseline and not below the peak from 150–270 min after ingestion. The sodium citrate ingestion period did not impact palatability, and the mean reported GI symptoms were minor for all ingestion protocols at all times.

Induced blood alkalosis

In the current investigation, the 30, 45 and 60 min ingestion periods were associated with a small, but significantly lower blood pH (~0.01 pH or 1 nmol.L-1) when compared to the 15 min ingestion period, despite the identical sodium citrate dose and mode in each treatment. The 60 min ingestion period was associated with a mean session blood [HCO3-] of 27.1 mmol.L-1, compared to 27.7 mmol.L-1 for the 15 min ingestion period. While statistically significant, this mean difference of 0.6 mmol.L-1 is similar in magnitude to that of the width of the 95% confidence intervals for each treatment. Therefore, although statistical differences for blood alkalosis were detected when comparing treatments in some analyses, the small absolute size of these differences may suggest limited clinical differences with regards to blood alkalosis responses across treatments. Blood [HCO3-] did not differ between the 15, 30 and 45 min ingestion periods, but blood pH was slightly lower in the latter two treatments compared with the 15 min ingestion period. Overall, it can therefore be concluded that ingesting sodium citrate over a 15, 30 or 45 min period may be associated with a similar or greater total blood alkalosis response than for a 60 min ingestion period. When considering both blood pH and [HCO3-] as components of blood alkalosis, there is little difference between the 15, 30 and 45 min ingestion periods, suggesting that any of these three protocols could be recommended on the basis of the findings from this study.

Blood pH and [HCO3-] were elevated above baseline immediately post-ingestion and for the entire 480 min post-ingestion period. Prior investigations had undertaken post-ingestion observation periods with a duration of up to 240 min [4, 16], therefore the complete time interval where induced blood alkalosis was significantly elevated (beyond 240 min post-ingestion) was unknown. The time to iPeak for blood pH and/or [HCO3-] was significantly earlier when supplementation occurred over a longer period (i.e. 45 or 60 min). This is likely explained by the earlier relative timing of the first exposure to the supplement in the longer periods, as the 60 min ingestion period received the first sub-dose of the supplement 45 min earlier than the 15 min ingestion period and so on. This effect may be considered similar to that previously reported within the sodium bicarbonate literature, when comparing gelatine capsules to delayed-release capsules. Delayed-release or enteric-coated capsules have been reported to delay the occurrence of peak blood alkalosis when compared to gelatine capsules (by approx. 20–24 min [43, 44]) in a similar fashion to that seen when comparing the 15 and 60 min ingestion periods in the current investigation (by approx. 20 min). Peak blood alkalosis was observed at approximately similar times when assessed via gPeak (180–210 min post-ingestion) or iPeak (167–251 min post-ingestion), both consistent with findings from a prior investigation which implemented the same sodium citrate dose and mode of ingestion [16].

An increase in blood [HCO3-] exceeding 6 mmol.L-1 may increase the likelihood of improved exercise performance following ingestion of buffering agents [11, 28]. In the current investigation, a 6 mmol.L-1 increase equated to a time period from 120–270 min post-ingestion, irrespective of the ingestion period. It must be acknowledged that no study has established the threshold upon which the blood [HCO3-] must increase to improve high-intensity exercise performance following ingestion of sodium citrate. As such, a time interval within which blood [HCO3-] is elevated above baseline, but not below the peak may be of relevance. In the current investigation, this was observed from 120–270 min post-ingestion, matching the time interval for the 6 mmol.L-1 threshold. Whether there is an ideal time to commence exercise within this 150 min time interval has yet to be determined. Experimental results from the sodium bicarbonate literature have suggested that commencing exercise in correspondence with individual peak blood alkalosis is associated with greater performance benefit than using a post-ingestion timing that is standardised across all participants or athletes [28]. However, the poor intra-individual reliability of time to peak blood [HCO3-] reported in a recent sodium bicarbonate investigation [45] questions the validity of supplementation strategies based on individualised time to peak blood alkalosis. Further work is required to ascertain the intra-individual reliability of blood alkalosis responses to sodium citrate supplementation. Future research should also quantify intramuscular acid-base responses to sodium citrate supplementation, to complement the established blood responses, and to build on the findings of the sole sodium citrate investigation that has previously measured muscle pH [46].

Both blood [Na+] and plasma [citrate] peaked at similar times to those reported in prior investigations where participants ingested 500 mg.kg-1 BM sodium citrate [17, 46]. Sodium citrate supplementation has been suggested to induce blood alkalosis following an increased SID resulting from relative differences in the rate of entry and removal of citrate and sodium ions from the circulation [31, 47]. Subsequent increases in H+ excretion and/or decreases in HCO3- excretion from the kidneys are expected [30], which restore electrical equilibrium by increasing blood pH and [HCO3-] (blood alkalosis). While both plasma [citrate] and blood [Na+] were elevated immediately post-ingestion, the relative change in concentration was of greater magnitude for blood [Na+] than for plasma [citrate]. When converting to standardised units (μmol.L-1), the change from baseline to immediately post-ingestion was approximately 2000 μmol.L-1 for blood [Na+] (from 137.5 to 139.5 mmol.L-1, one positive charge per sodium ion) and approximately 300 μmol.L-1 for plasma [citrate] (from 132 to 230 μmol.L-1, three negative charges per citrate ion). This greater increase in blood [Na+] compared to plasma [citrate] likely represents a change in SID, to be followed by induced blood alkalosis. The 90 min delay between ingestion and a significant decline in blood [Cl-] may indicate that the SID response to sodium citrate supplementation is not highly dependent on blood [Cl-]. Assessment of all strong ions (potassium, magnesium, calcium and lactate) is required to establish a more complete understanding of the SID response to sodium citrate supplementation.

Handling of sodium, chloride and citrate ions

The similarity across treatments for iPeak, iMin and iDelta for blood [Na+], [Cl-] and plasma [citrate] may represent a lack of an effect of ingestion period on the magnitude of change in SID, although future monitoring of changes in all strong ions is needed to confirm this. With some variability according to ingestion period (significant treatment by time interaction effect), plasma [citrate] returned to baseline concentrations approximately 240–300 min post-ingestion. This occurred one to two hours later than that seen in prior investigations of plasma [citrate] [48, 49]. These differences are most likely due to the greater citrate load ingested in the current investigation (500 mg.kg-1 BM sodium citrate dose vs 40 mEq. potassium citrate (approximately 185 mg.kg-1 BM dose)), and/or possibly due to the differing ingestion modes implemented across studies (gelatine capsules in the current investigation, tablets or solution in prior investigations [48, 49]). Elevated blood [Na+] persisted for the entire 480 min post-ingestion observation period, an outcome not previously assessed in sodium citrate or similar literature. The differences in blood [Na+] and plasma [citrate] may relate to the differing pathway(s) through which these ions are absorbed and removed from the circulation. The earlier return to baseline concentrations for plasma [citrate] compared to blood [Na+], may indicate that the rate of removal exceeded the rate of entry at an earlier point for citrate ions than for sodium ions.

Urinary citrate excretion (mg) was increased when ingesting sodium citrate for all ingestion periods compared to no sodium citrate ingestion (i.e. urine collected prior to the first session) (all p < 0.001). Urinary citrate excretion (mg) increased above pre-testing concentrations by 363 to 466 mg, with no difference between ingestion periods (all p > 0.05). No prior investigation has assessed the impact of sodium citrate ingestion on urinary citrate excretion, although potassium citrate supplementation is associated with increased urinary citrate excretion [49]. This, together with the ingested sodium citrate dose (500 mg.kg-1 BM), may facilitate greater understanding of citrate metabolism. The mass of sodium citrate ingested per session was approximately 34 g, of which ~25 g was citrate (assuming negligible amounts of citrate in the co-ingested meal). Over the 480 min post-ingestion period, only ~0.4 g of the ingested citrate load (~2% of total ingested) was excreted into the urine. Given that citrate absorption in the GI system has been reported to be nearly complete [48], it is unlikely that a substantial portion of the ingested citrate load passed directly into the faeces without entering the circulation. Plasma [citrate] returning to resting concentrations 240–300 min post-ingestion indicates that the remaining 98% of the ingested citrate load must be accounted for by removal from the circulation via pathways other than urinary excretion, potentially involving the kidneys, liver and skeletal muscle [46, 50].

Gastrointestinal symptoms

Sodium citrate ingestion was associated with very minor GI symptoms for all ingestion periods. When considering the timing of GI symptoms, participants reported the highest ratings approximately 60–90 min post-ingestion, consistent with prior investigations [4, 16]. Gastrointestinal symptoms were minor at each time point, with a decline below a mean rating of 1.0 out of 40 from 150 min post-ingestion and onwards. The minor GI symptoms reported by participants was expected given our ingestion protocol, including the sodium citrate dose of 500 mg.kg-1 BM [4], capsules rather than solution as the ingestion mode [16], a fluid volume below 800 mL [51], and a co-ingested meal [52]. These findings are important for athletes, suggesting they can ingest sodium citrate at times in line with peak blood alkalosis (150–270 min) before exercise with minimal GI symptoms.

Palatability

No difference was detected when comparing the sodium citrate ingestion periods for palatability (p > 0.05). Palatability (across treatments) ranged from 5.3 to 5.9, which corresponds to a rating of between ‘neither like nor dislike’ and ‘like slightly’ [40]. A low palatability, especially for foods or fluids that are excessively salty, can be associated with avoidance of that particular food or fluid [53, 54]. From a practical perspective, higher palatability ratings may increase the extent to which a dietary supplementation strategy could be implemented in the context of high-intensity exercise. The broad similarity in palatability across treatments was to be expected, given the standardisation of the sodium citrate dose, ingestion mode, and co-ingested food and fluid. The moderate palatability ratings reported by participants of this investigation indicate that sodium citrate may be feasible for inclusion in training or competition routines.

Limitations

There are some limitations to the research design. The absence of an exercise performance test in this study reduces the extent to which findings can be directly applied to athletes. However this was a necessary element within the design of the current investigation, to isolate the impact of sodium citrate ingestion on physiological responses and gastrointestinal symptoms over an extended period of time. Further, the recruitment of healthy participants rather than trained individuals/athletes may limit transferability of these findings to the nutritional practices of athletes. Future investigations should assess exercise performance in a well-trained population when ingesting sodium citrate according to the ingestion protocols used within the current investigation. Finally, the sample size used in this study was based on pragmatic considerations, due to a lack of available data from comparable investigations assessing the effect of varying sodium citrate ingestion periods. However, the final sample size of 16 participants in a cross-over design where four conditions were tested exceeds the sample sizes of the majority of prior sodium citrate investigations.

Practical application statement

Based on the findings of the current investigation, it is recommended that sodium citrate be ingested across a 15–45 min period, with ingestion completed 150–270 min before the commencement of exercise, particularly for individuals competing in events where there may be performance benefit after induced blood alkalosis. Adherence to the recommended dose of 500 mg.kg-1 BM, ingested in gelatine capsules alongside a small carbohydrate-rich meal is recommended.

Novelty statement

This is the first investigation to monitor blood alkalosis for a period exceeding 240 min after ingestion of sodium citrate. No prior investigation has compared different sodium citrate ingestion periods. This investigation identifies a time interval where blood alkalosis is above baseline and also not below the peak (150–270 min post-ingestion), which provides additional information with regards to the optimum time to perform intense exercise after sodium citrate ingestion, for implementation by athletes. Monitoring of blood [Na+], blood [Cl-], plasma [citrate], and urinary excretion had not previously been conducted following sodium citrate ingestion, and may provide a greater understanding of the pathways through which sodium citrate induces blood alkalosis.

Supporting information

S1 Table. Pairwise comparisons (mean difference, 95% CI) of post-ingestion session values for blood variables (blood pH, blood [HCO3-], blood [Na+] and blood [Cl-]) following ingestion of 500 mg.kg-1 BM sodium citrate over 15, 30, 45 or 60 min (n = 16 participants, 18 observations per participant per treatment).

(DOCX)

S2 Table. Pairwise comparisons (mean difference, 95% CI) of curve characteristics for blood pH and blood bicarbonate concentration ([HCO3-]) following ingestion of 500 mg.kg-1 BM sodium citrate over 15, 30, 45 or 60 min (n = 16 participants, 18 observations per participant per treatment).

(DOCX)

S3 Table. Pairwise comparisons (mean difference, 95% CI) of curve characteristics for blood sodium concentration ([Na+]), blood chloride concentration ([Cl-]) and plasma citrate concentration ([citrate]) following ingestion of 500 mg.kg-1 BM sodium citrate over 15, 30, 45 or 60 min (n = 16 participants, 18 observations per participant per treatment).

(DOCX)

S4 Table. Pairwise comparisons (mean difference, 95% CI) of palatability (n = 16 participants) and urinary excretion values (n = 8 participants) following ingestion of 500 mg.kg-1 BM sodium citrate over 15, 30, 45 or 60 min.

(DOCX)

Data Availability

The dataset can be accessed via the following: DOI: 10.26187/tkah-h625 URL: http://hdl.handle.net/10536/DRO/DU:30149426.

Funding Statement

CU received all funding for this investigation from the School of Exercise and Nutrition Sciences at Deakin University. The funders had no role in study design, data collection and analysis, decision to publish, or preparation of the manuscript.

References

  • 1.Fitts R. The role of acidosis in fatigue: pro perspective. Med Sci Sports Exerc. 2016;48(11):2335–8. 10.1249/MSS.0000000000001043 [DOI] [PubMed] [Google Scholar]
  • 2.Westerblad H. Acidosis is not a significant cause of skeletal muscle fatigue. Med Sci Sports Exerc. 2016;48(11):2339–42. 10.1249/MSS.0000000000001044 [DOI] [PubMed] [Google Scholar]
  • 3.Jubrias S, Crowther G, Shankland E, Gronka R, Conley K. Acidosis inhibits oxidative phosphorylation in contracting human skeletal muscle in vivo. J Physiol. 2003;553(2):589–99. 10.1113/jphysiol.2003.045872 [DOI] [PMC free article] [PubMed] [Google Scholar]
  • 4.Urwin CS, Dwyer D, Carr AJ. Induced alkalosis and gastrointestinal symptoms after sodium citrate ingestion: a dose-response investigation. Int J Sport Nutr Exerc Metab. 2016;26(6):542–8. 10.1123/ijsnem.2015-0336 [DOI] [PubMed] [Google Scholar]
  • 5.Flueck J, Mettler S, Perret C. Influence of caffeine and sodium citrate ingestion on 1,500-m exercise performance in elite wheelchair athletes: a pilot study. Int J Sport Nutr Exerc Metab. 2014;24(3):296–304. 10.1123/ijsnem.2013-0127 [DOI] [PubMed] [Google Scholar]
  • 6.Hilton N, Leach N, Sparks A, Gough L, Craig M, Deb S, et al. A novel ingestion strategy for sodium bicarbonate supplementation in a delayed-release form: a randomised crossover study in trained males. Sports Med. 2019;5(1):4. [DOI] [PMC free article] [PubMed] [Google Scholar]
  • 7.Requena B, Zabala M, Padial P, Feriche B. Sodium bicarbonate and sodium citrate: ergogenic aids? J Strength Cond Res. 2005;19(1):213–24. 10.1519/13733.1 [DOI] [PubMed] [Google Scholar]
  • 8.Peacock J, Sparks SA, Middlebrook I, Hilton NP, Tinnion D, Leach N, et al. Extraceullular buffer choice influences acid-base responses and gastrointestinal symptoms. Res Sports Med. 2021:1–12. [DOI] [PubMed] [Google Scholar]
  • 9.Cerullo G, Parimbelli M, Perna S, Pecoraro M, Liguori G, Negro M, et al. Sodium citrate supplementation: an updated revision and practical recommendations on exercise performance, hydration status and potential risks. Translational Sports Medicine. 2020;00:1–8. [Google Scholar]
  • 10.Lancha AH Jr, de Salles Painelli V, Saunders B, Artioli GG. Nutritional strategies to modulate intracellular and extracellular buffering capacity during high-intensity exercise. Sports Med. 2015;45(1):71–81. [DOI] [PMC free article] [PubMed] [Google Scholar]
  • 11.Heibel A, Perim P, Oliveira L, McNaughton L, Saunders B. Time to optimize supplementation: modifying factors influencing the individual responses to extracellular buffering agents. Frontiers in Nutrition. 2018;5(1):35. 10.3389/fnut.2018.00035 [DOI] [PMC free article] [PubMed] [Google Scholar]
  • 12.Urwin CS, Snow RJ, Condo D, Snipe R, Wadley GD, Carr AJ. Factors Influencing Blood Alkalosis and Other Physiological Responses, Gastrointestinal Symptoms and Exercise Performance Following Sodium Citrate Supplementation: a Review. Int J Sport Nutr Exerc Metab. 2020;In Press. [DOI] [PubMed] [Google Scholar]
  • 13.Potteiger J, Webster M, Nickel C, Haub M, Palmer R. The effects of buffer ingestion on metabolic factors related to distance running performance. Eur J Appl Physiol. 1996;72(4):365–71. 10.1007/BF00599698 [DOI] [PubMed] [Google Scholar]
  • 14.Dalle S, Koppo K, Hespel P. Sodium bicarbonate improves sprint performance in endurance cycling. J Sci Med Sport. 2020. [DOI] [PubMed] [Google Scholar]
  • 15.McNaughton L. Sodium citrate and anaerobic performance: implications of dosage. Eur J Appl Physiol. 1990;61(5):392–7. [DOI] [PubMed] [Google Scholar]
  • 16.Urwin CS, Snow RJ, Orellana L, Condo D, Wadley GD, Carr AJ. Sodium citrate ingestion protocol impacts induced alkalosis, gastrointestinal symptoms, and palatability. Physiological Reports. 2019;7(19):14216. [DOI] [PMC free article] [PubMed] [Google Scholar]
  • 17.Oopik V, Timpmann S, Kadak K, Medijainen L, Karelson K. The effects of sodium citrate ingestion on metabolism and 1500m racing time in trained female runners. Journal of Sports Science and Medicine. 2008;7(1):125–31. [PMC free article] [PubMed] [Google Scholar]
  • 18.Shave R, Whyte G, Siemann A, Doggart L. The effects of sodium citrate ingestion on 3,000-meter time-trial performance. J Strength Cond Res. 2001;15(2):230–4. [PubMed] [Google Scholar]
  • 19.Vaher I, Timpmann S, Aedma M, Oopik V. Impact of acute sodium citrate ingestion on endurance running performance in a warm environment. European Journal of Applied Physiology 2015;115(4):813–23. 10.1007/s00421-014-3068-6 [DOI] [PubMed] [Google Scholar]
  • 20.Van Someren K, Fulcher K, McCarthy J, Moore J, Horgan G, Langford R. An investigation into the effects of sodium citrate ingestion on high-intensity exercise performance. J Int Soc Sports Nutr. 1998;8(4):356–63. 10.1123/ijsn.8.4.356 [DOI] [PubMed] [Google Scholar]
  • 21.Tiryaki G, Atterbom H. The effects of sodium bicarbonate and sodium citrate on 600 m running time of trained females. The Journal of Sports Medicine and Physical Fitness. 1995;35(3):194–8. [PubMed] [Google Scholar]
  • 22.Parry-Billings M, MacLaren D. The effect of sodium bicarbonate and sodium citrate ingestion on anaerobic power during intermittent exercise. Eur J Appl Physiol. 1986;55(5):524–9. 10.1007/BF00421648 [DOI] [PubMed] [Google Scholar]
  • 23.Oopik V, Saaremets I, Medijainen L, Karelson K, Janson T, Timpmann S. Effects of sodium citrate ingestion before exercise on endurance performance in well trained college runners. Br J Sports Med. 2003;37(6):485–9. 10.1136/bjsm.37.6.485 [DOI] [PMC free article] [PubMed] [Google Scholar]
  • 24.Bracken R, Linnane D, Brooks S. Alkalosis and the plasma catecholamine response to high intensity exercise in man. Med Sci Sports Exerc. 2005;37(2):227–33. 10.1249/01.mss.0000152704.34531.b6 [DOI] [PubMed] [Google Scholar]
  • 25.Ball D, Maughan R. The effect of sodium citrate ingestion on the metabolic response to intense exercise following diet manipulation in man. Exp Physiol. 1997;82(6):1041–56. 10.1113/expphysiol.1997.sp004079 [DOI] [PubMed] [Google Scholar]
  • 26.Street D, Nielsen J, Bangsbo J, Juel C. Metabolic alkalosis reduces exercise-induced acidosis and potassium accumulation in human skeletal muscle interstitium. J Physiol. 2005;566(2):481–9. 10.1113/jphysiol.2005.086801 [DOI] [PMC free article] [PubMed] [Google Scholar]
  • 27.Van Montfoort M, Van Dieren L, Hopkins W, Shearman J. Effects of ingestion of bicarbonate, citrate, lactate, and chloride on sprint running. Med Sci Sports Exerc. 2004;36(7):1239–43. 10.1249/01.mss.0000132378.73975.25 [DOI] [PubMed] [Google Scholar]
  • 28.Boegman S, Stellingwerff T, Shaw G, Clarke N, Graham K, Cross R, et al. The impact of individualizing sodium bicarbonate supplementation strategies on world-class rowing performance. Frontiers in Nutrition. 2020;7:138. 10.3389/fnut.2020.00138 [DOI] [PMC free article] [PubMed] [Google Scholar]
  • 29.Jones R, Stellingwerff T, Artioli G, Saunders B, Cooper S, Sale C. Dose-response of sodium bicarbonate ingestion highlights individuality in time course of blood analyte responses. Int J Sport Nutr Exerc Metab. 2016;26(5):445–53. 10.1123/ijsnem.2015-0286 [DOI] [PubMed] [Google Scholar]
  • 30.Kurtz I, Kraut J, Ornekian V, Nguyen M. Acid-base analysis: a critique of the Stewart and bicarbonate-centered approaches. American Journal of Physiology-Renal Physiology. 2008;294(5):1009–31. 10.1152/ajprenal.00475.2007 [DOI] [PubMed] [Google Scholar]
  • 31.Stewart P. Modern quantitative acid–base chemistry. Can J Physiol Pharmacol. 1983;61(12):1444–61. 10.1139/y83-207 [DOI] [PubMed] [Google Scholar]
  • 32.De Pauw K, Roelands B, Cheung SS, De Geus B, Rietjens G, Meeusen R. Guidelines to classify subject groups in sport-science research. International journal of sports physiology performance. 2013;8(2):111–22. 10.1123/ijspp.8.2.111 [DOI] [PubMed] [Google Scholar]
  • 33.ACSM. Nutrition and Athletic Performance. Medicine & science in sports & exercise. 2016;48(3):543–68. [DOI] [PubMed] [Google Scholar]
  • 34.Costill DL, Hargreaves M. Carbohydrate nutrition and fatigue. Sports Med. 1992;13(2):86–92. 10.2165/00007256-199213020-00003 [DOI] [PubMed] [Google Scholar]
  • 35.Burke L, Kiens B, Ivy J. Carbohydrates and fat for training and recovery. J Sports Sci. 2004;22(1):15–30. 10.1080/0264041031000140527 [DOI] [PubMed] [Google Scholar]
  • 36.Hargreaves M, Hawley J, Jeukendrup A. Pre-exercise carbohydrate and fat ingestion: effects on metabolism and performance. J Sports Sci. 2004;22(1):31–8. 10.1080/0264041031000140536 [DOI] [PubMed] [Google Scholar]
  • 37.Oliver H, Lowry J. A flexible system of enzymatic analysis: Academic Press; 1972. 151–3 p. [Google Scholar]
  • 38.Moellering H, Gruber W. Determination of citrate with citrate lyase. Anal Biochem. 1966;17(3):369–76. 10.1016/0003-2697(66)90172-2 [DOI] [PubMed] [Google Scholar]
  • 39.Adam B, Liebregts T, Saadat-Gilani K, Vinson B, Holtmann G. Validation of the gastrointestinal symptom score for the assessment of symptoms in patients with functional dyspepsia. Aliment Pharmacol Ther. 2005;22(4):357–63. 10.1111/j.1365-2036.2005.02572.x [DOI] [PubMed] [Google Scholar]
  • 40.Peryam D, Pilgrim F. Hedonic scale of measuring food preferences. Food Technol. 1957;11:9–14. [Google Scholar]
  • 41.Carr A, Hopkins W, Gore J. Effects of acute alkalosis and acidosis on performance: a meta analysis. Sports Med. 2011;41(10):801–14. 10.2165/11591440-000000000-00000 [DOI] [PubMed] [Google Scholar]
  • 42.Friedman J, Hastie T, Tibshirani R. The Elements of Statistical Learning: Springer; 2001. [Google Scholar]
  • 43.Hilton NP, Leach NK, Craig MM, Sparks SA, McNaughton LR. Enteric-coated sodium bicarbonate attenuates gastrointestinal side-effects. International journal of sport nutrition exercise metabolism. 2020;30(1):62–8. 10.1123/ijsnem.2019-0151 [DOI] [PubMed] [Google Scholar]
  • 44.Hilton NP, Leach NK, Hilton MM, Sparks SA, McNaughton LR. Enteric-coated sodium bicarbonate supplementation improves high-intensity cycling performance in trained cyclists. Eur J Appl Physiol. 2020. 10.1007/s00421-020-04387-5 [DOI] [PMC free article] [PubMed] [Google Scholar]
  • 45.Farias DEOL, Saunders B, Yamaguchi G, Swinton P, Giannini Artioli G. Is Individualization of Sodium Bicarbonate Ingestion Based on Time to Peak Necessary? Med Sci Sports Exerc. 2020;52(8):1801–8. 10.1249/MSS.0000000000002313 [DOI] [PubMed] [Google Scholar]
  • 46.Linossier M, Dormis D, Bregere P, Geyssant A, Denis C. Effect of sodium citrate on performance and metabolism of human skeletal muscle during supramaximal cycling exercise. Eur J Appl Physiol. 1997;76(1):48–54. 10.1007/s004210050211 [DOI] [PubMed] [Google Scholar]
  • 47.Kowalchuk J, Maltais S, Yamaji K, Hughson R. The effect of sodium citrate loading on exercise performance, acid-base balance and metabolism. Eur J Appl Physiol. 1989;58(8):858–64. [DOI] [PubMed] [Google Scholar]
  • 48.Fegan J, Khan R, Poindexter J, Pak CY. Gastrointestinal citrate absorption in nephrolithiasis. The Journal of Urology. 1992;147(5):1212–4. 10.1016/s0022-5347(17)37520-1 [DOI] [PubMed] [Google Scholar]
  • 49.Sakhaee K, Alpern R, Poindexter J, Pak CY. Citraturic response to oral citric acid load. The Journal of Urology. 1992;147(4):975–6. 10.1016/s0022-5347(17)37437-2 [DOI] [PubMed] [Google Scholar]
  • 50.Zacchia M, Preisig P. Low urinary citrate: an overview. Journal of Nephrology. 2010;23(6):49. [PubMed] [Google Scholar]
  • 51.Mitchell J, Voss K. The influence of volume on gastric emptying and fluid balance during prolonged exercise. Med Sci Sports Exerc. 1991;23(3):314–9. [PubMed] [Google Scholar]
  • 52.Carr A, Slater G, Gore J, Dawson B, Burke L. Effect of sodium bicarbonate on [HCO3], pH, and gastrointestinal symptoms. Int J Sport Nutr Exerc Metab. 2011;21(3):189–94. 10.1123/ijsnem.21.3.189 [DOI] [PubMed] [Google Scholar]
  • 53.Bolhuis D, Lakemond C, de Wijk R, Luning P, de Graaf C. Both longer oral sensory exposure to and higher intensity of saltiness decrease ad libitum food intake in healthy normal-weight men. The Journal of Nutrition. 2011;141(12):2242–8. 10.3945/jn.111.143867 [DOI] [PubMed] [Google Scholar]
  • 54.McCrickerd K, Forde C. Sensory influences on food intake control: Moving beyond palatability. Obes Rev. 2016;17(1):18–29. 10.1111/obr.12340 [DOI] [PubMed] [Google Scholar]

Decision Letter 0

Lars McNaughton

23 Feb 2021

PONE-D-21-03700

Does varying the ingestion duration of sodium citrate influence blood alkalosis and gastrointestinal symptoms?

PLOS ONE

Dear Dr. Urwin,

Thank you for submitting your manuscript to PLOS ONE. After careful consideration, we feel that it has merit but does not fully meet PLOS ONE’s publication criteria as it currently stands. Therefore, we invite you to submit a revised version of the manuscript that addresses the points raised during the review process.

Please submit your revised manuscript by Apr 09 2021 11:59PM. If you will need more time than this to complete your revisions, please reply to this message or contact the journal office at plosone@plos.org. When you're ready to submit your revision, log on to https://www.editorialmanager.com/pone/ and select the 'Submissions Needing Revision' folder to locate your manuscript file.

Please include the following items when submitting your revised manuscript:

  • A rebuttal letter that responds to each point raised by the academic editor and reviewer(s). You should upload this letter as a separate file labeled 'Response to Reviewers'.

  • A marked-up copy of your manuscript that highlights changes made to the original version. You should upload this as a separate file labeled 'Revised Manuscript with Track Changes'.

  • An unmarked version of your revised paper without tracked changes. You should upload this as a separate file labeled 'Manuscript'.

If you would like to make changes to your financial disclosure, please include your updated statement in your cover letter. Guidelines for resubmitting your figure files are available below the reviewer comments at the end of this letter.

If applicable, we recommend that you deposit your laboratory protocols in protocols.io to enhance the reproducibility of your results. Protocols.io assigns your protocol its own identifier (DOI) so that it can be cited independently in the future. For instructions see: http://journals.plos.org/plosone/s/submission-guidelines#loc-laboratory-protocols

We look forward to receiving your revised manuscript.

Kind regards,

Lars McNaughton, PhD

Academic Editor

PLOS ONE

Journal Requirements:

When submitting your revision, we need you to address these additional requirements.

1. Please ensure that your manuscript meets PLOS ONE's style requirements, including those for file naming. The PLOS ONE style templates can be found at

https://journals.plos.org/plosone/s/file?id=wjVg/PLOSOne_formatting_sample_main_body.pdf and

https://journals.plos.org/plosone/s/file?id=ba62/PLOSOne_formatting_sample_title_authors_affiliations.pdf

2. In your Data Availability statement, you have not specified where the minimal data set underlying the results described in your manuscript can be found. PLOS defines a study's minimal data set as the underlying data used to reach the conclusions drawn in the manuscript and any additional data required to replicate the reported study findings in their entirety. All PLOS journals require that the minimal data set be made fully available. For more information about our data policy, please see http://journals.plos.org/plosone/s/data-availability.

Upon re-submitting your revised manuscript, please upload your study’s minimal underlying data set as either Supporting Information files or to a stable, public repository and include the relevant URLs, DOIs, or accession numbers within your revised cover letter. For a list of acceptable repositories, please see http://journals.plos.org/plosone/s/data-availability#loc-recommended-repositories. Any potentially identifying patient information must be fully anonymized.

Important: If there are ethical or legal restrictions to sharing your data publicly, please explain these restrictions in detail. Please see our guidelines for more information on what we consider unacceptable restrictions to publicly sharing data: http://journals.plos.org/plosone/s/data-availability#loc-unacceptable-data-access-restrictions. Note that it is not acceptable for the authors to be the sole named individuals responsible for ensuring data access.

We will update your Data Availability statement to reflect the information you provide in your cover letter.

[Note: HTML markup is below. Please do not edit.]

Reviewers' comments:

Reviewer's Responses to Questions

Comments to the Author

1. Is the manuscript technically sound, and do the data support the conclusions?

The manuscript must describe a technically sound piece of scientific research with data that supports the conclusions. Experiments must have been conducted rigorously, with appropriate controls, replication, and sample sizes. The conclusions must be drawn appropriately based on the data presented.

Reviewer #1: Yes

Reviewer #2: Yes

**********

2. Has the statistical analysis been performed appropriately and rigorously?

Reviewer #1: Yes

Reviewer #2: Yes

**********

3. Have the authors made all data underlying the findings in their manuscript fully available?

The PLOS Data policy requires authors to make all data underlying the findings described in their manuscript fully available without restriction, with rare exception (please refer to the Data Availability Statement in the manuscript PDF file). The data should be provided as part of the manuscript or its supporting information, or deposited to a public repository. For example, in addition to summary statistics, the data points behind means, medians and variance measures should be available. If there are restrictions on publicly sharing data—e.g. participant privacy or use of data from a third party—those must be specified.

Reviewer #1: No

Reviewer #2: Yes

**********

4. Is the manuscript presented in an intelligible fashion and written in standard English?

PLOS ONE does not copyedit accepted manuscripts, so the language in submitted articles must be clear, correct, and unambiguous. Any typographical or grammatical errors should be corrected at revision, so please note any specific errors here.

Reviewer #1: Yes

Reviewer #2: Yes

**********

5. Review Comments to the Author

Please use the space provided to explain your answers to the questions above. You may also include additional comments for the author, including concerns about dual publication, research ethics, or publication ethics. (Please upload your review as an attachment if it exceeds 20,000 characters)

Reviewer #1: This study compared different ingestions durations of the same dose of sodium citrate on blood alkalosis, gastrointestinal symptoms and indicators of strong ion difference. The study is well performed and the manuscript well written, although I do have some minor comments and suggestions that I hope the authors will consider.

General

It is unclear why VO2peak was determined. Is the pharmacokinetic response following supplementation modified by VO2peak? Are these data necessary to the study?

I think it is important to include a section (or statements throughout) specifying limitations of the study, of which I believe the following should be included: a lack of a performance outcome to test whether these differences are actually meaningful.

The large window of opportunity for an ergogenic effect is one we recently saw with sodium bicarbonate (DOI: 10.1249/MSS.0000000000002313). Alongside the lack of statistical difference between peak bicarbonate and bicarbonate in the time 120-270 min post-ingestion, which we also showed, I believe these data question the necessity for the time to peak strategy. The authors might wish to consider some discussion on this topic. I believe their data is also relevant for more prolonged high-intensity exercise where increased buffering capacity might be useful over a longer period (e.g. cycling – see Dalle et al. DOI: 10.1016/j.jsams.2020.09.011). Again, some relevant discussion might be of interest based upon these results.

Specific

Line 41 – What about muscle acidosis? Is blood acidosis not somewhat a reflection of what is happening at the muscle level?

Line 96 – Please use metre as the SI unit for height

Line 125 – How much sodium is in Powerade? Could this have influenced absolute changes?

Line 133-136: Just a suggestion but a figure might be useful to visualise the different timings.

Lines 332-334: I wonder what the physiological relevance of such minor differences are? I would like to see more emphasis on the actual differences in addition to the statistics. These differences are just as likely to be within measurement error or biological variability.

Line 348: “This may be explained…” - I would say this is almost entirely explained by this.

Lines 365-367: I would urge some caution here as this is only one study and the 60 min comparison (vs TTP) is certainly on the lower end of the time spectrum for bicarbonate increases.

Lines 390-391: “indicating that ingestion duration did not impact the magnitude of change in SID.” – I am not sure you can state that since you did not actually measure SID. I suggest reformulating this section.

Reviewer #2: General comments

This is an interesting and potentially important study for the exogenous buffer literature. The study is well conducted and controlled. There is a vast amount of data representing a very high volume of work which has been conducted. There are important findings and useful practical recommendations for those choosing to use sodium citrate as an exogenous buffering agent. I do however have some concerns about the presentation of some parts of the manuscript which the authors need to address in order to make the information more accessible to the readership. I’ve tried to make the comments as useful as possible, so hopefully they’ll be helpful.

Specific comments

Introduction

Line 45: It would be useful to state why there is likely lower GIS with citrate.

Line 46: There is a very abrupt start to this paragraph and it would benefit from either a more introductory statement, or a better link from the previous paragraph.

Line 47: “identified that ergogenic benefit…” should have an “an” between that and ergogenic.

Line 49: move (> 100% … to after “exercise”.

Lines 54-55: state why this ingestion time has previously been suggested.

Line 58: The clarity of your terminology regarding the “duration of ingestion” is really confusing. The reader can easily confuse this with the pre-exercise ingestion period, so it is important for you to define exactly what you mean here. It took me a few attempts to read this section and fully understand it (this may well be a reflection on me of course, but it’s likely to also be the case for others).

Line 62: This feels a bit of a dead end. Where does it lead, where’s the “so what?”

Lines 63-67: See previous comment about clarity of this ingestion period information.

Line 78: The Heibel et al and Jones et al., papers might be better here.

Line 81: “persistence” is an interesting choice of word, but it probably needs a bit of clarification.

Line 83: “changed” might be better as “alterations to” or something similar.

Line 91: Check the grammar here.

Methods

Line 95: Why 16?

Line 96: height should always be described in m not cm.

Lines 104-105: you don’t need to state the units for height and weight, it’s obvious, and you’ve already done it.

Lines 119-120: “10:00 pm the night prior” is a little awkwardly written. Just state the at washout period between trials was… you don’t need to clarify this with two sets of terms.

Line123: Please state the size of the capsules used to allow for possible replication.

Line 127: Why was such a small meal chosen. How does this relate to likely practice in feeding prior to exercise?

Line 135: it is unclear if this was exactly the same meal prescribed again. Please clarify.

Lines 147-148: Whilst the radiometer’s validity and reliability are well established, can you provide some estimate or support for this assay’s TEM/CV or validity and reliability.

Line 151: add “the” between “and” and “volume”.

Lines 164-165: This is a statement, not a paragraph. It should also be placed last in this section, as it’s not an appropriate starting statement for a statistical analysis section.

Lines 166-170: how did you determine the most appropriate model to use? What were the criteria? It would also be best practice to provide an estimate of effect size for these analyses. For the LMM you could consider Cohen’s F squared.

Line 178: Don’t use personal pronouns in scientific writing. I know it’s become fashionable of late to do this, but it’s not good practice. Please do this for the other instances of this in the manuscript (we and our) are used on multiple occasions.

Line 190; Don’t start sentences with abbreviations. Check this throughout the manuscript.

Lines 194-195: “variables a and b..” this needs more clarity.

Results

This is the section that I had some serious trouble with. I think it needs a complete re-think, because I got completely lost whilst reading it, and given that I have good knowledge and experience of this type of study, that means that most other will also likely struggle to access the information. The main issue is that there is just so much data and making comparison between the trial conditions is really difficult to follow. This isn’t helped by the clarity of some of the figures, which need solid lines and markers, and they need some of the error bars removing so that the actual data is visible, because it just look far to untidy at present.

The key focus must surely be the comparison in the responses to the ingestion time periods, so I think you need to display all of the variable with that in mind, to allow the reader to make this visual comparisons for themselves. I was a little unsure if the figure titles were titles, or sub-sectioned paragraphs as they seemed to be presented in the middle of the results section, which was a little confusing.

One strategy for making the description of the results easier to read, it to avoid using the term “significant” as much as possible. That forces you to write about data, rather than the stats outcomes. Remember that the stats outcomes, are there as supporting evidence, they should not be the sole focus. Try to describe the response of the variables and that show improve this section.

Discussion

Generally this was a good section with some nice flow and useful information and interpretation.

Line 329: given the size of some of the error bars, certainly initially, I’m not convinced that all of the participants would calls their GIS as “minor”. So can you re-phrase this to reflect that.

Line 336: replace “levels” with “concentration” throughout the manuscript when describing a blood or urine parameter.

Line 338: we can assume this is significant, so you don’t need the p-value.

Line 346: this is awkwardly phrased.

Line 350: “dosage” is a poor term. Dose is better. It would be worth clarifying this type of effect, to that seen with delayed-release capsule ingestion as the response of more gradual absorption is similar.

Line 354: “our laboratory” is a bit pretentious. Is this really needed? Just reference the paper.

Lines 362-368: Nice section.

Double check you use of square parentheses throughout the manuscript, especially in sentences where you have them next to “blood”.

Lines 394-396: This may have been due to capsule size differences.

The discussion might be better with the subheading removed, and the material in each included in other paragraphs or elsewhere (just a consideration really).

Lines 431-439: This section reads like a results section, rather than a discussion.

Lines 441: can you really conclude that athletes can use this strategy, given that you have recruited active participants?

Figures and Tables

Tables: these are generally clear, but they would benefit from the removal of as many borders and lines as possible.

Figures: add line markers and remove some of the error bars for clarity. Don’t use letters to highlight significance as the figures with multiple graphs on are also labelled with letters.

Make it easier for the reader to make comparisons between trials.

**********

6. PLOS authors have the option to publish the peer review history of their article (what does this mean?). If published, this will include your full peer review and any attached files.

If you choose “no”, your identity will remain anonymous but your review may still be made public.

Do you want your identity to be public for this peer review? For information about this choice, including consent withdrawal, please see our Privacy Policy.

Reviewer #1: No

Reviewer #2: Yes: S. Andy Sparks

[NOTE: If reviewer comments were submitted as an attachment file, they will be attached to this email and accessible via the submission site. Please log into your account, locate the manuscript record, and check for the action link "View Attachments". If this link does not appear, there are no attachment files.]

While revising your submission, please upload your figure files to the Preflight Analysis and Conversion Engine (PACE) digital diagnostic tool, https://pacev2.apexcovantage.com/. PACE helps ensure that figures meet PLOS requirements. To use PACE, you must first register as a user. Registration is free. Then, login and navigate to the UPLOAD tab, where you will find detailed instructions on how to use the tool. If you encounter any issues or have any questions when using PACE, please email PLOS at figures@plos.org. Please note that Supporting Information files do not need this step.

PLoS One. 2021 May 17;16(5):e0251808. doi: 10.1371/journal.pone.0251808.r002

Author response to Decision Letter 0


20 Apr 2021

Does varying the ingestion duration of sodium citrate influence blood alkalosis and gastrointestinal symptoms?

Please note: line and page numbers in this document align with those in the final ‘Manuscript’ document submitted as a part of this revision.

Reviewer 1

This study compared different ingestions durations of the same dose of sodium citrate on blood alkalosis, gastrointestinal symptoms and indicators of strong ion difference. The study is well performed and the manuscript well written, although I do have some minor comments and suggestions that I hope the authors will consider.

Thank you for taking the time to review our manuscript. The authors have sought to address all comments both below and in the revised manuscript.

General

It is unclear why VO2peak was determined. Is the pharmacokinetic response following supplementation modified by VO2peak? Are these data necessary to the study?

Thank you for your comment. The VO2peak assessment was conducted to provide a measure of cardiovascular fitness, as a component of health, alongside screening for kidney disease or use of blood acidity regulating medication. While these data are not included as an outcome measure or inclusion criteria per-se, they provide an indicator that our participant group had a reasonable level of aerobic fitness, which corresponds to terms such as “healthy, habitually active, physically fit, physically active, active and habitually physically active”, per a review by De Pauw and colleagues (https://doi.org/10.1123/ijspp.8.2.111). We have now added further detail to the Methods section on lines 117-120 on page 6 of the revised manuscript.

“VO2peak was determined as previously described by Urwin et al. [16], using an incremental increase in cycling intensity to volitional fatigue. These respiratory data were used to categorise participants “healthy” or “physically fit” according to previously used nomenclature [32].”

I think it is important to include a section (or statements throughout) specifying limitations of the study, of which I believe the following should be included: a lack of a performance outcome to test whether these differences are actually meaningful.

Thank you for providing this suggestions. The authors have now added a sub-section to the end of the discussion section, titled ‘Limitations’, which can be found on lines 459-471 on page 26 of the revised manuscript. This sub-section addresses the absence of an exercise performance test, the assessment of healthy participants (rather than elite athletes) and factors related to determining an appropriate sample size.

“There are some limitations to the research design. The absence of an exercise performance test in this study reduces the extent to which findings can be directly applied to athletes. However this was a necessary element within the design of the current investigation, to isolate the impact of sodium citrate ingestion on physiological responses and gastrointestinal symptoms over an extended period of time. Further, the recruitment of healthy participants rather than trained individuals/athletes may limit transferability of these findings to the nutritional practices of athletes. Future investigations should assess exercise performance in a well-trained population when ingesting sodium citrate according to the ingestion protocols used within the current investigation. Finally, the sample size used in this study was based on pragmatic considerations, due to a lack of available data from comparable investigations assessing the effect of varying sodium citrate ingestion periods. However, the final sample size of 16 participants in a cross-over design where four conditions were tested exceeds the sample sizes of the majority of prior sodium citrate investigations.”

The large window of opportunity for an ergogenic effect is one we recently saw with sodium bicarbonate (DOI: 10.1249/MSS.0000000000002313). Alongside the lack of statistical difference between peak bicarbonate and bicarbonate in the time 120-270 min post-ingestion, which we also showed, I believe these data question the necessity for the time to peak strategy. The authors might wish to consider some discussion on this topic.

Thank you for highlighting this important discussion point. The authors have accepted this comment and added this discussion to lines 371-378 on page 22 of the revised manuscript.

“Experimental results from the sodium bicarbonate literature have suggested that commencing exercise in correspondence with individual peak blood alkalosis is associated with greater performance benefit than using a post-ingestion timing that is standardised across all participants or athletes [28]. However, the poor intra-individual reliability of time to peak blood [HCO3-] reported in a recent sodium bicarbonate investigation [45] questions the validity of supplementation strategies based on individualised time to peak blood alkalosis. Further work is required to ascertain the intra-individual reliability of blood alkalosis responses to sodium citrate supplementation.”

I believe their data is also relevant for more prolonged high-intensity exercise where increased buffering capacity might be useful over a longer period (e.g. cycling – see Dalle et al. DOI: 10.1016/j.jsams.2020.09.011). Again, some relevant discussion might be of interest based upon these results.

Thank you for identifying this point. In response to this comment, we have made changes to the Introduction, on lines 55-56 on page 3 of the revised manuscript. Given the absence of an exercise performance test in the current investigation, the authors have not adjusted parts of the Discussion related to the specific types of exercise/event to which these physiological results might be applied.

“Performance of an all-out or high-intensity exhaustive effort at the end of endurance exercise has also been reportedly improved by supplementation with sodium citrate [13, 14].”

Specific

Line 41 – What about muscle acidosis? Is blood acidosis not somewhat a reflection of what is happening at the muscle level?

Thank you for providing this comment. The authors have considered this comment carefully, but have referred to ‘blood acidosis’ as there is currently a relative dearth of information pertaining to the intramuscular responses to sodium citrate supplementation. More direct assessment of the intramuscular environment following sodium citrate supplementation is needed to confirm this as the mechanism through which the supplement may affect an improved exercise performance. The authors have therefore added a comment to this effect on lines 378-381 on page 22 of the revised manuscript.

“Future research should also quantify intramuscular acid-base responses to sodium citrate supplementation, to complement the established blood responses, and to build on the findings of the sole sodium citrate investigation that has previously measured muscle pH [46].”

Line 96 – Please use metre as the SI unit for height.

Thank you for highlighting this. The authors have now adjusted the unit for height to metres rather than centimetres, as is reflected on line 108 on page 5 of the revised manuscript.

Line 125 – How much sodium is in Powerade? Could this have influenced absolute changes?

Thank you for identifying this. Whilst the quantity of sodium in Powerade was included in the original manuscript, we have now modified the wording within the revised manuscript on lines 142-144 on page 7 of the Methods section, to present this information more clearly.

“According to manufacturer packaging, the co-ingested meals (including Powerade) contained a total of approximately 2 g of sodium, representing 18% of the total ingested sodium (given that approximately 9 g sodium was ingested as sodium citrate).”

The contribution of the co-ingested meals to the total amount of ingested sodium per session is small relative to that of the sodium citrate supplementation. Given the molecular weight of sodium citrate (258.06 g.mol-1), we can estimate that our participants ingested approximately 9 g of sodium per session from sodium citrate (dictated by the mean body mass of our participants, 68.3 kg), considerably more than the 2 g of sodium from the co-ingested meals. The primary focus of this investigation was the comparison of ingestion periods, so the magnitude of the absolute change in blood sodium concentration has not been discussed at length. Further, the same small quantity of sodium was ingested within the Powerade and co-ingested meals across all treatments according to our dietary standardisation procedures, which therefore reduces the possibility of the meals leading to any changes in blood sodium concentration between treatments.

Line 133-136: Just a suggestion but a figure might be useful to visualise the different timings.

Thank you for providing this suggestion. The authors have considered including a figure depicting the timeline of data collection, but have decided to retain the description in the text alone. This decision was made primarily due to the current number of figures already included in this manuscript (seven). Reviewer 2 has requested that we include additional detail in the originally submitted tables, which the authors have added in the supplementary tables (Tables S1, S2, S3, S4).

Lines 332-334: I wonder what the physiological relevance of such minor differences are? I would like to see more emphasis on the actual differences in addition to the statistics. These differences are just as likely to be within measurement error or biological variability.

Thank you for highlighting this consideration. The authors now have addressed this on lines 328-344 on pages 20-21 of the revised manuscript. Further, the authors have adapted the results section to highlight clinical/physiological differences rather than simply p-values, per Reviewer 2 request.

“In the current investigation, the 30, 45 and 60 min ingestion periods were associated with a small, but significantly lower blood pH (~0.01 pH or 1 nmol.L-1) when compared to the 15 min ingestion period, despite the identical sodium citrate dose and mode in each treatment. The 60 min ingestion period was associated with a mean session blood [HCO3-] of 27.1 mmol.L-1, compared to 27.7 mmol.L-1 for the 15 min ingestion period. While statistically significant, this mean difference of 0.6 mmol.L-1 is similar in magnitude to that of the width of the 95% confidence intervals for each treatment. Therefore, although statistical differences for blood alkalosis were detected when comparing treatments in some analyses, the small absolute size of these differences may suggest limited clinical differences with regards to blood alkalosis responses across treatments. Blood [HCO3-] did not differ between the 15, 30 and 45 min ingestion periods, but blood pH was slightly lower in the latter two treatments compared with the 15 min ingestion period. Overall, it can therefore be concluded that ingesting sodium citrate over a 15, 30 or 45 min period may be associated with a similar or greater total blood alkalosis response than for a 60 min ingestion period. When considering both blood pH and [HCO3-] as components of blood alkalosis, there is little difference between the 15, 30 and 45 min ingestion periods, suggesting that any of these three protocols could be recommended on the basis of the findings from this study.”

Line 348: “This may be explained…” - I would say this is almost entirely explained by this.

The authors have adjusted the phrasing on lines 350-351 of page 21 of the revised manuscript.

“This is likely explained by…”

Lines 365-367: I would urge some caution here as this is only one study and the 60 min comparison (vs TTP) is certainly on the lower end of the time spectrum for bicarbonate increases.

Thank you for identifying this. The authors have made adjustments to this section on lines 371-378 on page 22 of the revised manuscript, as also documented above in response to your earlier comment.

“Experimental results from the sodium bicarbonate literature have suggested that commencing exercise in correspondence with individual peak blood alkalosis is associated with greater performance benefit than using a post-ingestion timing that is standardised across all participants or athletes [28]. However, the poor intra-individual reliability of time to peak blood [HCO3-] reported in a recent sodium bicarbonate investigation [45] questions the validity of supplementation strategies based on individualised time to peak blood alkalosis. Further work is required to ascertain the intra-individual reliability of blood alkalosis responses to sodium citrate supplementation.”

Lines 390-391: “indicating that ingestion duration did not impact the magnitude of change in SID.” – I am not sure you can state that since you did not actually measure SID. I suggest reformulating this section.

Thank you for highlighting this point. The authors have adjusted the phrasing on lines 401-403 on page 23 of the revised manuscript to reflect the results of the current investigation only.

“The similarity across treatments for iPeak, iMin and iDelta for blood [Na+], [Cl-] and plasma [citrate] may represent a lack of an effect of ingestion period on the magnitude of change in SID, although future monitoring of changes in all strong ions is needed to confirm this.” 

Reviewer 2

General

This is an interesting and potentially important study for the exogenous buffer literature. The study is well conducted and controlled. There is a vast amount of data representing a very high volume of work which has been conducted. There are important findings and useful practical recommendations for those choosing to use sodium citrate as an exogenous buffering agent. I do however have some concerns about the presentation of some parts of the manuscript which the authors need to address in order to make the information more accessible to the readership. I’ve tried to make the comments as useful as possible, so hopefully they’ll be helpful.

Thank you for taking the time to review our manuscript and provide these thoughtful comments. The authors have sought to address each of these comments in detail.

Introduction

Line 45: It would be useful to state why there is likely lower GIS with citrate.

Thank you for identifying this key detail. There is currently little experimental evidence on which to base an explanation for the potential differences between sodium citrate and sodium bicarbonate in terms of gastrointestinal (GI) symptoms. A recent investigation by Peacock et al. (2021) did however compare the two supplements for their respective GI symptoms responses, identifying that sodium bicarbonate may be expected to induce more GI disturbance. This recent study implemented a 300 mg.kg-1 BM sodium citrate dose, which is smaller than is typically implemented in sodium citrate research (500 mg.kg-1), so some further investigation is still needed to compare these two dietary supplements. As astutely noted in the Peacock et al. paper, the existing evidence on GI symptoms within the sodium bicarbonate and sodium citrate literature may be confounded by the use of varying measurement approaches (questionnaires, scales etc.) across prior investigations. As such, the authors have added a comment to lines 43-49 on page 3 of the revised manuscript, but have not discussed this in substantial detail, due to the limited existing evidence.

“These dietary supplements have been reported to induce some gastrointestinal (GI) disturbances [4-6], but it has been proposed that sodium citrate may induce fewer GI symptoms than sodium bicarbonate [7, 8]. A recent investigation identified that sodium citrate was indeed associated with reduced GI disturbances compared to sodium bicarbonate when the supplements were ingested at the same dose (300 mg.kg-1 BM) [8]. These findings provide preliminary evidence that sodium citrate may be a preferred alkalising agent from a GI disturbance perspective.”

Line 46: There is a very abrupt start to this paragraph and it would benefit from either a more introductory statement, or a better link from the previous paragraph.

Thank you for providing this suggestion. The authors have added an introductory segment to this sentence on lines 50-52 on page 3 of the revised manuscript.

“While buffering agent ingestion is typically undertaken with the intent of improving subsequent exercise performance, equivocal effects on exercise performance have been reported after sodium citrate supplementation [9-11].”

Line 47: “identified that ergogenic benefit…” should have an “an” between that and ergogenic. Line 49: move > 100% … to after “exercise”.

Thank you for highlighting these issues. The authors have now made the recommended changes to the Introduction on lines 52-54 of page 3 of the revised manuscript.

“A recent review identified that an ergogenic benefit was more frequently reported when completing short duration (> 60 s and < 420 s) and very high-intensity exercise (> 100% VO2max) compared to longer-duration exercise of any intensity [12].”

Lines 54-55: state why this ingestion time has previously been suggested.

The authors have addressed this question under the assumption that this comment refers to the ‘dose’ rather than ‘ingestion time’, given the line indicated by the reviewer. As such, the authors have added some detail to lines 61-63 on pages 3 and 4 of the revised manuscript.

“Based on the induced blood alkalosis and gastrointestinal symptoms reported in prior dose-response investigations, sodium citrate is recommended to be ingested at a dose of 500 mg.kg-1 body mass (BM) [4, 15].”

Line 58: The clarity of your terminology regarding the “duration of ingestion” is really confusing. The reader can easily confuse this with the pre-exercise ingestion period, so it is important for you to define exactly what you mean here. It took me a few attempts to read this section and fully understand it (this may well be a reflection on me of course, but it’s likely to also be the case for others).

Thank you for providing this comment. The authors have accepted this suggestion, and have adjusted the terminology throughout the manuscript. The previously used “ingestion duration” is now referred to as the “ingestion period” throughout the manuscript, and a definition of this terminology has been added to lines 64-67 of the Introduction of the revised manuscript. Please also note that this change in terminology has been implemented in the manuscript title, abstract, and all figures and tables.

“While sodium citrate dose and ingestion mode are somewhat established, no prior investigation has assessed the effect of the ingestion period (i.e. the time taken to complete ingestion of the entire dose of the supplement) on subsequent blood alkalosis, GI symptoms or palatability.”

Line 62: This feels a bit of a dead end. Where does it lead, where’s the “so what?”

Thank you for identifying this issue. The authors have adjusted the terminology and added detail to this section, on lines 67-73 on page 4 of the revised manuscript.

“The combined effect of a specific dose, mode and period of sodium citrate supplementation may also contribute to the suggested timing of ingestion (relative to the onset of exercise) required for performance benefit. Currently, sodium citrate supplementation is recommended to take place at least 180 min before the onset of exercise [4, 16], but changed physiological responses, palatability or GI symptoms according to the duration of the ingestion period have yet to be established.”

Lines 63-67: See previous comment about clarity of this ingestion period information.

As noted in response to the above comment, the authors have adjusted this terminology throughout the manuscript.

Line 78: The Heibel et al and Jones et al., papers might be better here.

Thank you for this suggestions. The authors agree that the Jones et al. (2016) and Heibel et al. (2018) papers are appropriate to be cited here, and these citations are now included on Line 89 on page 5 of the revised manuscript.

Line 81: “persistence” is an interesting choice of word, but it probably needs a bit of clarification.

Thank you for making this suggestion. The authors have adjusted the phrasing here to be more consistent with that used in the rest of the manuscript. The change is reflected in the Introduction on lines 92-94 on page 5 of the revised manuscript.

“Extending this post-ingestion observation period to 480 min would double the time explored by prior investigations, and may be sufficient to observe the full time interval where blood alkalosis remains elevated following sodium citrate supplementation.”

Line 83: “changed” might be better as “alterations to” or something similar.

Thank you for this suggestion. The authors have accepted this comment, which is now reflected in the Introduction on line 95 on page 5 of the revised manuscript.

“Sodium citrate supplementation likely induces blood alkalosis via alterations to strong ion difference (SID) [30, 31]…”

Line 91: Check the grammar here.

The authors have checked the grammar as requested, and have added a comma between the last two listed variables on line 104 on page 5 of the revised manuscript.

“Secondary aims were to establish the effect of sodium citrate ingestion period on blood [Na+], blood [Cl-], plasma [citrate], GI symptoms, and palatability.”

Methods

Line 95: Why 16?

Thank you for this query. For the current investigation, it was not possible to perform an accurate sample size estimate, due to an absence of comparable data in the prior sodium citrate literature, however we did use all available information to determine an appropriate sample size. Relevant data for a sample size calculation would have required a prior investigation to compare sodium citrate (or bicarbonate) ingestion durations over an eight hour period with no exercise performance test, given that the current investigation was assessing resting pre-exercise responses to supplementation only. The final study sample size of 16 participants in a cross-over design where four conditions were tested exceeds that of the vast majority of prior sodium citrate investigations where meaningful results have been reported for both resting blood alkalosis and also for exercise performance. The authors have acknowledged this as a limitation on lines 467-471 on page 26 of the revised manuscript.

“Finally, the sample size used in this study was based on pragmatic considerations, due to a lack of available data from comparable investigations assessing the effect of varying sodium citrate ingestion periods. However, the final sample size of 16 participants in a cross-over design where four conditions were tested exceeds the sample sizes of the majority of prior sodium citrate investigations.”

Line 96: height should always be described in m not cm. Lines 104-105: you don’t need to state the units for height and weight, it’s obvious, and you’ve already done it.

Thank you for highlighting this oversight. The authors have now adjusted the unit for height to metres rather than centimetres, as is reflect on line 108 on page 5 of the revised manuscript. Additionally, the units for height and body mass are no longer stated in the subsequent section (Study Design Overview), as per your suggestion.

Lines 119-120: “10:00 pm the night prior” is a little awkwardly written. Just state the washout period between trials was… you don’t need to clarify this with two sets of terms.

The authors have clarified the phrasing regarding the commencement of the fasting period on lines 132-133 on page 6 of the revised manuscript. This, however, does not refer to the washout period. As such, the authors have maintained the final sentence of the Study Design Overview session in its original form, where the washout between sessions is stated.

“Participants arrived at the laboratory following an overnight fast that commenced at 10:00 pm the night before each session.”

Line123: Please state the size of the capsules used to allow for possible replication.

Thank you for identifying this missing detail. The authors have now included the size of the capsules in the Methods section, on line 137 on page 7 of the revised manuscript.

“Participants ingested 500 mg.kg-1 BM sodium citrate (34.2 ± 6.3 capsules per participant) in size 0 gelatine capsules…”

Line 127: Why was such a small meal chosen. How does this relate to likely practice in feeding prior to exercise?

Thank you for posing this important question. The authors propose that the meal included in the current investigation (1.75 g/kg/bm CHO), while not excessive, is also not particularly small. This amount of carbohydrate is equal to or greater than that included in prior similar investigations of sodium citrate supplementation protocols [1, 2]. Further, this amount of carbohydrate falls within the range highlighted for pre-event fuelling as recommended to athletes by the ACSM [3].

As an example, a participant with a body mass equal to the mean of our entire participant group (68.3 kg) was provided with a meal comprising 119.5 g of CHO. This meal consisted of 750 mL of Powerade, 1 medium sized banana (approx. 120 g), 2 slices of multi-grain bread (approx. 20 g per slice), 1 serving of strawberry conserve/jam (13.6 g), and 1 Carman’s super berry muesli bar (approx. 45 g).

Line 135: it is unclear if this was exactly the same meal prescribed again. Please clarify.

The authors have added this detail to lines 150-152 on page 7 of the revised manuscript.

“Participants remained seated for the next 480 min, and a second meal was provided 240 min after completion of sodium citrate ingestion, comprising the same foods, quantities and carbohydrate content as the initial co-ingested meal.”

Lines 147-148: Whilst the radiometer’s validity and reliability are well established, can you provide some estimate or support for this assay’s TEM/CV or validity and reliability.

Thank you for providing this comment. The authors have sought to address this in the manuscript and in this response. The validity of this assay is presented in a study conducted by Moellering and Gruber (1966), the citation to which is now also included on line 164 on page 8 of the revised manuscript.

The authors have also conducted CV and TEM analyses on our own assay data to represent the reliability of said assay. The CV values have been added to lines 164-165 on page 8 of the revised manuscript.

“The intra-assay percentage coefficient of variation (%CV) for a mid-range citrate standard solution (i.e. 250µM) was 3.4%, and the inter-assay %CV was 10.3%.”

Further, the typical error of measurement (TEM) for this standard, with a mean delta fluorescence equal to 146.5, was 3.6 for the intra-assay and 10.7 for the inter-assay variation. The authors opted not to include the TEM values in the revised manuscript to prioritise clarity for the reader.

Line 151: add “the” between “and” and “volume”.

Thank you for providing this suggestion. The authors have accepted this comment, and made the change which is now reflected in the revised manuscript.

Lines 164-165: This is a statement, not a paragraph. It should also be placed last in this section, as it’s not an appropriate starting statement for a statistical analysis section.

Thank you for providing this suggestion. The authors have accepted this suggestion, and moved the statement to lines 210-211 on page 10 of the revised manuscript.

Lines 166-170: how did you determine the most appropriate model to use? What were the criteria? It would also be best practice to provide an estimate of effect size for these analyses. For the LMM you could consider Cohen’s F squared.

Thank you for this query. The models proposed in this study were directly defined by the factors involved in the experimental design (i.e. time, treatment, interaction time and treatment, order).

Regarding effect size estimates, we have now provided estimated differences and 95% confidence intervals for pairwise comparisons between treatments for all variables (excluding GI symptoms due to skewed data distributions) in the supplementary tables (S1, S2, S3, S4) that correspond to the tables within the revised manuscript (Table 1, Table 2, Table 3, Table 4). Pairwise comparisons have been provided for all outcomes independently of main treatment effect statistical significant to provide the reader with additional information on the effect sizes. We have also included, in the description of the results, the estimated differences instead of only p-values, so that readers can assess the magnitude of the differences for significant results. We used this approach rather than the standardised effect size measure because all of our outcomes are physiological or time (min) measures and therefore the absolute differences are clinically relevant and allow simpler interpretation.

Line 178: Don’t use personal pronouns in scientific writing. I know it’s become fashionable of late to do this, but it’s not good practice. Please do this for the other instances of this in the manuscript (we and our) are used on multiple occasions.

Thank you for providing this suggestion. The authors have accepted this comment and adjusted this throughout the revised manuscript.

Line 190; Don’t start sentences with abbreviations. Check this throughout the manuscript.

Thank you for providing this suggestion. The authors have accepted this comment and adjusted this throughout the revised manuscript.

Lines 194-195: “variables a and b..” this needs more clarity.

Thank you for providing this suggestion. The authors have now modified this sentence accordingly, and the changes appear on lines 209-210 on page 10 of the revised manuscript.

“The sum of all symptoms (a) and the total session rating (b) were reported as mean and range.”

Results

This is the section that I had some serious trouble with. I think it needs a complete re-think, because I got completely lost whilst reading it, and given that I have good knowledge and experience of this type of study, that means that most other will also likely struggle to access the information. The main issue is that there is just so much data and making comparison between the trial conditions is really difficult to follow. This isn’t helped by the clarity of some of the figures, which need solid lines and markers, and they need some of the error bars removing so that the actual data is visible, because it just look far too untidy at present. The key focus must surely be the comparison in the responses to the ingestion time periods, so I think you need to display all of the variable with that in mind, to allow the reader to make this visual comparisons for themselves.

The authors thank the reviewer for this thoughtful and thorough comment. The authors have considered this comment in depth, and have made substantial changes that are described below.

The authors acknowledge the limitations of the figure presentation as a part of the original submission and have made adjustments to all figures, which are attached to this resubmission. The major changes include combining several figures from the original submission, to reduce the total number of figures from 7 down to 3. Further, as suggested, the authors have now used solid lines rather than dashed lines on each chart, removed negative (below mean) confidence intervals (except for in Figure 1E due to the use of negative confidence interval in determining a window of time where blood [HCO3-] increase above baseline exceeded 6 mmol.L-1) to reduce clutter on each figure.

We have also reorganised the results section as suggested, and have indicated with italicised headings the results being described in each paragraph. We have included the estimated differences between pairs of treatments along with 95% CIs for all significant comparisons so that the readers can assess the magnitude of the effect associated with each comparison. We have added supplementary tables (Tables S1, S2, S3, and S4) where we report model-based pairwise comparisons between the four ingestion periods.

I was a little unsure if the figure titles were titles, or sub-sectioned paragraphs as they seemed to be presented in the middle of the results section, which was a little confusing.

Thank you for providing this comment. The authors would like to respectfully point out that the figure titles were formatted according to the requirements of PLOS ONE. As such, this formatting and placement has been retained from the original manuscript. With the reduction in the number of figures, and therefore figures titles, from 7 down to 3 (outlined in the previous response), there may be less confusing presented by the figure titles.

One strategy for making the description of the results easier to read, it to avoid using the term “significant” as much as possible. That forces you to write about data, rather than the stats outcomes. Remember that the stats outcomes, are there as supporting evidence, they should not be the sole focus. Try to describe the response of the variables and that show improve this section.

Thank you for providing this suggestion. The authors have removed or changed the use of the word ‘significant’ throughout the revised manuscript, particularly in the Discussion section where the key findings are elaborated on. Further to this, we have added estimated differences alongside or instead of p-values in the Results section of the revised manuscript.

Discussion

Generally, this was a good section with some nice flow and useful information and interpretation.

Line 329: given the size of some of the error bars, certainly initially, I’m not convinced that all of the participants would calls their GIS as “minor”. So can you re-phrase this to reflect that.

To ensure that the data is presented in a manner that better represents the GI symptoms, the y-axes in Figure 3A and 3B have been adjusted within the revised manuscript, so that the axis break occurs at a rating of 24 rather than 12. Further, the authors have changed the terminology on line 323-325 of page 20 of the revised manuscript, in order to more accurately report that the symptoms were overwhelmingly minor in the context of the maximum number/severity of symptoms that could have been reported by our participants.

“The sodium citrate ingestion period did not impact palatability, and the mean reported GI symptoms were minor for all ingestion protocols at all times.”

Line 336: replace “levels” with “concentration” throughout the manuscript when describing a blood or urine parameter.

Thank you for providing this suggestion, the authors have accepted and made this change throughout the revised manuscript.

Line 338: we can assume this is significant, so you don’t need the p-value.

Thank you for providing this suggestion, the authors have accepted and made this change to the revised manuscript.

Line 346: this is awkwardly phrased.

Thank you for providing this comment, the authors have adjusted the phrasing on lines 345-348 on page 21 of the revised manuscript to clarify this point.

“Prior investigations had undertaken post-ingestion observation periods with a duration of up to 240 min [4, 16], therefore the complete time interval where induced blood alkalosis was significantly elevated (beyond 240 min post-ingestion) was unknown.”

Line 350: “dosage” is a poor term. Dose is better. It would be worth clarifying this type of effect, to that seen with delayed-release capsule ingestion as the response of more gradual absorption is similar.

Thank you for providing this suggestion, “dosage” has now been changed to “dose” in the revised manuscript.

The authors have also added a section to lines 352-357 on page 21 of the revised manuscript in reference to the second portion of this comment.

“This effect may be considered similar to that previously reported within the sodium bicarbonate literature, when comparing gelatine capsules to delayed-release capsules. Delayed-release or enteric-coated capsules have been reported to delay the occurrence of peak blood alkalosis when compared to gelatine capsules (by approx. 20-24 min [43, 44]) in a similar fashion to that seen when comparing the 15 and 60 min ingestion periods in the current investigation (by approx. 20 min).”

Line 354: “our laboratory” is a bit pretentious. Is this really needed? Just reference the paper.

Thank you for providing this suggestion. The authors have accepted this comment and adjusted this throughout the revised manuscript.

Lines 362-368: Nice section.

Double check you use of square parentheses throughout the manuscript, especially in sentences where you have them next to “blood”.

The authors have proofed/edited the manuscript, and can confirm that the use of square brackets currently appears to be correct, in that square brackets have been used only to represent a concentration (e.g. blood [HCO3-] represents a concentration of bicarbonate ions within the blood).

Lines 394-396: This may have been due to capsule size differences.

Thank you for highlighting this potential explanation. The authors have adjusted the discussion of these findings on lines 405-410 on pages 23-24 of the revised manuscript.

“This occurred one to two hours later than that seen in prior investigations of plasma [citrate] [48, 49]. These differences are most likely due to the greater citrate load ingested in the current investigation (500 mg.kg-1 BM sodium citrate dose vs 40 mEq. potassium citrate (approximately 185 mg.kg-1 BM dose)), and/or possibly due to the differing ingestion modes implemented across studies (gelatine capsules in the current investigation, tablets or solution in prior investigations [48, 49]).”

The discussion might be better with the subheading removed, and the material in each included in other paragraphs or elsewhere (just a consideration really).

Thank you for providing this suggestion. The authors have thoroughly considered and discussed this idea, but have decided to retain the current discussion structure in terms of sub-headings and content location. The authors opine that addressing each sub-headed topic in isolation allows for deeper elaboration on each key finding of the current investigation, and the sub-headings allow for easier navigation for the reader.

Lines 431-439: This section reads like a results section, rather than a discussion.

Thank you for this comment. The authors have adjusted the focus of this ‘Palatability’ section on lines 446-456 on pages 25 and 26 of the revised manuscript. This section now focusses more on the practicality or transferability of these findings.

“No difference was detected when comparing the sodium citrate ingestion protocols of varying duration for palatability (p > 0.05). Palatability (across treatments) ranged from 5.3 to 5.9, which corresponds to a rating of between ‘neither like nor dislike’ and ‘like slightly’ [40]. A low palatability, especially for foods or fluids that are excessively salty, can be associated with avoidance of that particular food or fluid [53, 54]. From a practical perspective, higher palatability ratings may increase the extent to which a dietary supplementation strategy could be implemented in the context of high-intensity exercise. The broad similarity in palatability across treatments was to be expected, given the standardisation of the sodium citrate dose, ingestion mode, and co-ingested food and fluid. The moderate palatability ratings reported by participants of this investigation indicate that sodium citrate may be feasible for inclusion in training or competition routines.”

Lines 441: can you really conclude that athletes can use this strategy, given that you have recruited active participants?

Thank you for identifying this. This point has now been addressed in the new Limitations section in the revised manuscript, which was recommended by reviewer 1. The authors have also adjusted the phrasing on lines 472-477 on page 26 of the revised manuscript.

“Based on the findings of the current investigation, it is recommended that sodium citrate be ingested across a 15-45 min period, with ingestion completed 150-270 min before the commencement of exercise, particularly for individuals competing in events where there may be performance benefit after induced blood alkalosis. Adherence to the recommended dose of 500 mg.kg-1 BM, ingested in gelatine capsules alongside a small carbohydrate-rich meal is recommended.”

Figures and Tables

Tables: these are generally clear, but they would benefit from the removal of as many borders and lines as possible.

Thank you for providing this suggestion, the authors have accepted and actioned this in the revised manuscript.

Figures: add line markers and remove some of the error bars for clarity. Don’t use letters to highlight significance as the figures with multiple graphs on are also labelled with letters. Make it easier for the reader to make comparisons between trials.

Thank you for providing these suggestions. The authors have added feint line markers to all figures. The authors have adjusted the indicators of significance on all parts of Figures 1 and 2, and made the related changes to the figure titles/descriptions in the revised manuscript. The updated figures are attached as a part of this re-submission.

1. Urwin CS, Dwyer D, Carr AJ. Induced alkalosis and gastrointestinal symptoms after sodium citrate ingestion: a dose-response investigation. Int J Sport Nutr Exerc Metab. 2016;26(6):542-8.

2. Urwin CS, Snow RJ, Orellana L, Condo D, Wadley GD, Carr AJ. Sodium citrate ingestion protocol impacts induced alkalosis, gastrointestinal symptoms, and palatability. Physiological Reports. 2019;7(19):14216.

3. Thomas D, Erdman K, Burke L. American College of Sports Medicine joint position statement on nutrition and athletic performance. Med Sci Sports Exerc. 2016;48(3):543-68.

Attachment

Submitted filename: Response to Reviewers.docx

Decision Letter 1

Lars McNaughton

4 May 2021

Does varying the ingestion duration of sodium citrate influence blood alkalosis and gastrointestinal symptoms?

PONE-D-21-03700R1

Dear Dr. Urwin,

We’re pleased to inform you that your manuscript has been judged scientifically suitable for publication and will be formally accepted for publication once it meets all outstanding technical requirements.

Within one week, you’ll receive an e-mail detailing the required amendments. When these have been addressed, you’ll receive a formal acceptance letter and your manuscript will be scheduled for publication.

An invoice for payment will follow shortly after the formal acceptance. To ensure an efficient process, please log into Editorial Manager at http://www.editorialmanager.com/pone/, click the 'Update My Information' link at the top of the page, and double check that your user information is up-to-date. If you have any billing related questions, please contact our Author Billing department directly at authorbilling@plos.org.

If your institution or institutions have a press office, please notify them about your upcoming paper to help maximize its impact. If they’ll be preparing press materials, please inform our press team as soon as possible -- no later than 48 hours after receiving the formal acceptance. Your manuscript will remain under strict press embargo until 2 pm Eastern Time on the date of publication. For more information, please contact onepress@plos.org.

Kind regards,

Lars McNaughton, PhD

Academic Editor

PLOS ONE

Additional Editor Comments (optional):

Reviewers' comments:

Reviewer's Responses to Questions

Comments to the Author

1. If the authors have adequately addressed your comments raised in a previous round of review and you feel that this manuscript is now acceptable for publication, you may indicate that here to bypass the “Comments to the Author” section, enter your conflict of interest statement in the “Confidential to Editor” section, and submit your "Accept" recommendation.

Reviewer #1: All comments have been addressed

Reviewer #2: All comments have been addressed

**********

2. Is the manuscript technically sound, and do the data support the conclusions?

The manuscript must describe a technically sound piece of scientific research with data that supports the conclusions. Experiments must have been conducted rigorously, with appropriate controls, replication, and sample sizes. The conclusions must be drawn appropriately based on the data presented.

Reviewer #1: Yes

Reviewer #2: Yes

**********

3. Has the statistical analysis been performed appropriately and rigorously?

Reviewer #1: Yes

Reviewer #2: Yes

**********

4. Have the authors made all data underlying the findings in their manuscript fully available?

The PLOS Data policy requires authors to make all data underlying the findings described in their manuscript fully available without restriction, with rare exception (please refer to the Data Availability Statement in the manuscript PDF file). The data should be provided as part of the manuscript or its supporting information, or deposited to a public repository. For example, in addition to summary statistics, the data points behind means, medians and variance measures should be available. If there are restrictions on publicly sharing data—e.g. participant privacy or use of data from a third party—those must be specified.

Reviewer #1: No

Reviewer #2: Yes

**********

5. Is the manuscript presented in an intelligible fashion and written in standard English?

PLOS ONE does not copyedit accepted manuscripts, so the language in submitted articles must be clear, correct, and unambiguous. Any typographical or grammatical errors should be corrected at revision, so please note any specific errors here.

Reviewer #1: Yes

Reviewer #2: Yes

**********

6. Review Comments to the Author

Please use the space provided to explain your answers to the questions above. You may also include additional comments for the author, including concerns about dual publication, research ethics, or publication ethics. (Please upload your review as an attachment if it exceeds 20,000 characters)

Reviewer #1: I would like to thank the authors for considering my comments, which I believe they have adequately addressed.

Congratulations on the interesting work, looking forward to more!

Reviewer #2: The authors should be commended on the high volume of work, along with the quality of what they have done in revising the manuscript. It reads far better than the original submission and you have addressed all of my comments and suggestions.

**********

7. PLOS authors have the option to publish the peer review history of their article (what does this mean?). If published, this will include your full peer review and any attached files.

If you choose “no”, your identity will remain anonymous but your review may still be made public.

Do you want your identity to be public for this peer review? For information about this choice, including consent withdrawal, please see our Privacy Policy.

Reviewer #1: Yes: Bryan Saunders

Reviewer #2: Yes: S. Andy Sparks

Acceptance letter

Lars McNaughton

7 May 2021

PONE-D-21-03700R1

Does varying the ingestion period of sodium citrate influence blood alkalosis and gastrointestinal symptoms?

Dear Dr. Urwin:

I'm pleased to inform you that your manuscript has been deemed suitable for publication in PLOS ONE. Congratulations! Your manuscript is now with our production department.

If your institution or institutions have a press office, please let them know about your upcoming paper now to help maximize its impact. If they'll be preparing press materials, please inform our press team within the next 48 hours. Your manuscript will remain under strict press embargo until 2 pm Eastern Time on the date of publication. For more information please contact onepress@plos.org.

If we can help with anything else, please email us at plosone@plos.org.

Thank you for submitting your work to PLOS ONE and supporting open access.

Kind regards,

PLOS ONE Editorial Office Staff

on behalf of

Dr. Lars McNaughton

Academic Editor

PLOS ONE

Associated Data

    This section collects any data citations, data availability statements, or supplementary materials included in this article.

    Supplementary Materials

    S1 Table. Pairwise comparisons (mean difference, 95% CI) of post-ingestion session values for blood variables (blood pH, blood [HCO3-], blood [Na+] and blood [Cl-]) following ingestion of 500 mg.kg-1 BM sodium citrate over 15, 30, 45 or 60 min (n = 16 participants, 18 observations per participant per treatment).

    (DOCX)

    S2 Table. Pairwise comparisons (mean difference, 95% CI) of curve characteristics for blood pH and blood bicarbonate concentration ([HCO3-]) following ingestion of 500 mg.kg-1 BM sodium citrate over 15, 30, 45 or 60 min (n = 16 participants, 18 observations per participant per treatment).

    (DOCX)

    S3 Table. Pairwise comparisons (mean difference, 95% CI) of curve characteristics for blood sodium concentration ([Na+]), blood chloride concentration ([Cl-]) and plasma citrate concentration ([citrate]) following ingestion of 500 mg.kg-1 BM sodium citrate over 15, 30, 45 or 60 min (n = 16 participants, 18 observations per participant per treatment).

    (DOCX)

    S4 Table. Pairwise comparisons (mean difference, 95% CI) of palatability (n = 16 participants) and urinary excretion values (n = 8 participants) following ingestion of 500 mg.kg-1 BM sodium citrate over 15, 30, 45 or 60 min.

    (DOCX)

    Attachment

    Submitted filename: Response to Reviewers.docx

    Data Availability Statement

    The dataset can be accessed via the following: DOI: 10.26187/tkah-h625 URL: http://hdl.handle.net/10536/DRO/DU:30149426.


    Articles from PLoS ONE are provided here courtesy of PLOS

    RESOURCES