Abstract
Background
Although CT-based body composition (BC) metrics may inform disease risk and outcomes, obtaining these metrics has been too resource intensive for large-scale use. Thus, population-wide distributions of BC remain uncertain.
Purpose
To demonstrate the validity of fully automated, deep learning BC analysis from abdominal CT examinations, to define demographically adjusted BC reference curves, and to illustrate the advantage of use of these curves compared with standard methods, along with their biologic significance in predicting survival.
Materials and Methods
After external validation and equivalency testing with manual segmentation, a fully automated deep learning BC analysis pipeline was applied to a cross-sectional population cohort that included any outpatient without a cardiovascular disease or cancer who underwent abdominal CT examination at one of three hospitals in 2012. Demographically adjusted population reference curves were generated for each BC area. The z scores derived from these curves were compared with sex-specific thresholds for sarcopenia by using χ2 tests and used to predict 2-year survival in multivariable Cox proportional hazards models that included weight and body mass index (BMI).
Results
External validation showed excellent correlation (R = 0.99) and equivalency (P < .001) of the fully automated deep learning BC analysis method with manual segmentation. With use of the fully automated BC data from 12 128 outpatients (mean age, 52 years; 6936 [57%] women), age-, race-, and sex-normalized BC reference curves were generated. All BC areas varied significantly with these variables (P < .001 except for subcutaneous fat area vs age [P = .003]). Sex-specific thresholds for sarcopenia demonstrated that age and race bias were not present if z scores derived from the reference curves were used (P < .001). Skeletal muscle area z scores were significantly predictive of 2-year survival (P = .04) in combined models that included BMI.
Conclusion
Fully automated body composition (BC) metrics vary significantly by age, race, and sex. The z scores derived from reference curves for BC parameters better capture the demographic distribution of BC compared with standard methods and can help predict survival.
© RSNA, 2020
Online supplemental material is available for this article.
See also the editorial by Summers in this issue.
Summary
Population-scale fully automated body composition analysis of routine abdominal CT examinations was used to generate reference curves that capture the distribution of body composition by race, sex, and age.
Key Results
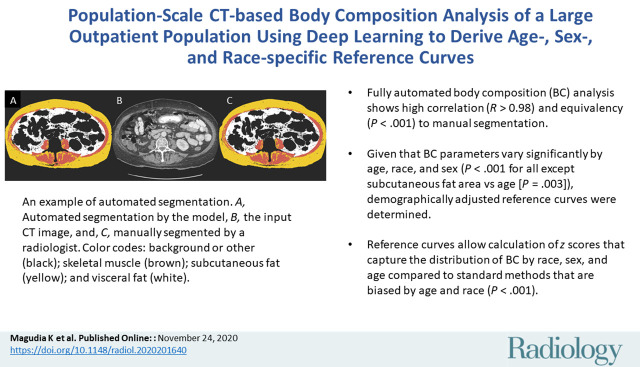
■ Fully automated body composition (BC) analysis showed high correlation (R > 0.98) and equivalency (P < .001) to manual segmentation.
■ Given that BC parameters varied significantly by age, race, and sex (P < .001 for all except subcutaneous fat area vs age [P = .003]), demographically adjusted reference curves were determined.
■ Reference curves allow calculation of z scores that capture the distribution of BC by race, sex, and age compared with standard methods that are biased by age and race (P < .001).
Introduction
Body composition (BC) quantifies the proportion of muscle and adipose tissue, traditionally approximated with body mass index (BMI). BMI is an evidence-based marker of health and disease risk used to define criteria for overweight and obese patients (1). However, BMI has low specificity for identifying excess adipose tissue, varying significantly in its correlation with adipose tissue by sex, age, and race or ethnicity (2,3).
A commonly used method for more accurate assessment of BC requires analysis of a single axial CT slice through the third lumbar vertebral body (L3) (4). The L3 slice correlates well with whole-body skeletal muscle (SM), visceral fat (VF), and subcutaneous fat (SF) volumes (R = 0.92, 0.96, and 0.89, respectively) (5,6). Boundaries of these tissues are identified anatomically, and the area is quantified with established Hounsfield unit ranges, yielding SM area, VF area, and SF area (7). To date, the time and expertise required for manual BC analysis has precluded widespread clinical use (8). Furthermore, the few published deep learning models do not include selection of the appropriate CT slice and/or were not trained with routine abdominal CT examinations (9–13).
BC areas have shown usefulness in the assessment of cardiovascular risk. Although both VF and SF areas are associated with insulin resistance and left ventricular remodeling, VF area is associated with lower cardiac output and higher systemic vascular resistance (14–16). VF area has also been shown to be independently associated with metabolic syndrome and major cardiovascular events in patients with colon cancer as well as in an asymptomatic screening population (17–19).
Furthermore, BC has been linked to prognosis and chemotherapy toxicity in patients with cancer and to the risk of developing cancer. Cachexia or significant weight loss is known to be associated with poor prognosis. Sarcopenia, the loss of muscle mass generally calculated with sex-specific thresholds of SM index, and decreased muscle attenuation, which reflects lipid deposition and muscular atrophy, may occur without substantial weight loss, especially in obese patients, and are associated with survival in multiple tumor types (7,20–22). Furthermore, sarcopenia is associated with increased chemotherapy toxicity (21,23). Last, the incidence of multiple tumor types is associated with various indexes of adiposity (24). These data show that BC is too complex to be approximated with BMI alone.
We developed a fully automated BC analysis pipeline in which deep learning was used to calculate BC parameters from routine abdominal CT examinations (25). The aim of this study was to demonstrate the validity of this pipeline, to apply this fully automated BC analysis pipeline to abdominal CT examinations to define age-, sex-, and race-normalized BC reference curves, and to show the usefulness of these curves compared with standard methods in the prediction of 2-year survival in a large, cross-sectional outpatient population.
Materials and Methods
The Mass General Brigham (formerly Partners HealthCare) institutional review board approved this study and waived informed consent. All procedures were compliant with the Health Insurance Portability and Accountability Act.
Neural Network Model Data Sets
An internal data set included a single abdominal CT examination for each of 604 patients with pancreatic adenocarcinoma enrolled in a multi-institutional research protocol and was randomly partitioned into 421 training, 94 validation, and 89 internal test examinations (26). Two hundred ninety-six patients were men (49%) and 308 were women (44%), with a median age of 64 years (interquartile range, 14 years). An external test data set included 534 abdominal CT examinations from patients with lymphoma from a different institution; these patients were described in a separate publication (27). Demographic data are not available for the external data set owing to anonymization from the source cohort. Examinations were performed with varying hardware, imaging parameters, and use of oral or intravenous contrast material.
After selection of a CT slice at L3, four 3rd- or 4th-year radiology residents (including N.M. and W.C.W.) performed initial manual segmentation of SM, VF, and SF areas with software (internal data set: sliceOmatic [TomoVision, Magog, Canada]; external data set: OsiriX [Pixmeo, Bernex, Switzerland]). Specific Hounsfield unit ranges for muscle (−29 to 150 HU) and fat (−190 to −30 HU) were used (7). The residents were first trained with 20 cases and had to reach a coefficient of variance of less than 3% with these 20 cases. All segmentations were separately reviewed and edited by a board-certified radiologist (M.H.R., with 13 years of experience). Annotators had access to only the CT image data.
Analysis Pipeline, Model Training, and Testing
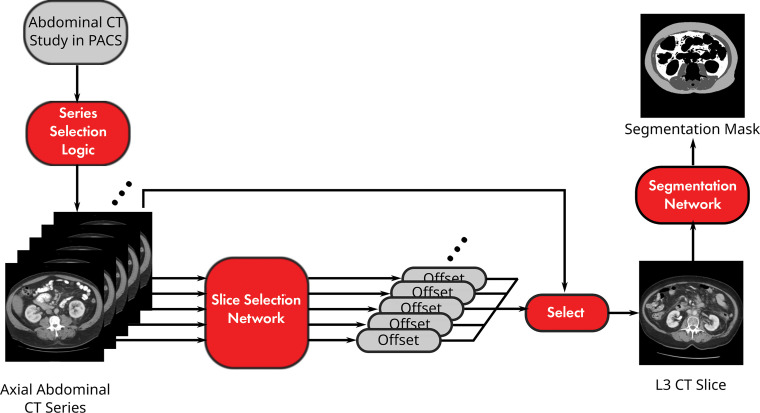
The analysis pipeline included series selection and two convolutional neural network models (Fig 1, Appendix E1 [online]). The preliminary pipeline was published as a conference paper (25). The source code for this study is available online (https://github.com/CPBridge/ct_body_composition [commit 399d06e74e4ec18290cc3f1021b0f8e3fa6e4e5a]).
Figure 1:
Diagram shows pipeline for fully automated body composition analysis of abdominal CT examinations. PACS = picture archiving and communication system.
A DenseNet architecture model was used to predict the spatial offset of a given slice from the radiologist-selected L3 slice saturated by the sigmoid function (Fig E1a [online]) (28). Input images were downsampled to 256 × 256 and normalized to soft-tissue window (level, 40 HU; width, 400 HU). Regression outputs for an entire series underwent Gaussian smoothing, and the slice closest to zero was selected as the L3 slice. The model was trained with a mean absolute error loss function of the spatial offset and tested on the external test data set.
A U-Net architecture model was used to segment the L3 slice according to SM, VF, and SF (Fig E1b [online]). Native 512 × 512 resolution images were normalized to soft-tissue window (29). The model was trained with a total Dice loss function across classes and tested on 89 internal test cases (30).
Combined model performance was assessed by comparing the calculated areas from our analysis pipeline with the manual segmented external data set with Pearson correlation coefficients.
Cross-sectional Population Cohort
All adult outpatients who underwent abdominal CT examination in 2012 at Brigham and Women’s Hospital, Massachusetts General Hospital, and Dana-Farber Cancer Institute were identified in the Partners HealthCare Research Patient Data Registry. Demographic data, BMI, weight, height, smoking status, diagnosis codes, and death data were retrieved from the electronic medical record and Social Security Death Index.
The earliest examination was selected per patient and retrieved in Digital Imaging and Communications in Medicine format; 0.2% (51 of 28 462 examinations) failed retrieval and were excluded. Inference was performed by using our fully automated BC analysis without retraining. For examinations with multiple axial series, the axial series with the greatest slice thickness, greatest slice number, and maximum VF area was selected with sequential tie breaking.
Cases with automatically generated flags for potential errors in slice selection based on model output were excluded. These excluded cases were manually reviewed for actual slice selection errors. Quality assurance for BC segmentation was performed by a radiologist (K.M., a 4th year radiology resident at the time of the study) on a random 2% (n = 564) of cases.
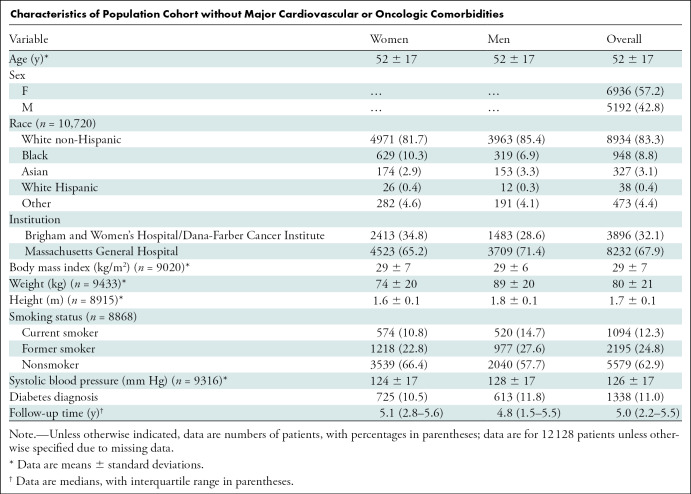
We excluded patients with major cardiovascular (n = 9531) and/or oncologic (n = 14 531) diagnosis codes according to the International Classification of Diseases, ninth revision (except hypertension and nonmelanomatous skin cancers) in the electronic medical record within 3 months of the examination date, which yielded 12 128 cases (mean patient age, 52 years; 6936 women [57%]) (Table).
Characteristics of Population Cohort without Major Cardiovascular or Oncologic Comorbidities
Statistical Analysis
Independent samples t tests and normal linear regression were used to determine associations between the BC areas and age, sex, and race.
A total of 100 cases, separate from the model training or testing data sets, were analyzed by means of our fully automated pipeline and manually segmented by two independent readers (N.M. [reader 1], a 3rd-year resident, and M.H.R. [reader 2], a board-certified attending radiologist with 13 years of experience), and reader 1 was overread by reader 2 (subsequently referred to as “reader 1+2”; similar process compared with that described for the internal data set annotation). Reader 1 reviewed the same set of cases with at least a 1-month washout between sessions. A formal test for equivalency was performed between our pipeline and reader 1+2 with two one-sided t tests (an equivalence test) (α = .05) (31). The margin of equivalence was ±5%. Variances were compared between each reader and our fully automated BC analysis by using an extension of the Levene test (32).
Reference curves over age by race and sex were created for BC areas and indexes (height-normalized areas), weight, and BMI by using the lms function of the GAMLSS R package (version 5.1–6, 2019, open source) for the following subgroups from the cross-sectional population cohort: White non-Hispanic patients aged 18–90 years, Black female patients aged 18–75 years, and Black male patients aged 18–70 years (33–35). Other groups were not modeled owing to limited representation in our cohort. The source code for creating the reference curves is available online (https://github.com/CPBridge/ct_body_composition [commit 399d06e74e4ec18290cc3f1021b0f8e3fa6e4e5a]).
The proportion of the cross-sectional population cohort with sarcopenia was calculated by using previously published thresholds of SM index of less than 55 cm2/m2 for men and less than 39 cm2/m2 for women (7), resulting in 35% of patients being classified as having sarcopenia. For SM index data normalized by means of our reference curves, a z-score cutoff of −0.40 corresponded to 35% of our cohort having sarcopenia. To compare how the proportion of patients classified as having sarcopenia defined by the sex-specific thresholds varied according to age category and race when compared with the z-score method, which yielded a constant sarcopenia frequency of 35% regardless of race and age category, two-sided Pearson χ2 goodness-of-fit tests were performed across age and race categories wherein the null hypotheses were that the percentage with sarcopenia as defined according to sex-specific thresholds within each age and race category was equal to 35%.
To evaluate associations of 2-year overall survival, hazard ratios with 95% CIs were calculated by using Cox proportional hazards models. Predictors were BC areas, weight, and BMI z scores modeled as four-knot cubic splines with knots defined at quartiles. The first multivariable model included all BC areas (SM, VF, and SF), the second included BC areas and weight, and the third included BC areas and BMI. Kaplan-Meier curves were constructed for BC variables for up to 2 years of follow-up.
All analyses were performed by C.P. Bay in SAS (version 9.4, 2016; SAS Institute, Cary, NC) except for the derivation of the reference curves, which was performed with R statistical software (version 3.5.1, 2018; R Foundation for Statistical Computing, Vienna, Austria). All testing was two tailed, and P < .05 was considered to indicate a statistically significant difference. See Appendix E1 (online) for additional details.
Results
Model Performance and Equivalency Testing
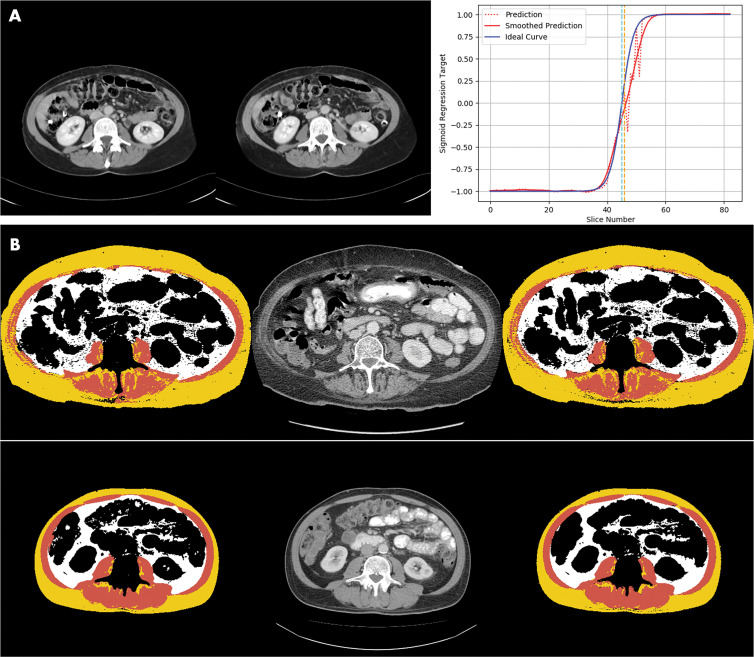
The slice selection model chose the L3 slice with a median error of 5 mm, a mean error of 11 mm, and a maximum error of 40 mm in the external test data set. The mean error was within the range of the L3 vertebral body in most patients, as the mean height of the L3 vertebral body in previous studies had been determined to be approximately 30 mm (36). A sample comparison of a radiologist-chosen L3 slice and an automatically chosen L3 slice is demonstrated in Figure 2, A.
Figure 2:
Images demonstrate examples of model output for deep learning body composition pipeline. A, Examples of automated slice selection. The left CT slice was automatically selected by the model; the right CT slice was selected by a radiologist. Graph shows output of L3 regression model. Two vertical lines represent slices selected by radiologist (light blue) and by algorithm (orange). Dotted red line is unfiltered prediction; fluctuations in this curve correspond to adjacent vertebral levels. Zero crossing of filtered prediction is chosen as L3 level by algorithm (solid red line). B, Two examples of automated segmentation results, one per row. Left image shows automated segmentation by the model, the middle image is the input CT slice, and the right image is manually segmented ground truth produced by the radiologist. Color interpretation for segmentation masks are as follows: background or other, black; skeletal muscle, brown; subcutaneous fat, yellow; and visceral fat, white.
The segmentation model assigned pixels to the muscle, SF, and VF classes with mean Dice scores (±standard deviation) of 0.97 ± 0.03, 0.98 ± 0.02, and 0.95 ± 0.10, respectively, in the internal test data set. Comparison of representative automatic segmentation and manually segmented ground truth is demonstrated in Figure 2, B.
In the fully automated pipeline executed on the external test data set to determine integrated end-to-end performance, the muscle compartment showed a mean absolute error versus the fully human analysis of 4.3 cm2 and a mean relative error of 3.1% (R = 0.99). For the SF compartment, the mean absolute error was 10.9 cm2 and the mean relative error was 5.9% (R = 0.99). For the VF compartment, the mean absolute error was 7.9 cm2 and the mean relative error was 6.5% (R = 0.99).
Formal testing for equivalency between our fully automated pipeline and standard manual segmentation—a resident overread by an attending physician—showed equivalence for all BC areas and L3 slice selection (P < .001) (Table E1 [online]), with no significant difference in the variances (P > .05 for all areas and table position of selected slice) (Table E2 [online]).
Quality Assurance Analysis for Cross-sectional Population Cohort
A single abdominal CT examination was analyzed with our pipeline for each of 28 411 outpatients who underwent abdominal CT examination in 2012 in our hospital system; 192 examinations were flagged as having a potential error in slice selection based on model output and were subsequently excluded. Manual review of these examinations showed that only 13.5% of these examinations (26 of 192) had inappropriate slice selection.
Radiologist review of a random 2% (564 of 28 411) of remaining cases revealed a 2.5% (14 of 564) segmentation error rate. Causes of failure included intraabdominal SM or SF (n = 5), limited reconstruction field of view (n = 3), SF segmented as VF or SM (n = 2), limited scan field of view (n = 1), beam-hardening artifact (n = 1), arms in the field of view (n = 1), and anasarca (n = 1).
Characteristics of Population Cohort without Major Cardiovascular or Oncologic Comorbidities
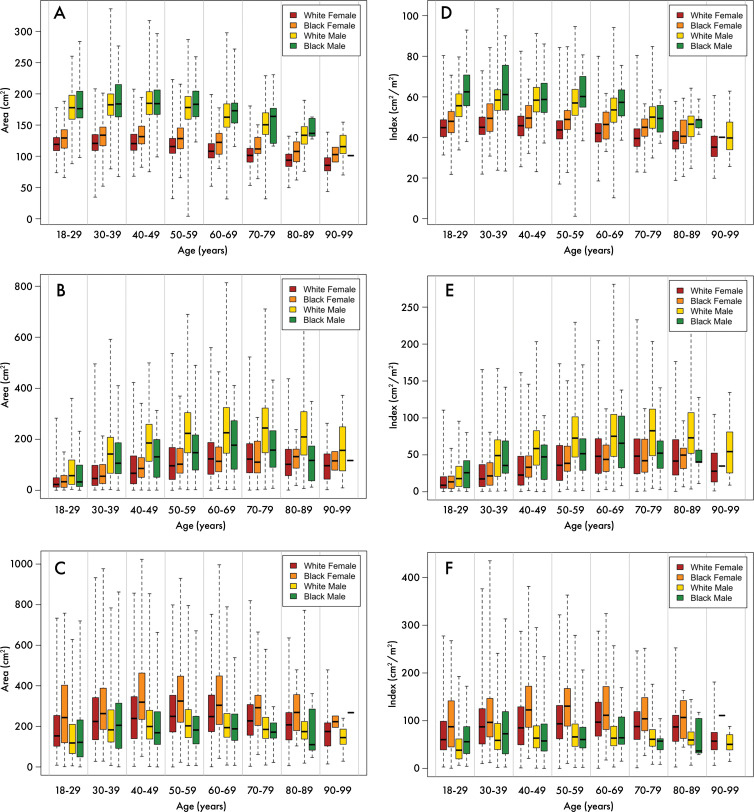
Of the 28 411 patients whose examinations were initially analyzed, 12 128 did not have a known major cardiovascular or cancer diagnosis at the time of the examination and were selected to be broadly representative of the general population. Characteristics of this cohort are described in the Table. BC areas of these patients varied significantly by age, sex, and race (P < .001 for all except SF area vs age [P = .003]) (Fig 3).
Figure 3:
Distribution of body composition parameters according to race and sex. Box-and-whisker plots show, A, skeletal muscle area, B, visceral fat area, C, subcutaneous fat area, D, skeletal muscle index, E, visceral fat index, and, F, subcutaneous fat index in outpatient population in White non-Hispanic women (red), Black women (orange), White non-Hispanic men (yellow), and Black men (green). Line within box represents the median, box represents interquartile range, and dashed lines represent maximum and minimum values in our population.
Reference Curves for BC
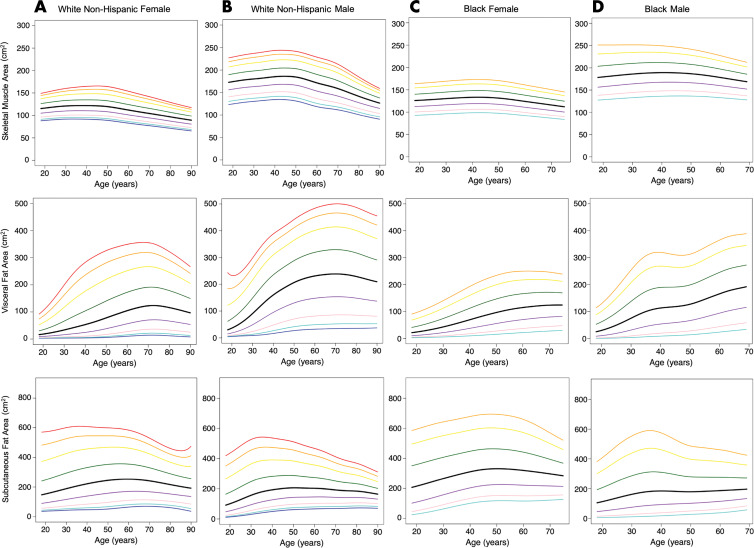
Age-varying reference curves were calculated according to sex and race for both BC areas and indexes (area normalized by height) (Figs 4, E2 [online]; Table E3 [online]). As expected, the reference curves showed qualitative variation by age, sex, and race. Trends such as greater SM and VF areas and mildly lower SF area in men than in women were noted. In addition, there is a trend to lose SM area as patients get older, most notably in White non-Hispanic patients compared with Black patients. As patients get older, there is an overall increase in VF area; an increase is not seen in SF area. Although SM area seems overall similar between White non-Hispanic patients and Black patients, VF area is decreased in Black compared with White non-Hispanic patients.
Figure 4:
Graphs show reference curves of body composition areas for, A, White non-Hispanic female patients (n = 4971), B, White non-Hispanic male patients (n = 3963), C, Black female patients (n = 629), and, D, Black male patients (n = 319). From inferior to superior, lines represent third (dark blue), fifth (light blue), 10th (pink), 25th (purple), 50th (black), 75th (green), 90th (yellow), 95th (orange) and 97th (red) percentiles.
Reference curves were also generated for weight and BMI (Fig E3 [online], Table E4 [online]).
Correlation between Weight, BMI, and BC z Scores
The following Spearman correlation coefficients were calculated on the z-score scale and represent the extent of deviation of a particular patient’s data compared with the mean value in patients of the same race, sex, and age. Weight showed a positive correlation with SM area (Spearman correlation coefficient: 0.60 [95% CI: 0.58, 0.61], P < .001), VF area (Spearman correlation coefficient: 0.70 [95% CI: 0.69, 0.71], P < .001), and SF area (Spearman correlation coefficient: 0.81 [95% CI: 0.80, 0.82], P < .001). BMI showed positive correlation with SM area (Spearman correlation coefficient: 0.53 [95% CI: 0.51, 0.54], P < .001), VF area (Spearman correlation coefficient: 0.73 [95% CI: 0.72, 0.74], P < .001), and SF area (Spearman correlation coefficient: 0.82 [95% CI: 0.81, 0.83], P < .001). Height showed a positive correlation with SM area (Spearman correlation coefficient: 0.23 [95% CI: 0.21, 0.25], P < .001), VF area (Spearman correlation coefficient: 0.03 [95% CI: 0.003, 0.05], P = .03), and SF area (Spearman correlation coefficient: 0.07 [95% CI: 0.04, 0.09], P < .001).
Application of z Scores Derived from Reference Curves
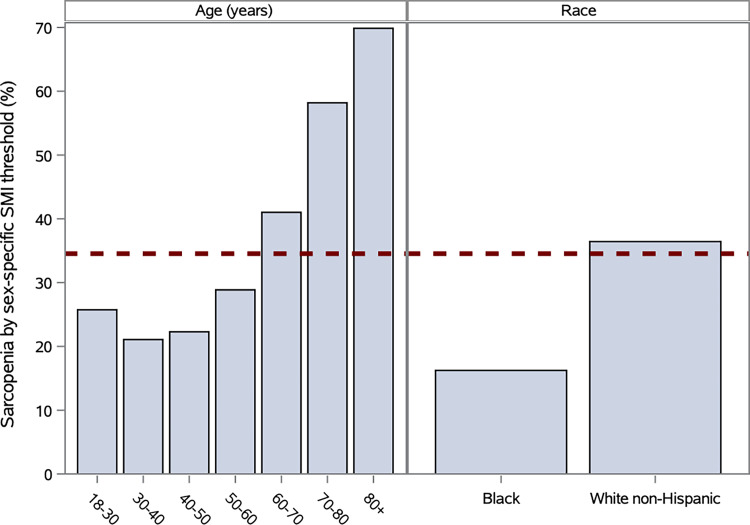
Established sex-specific thresholds for SM index to define sarcopenia were applied to our cohort, and 35% of patients were classified as having sarcopenia (7). Goodness-of-fit tests of sarcopenia category according to age and race versus a null hypothesis of a uniform 35% fraction showed significant bias across age and race groups (P < .001 for age and race) (Fig 5). In comparison, the z-score method applied with a uniform z score threshold of −0.40 yields the same overall prevalence of sarcopenia with uniform distributions across age and race group by definition.
Figure 5:
Bar charts show comparison proportion of patients classified with sarcopenia with varying age and race categories by standard method with sex-specific skeletal muscle index (SMI) threshold for calculating sarcopenia (35% of patients in total) versus skeletal muscle index z-score threshold of −0.40 corresponding to 35% of population across age, race, and sex (dotted line).
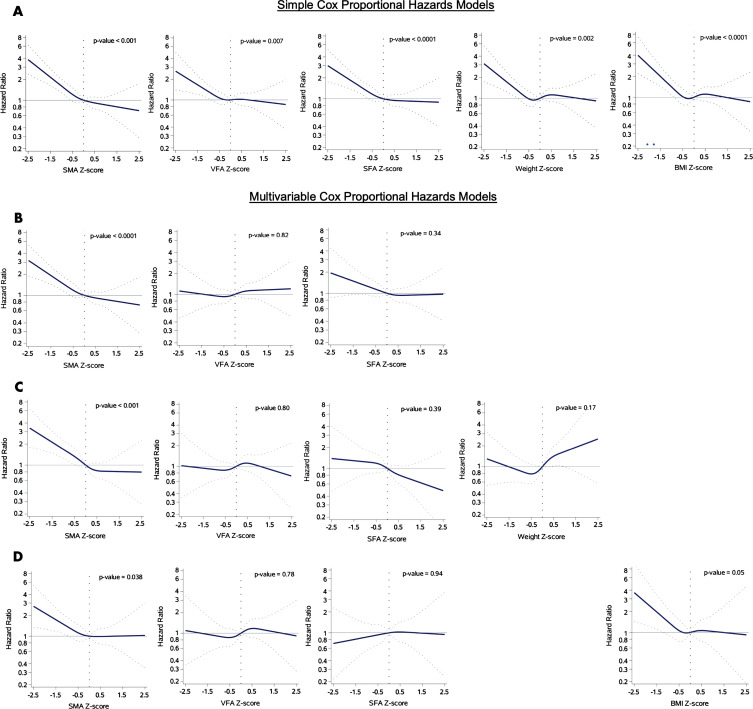
In Cox proportional hazards models that included quartiles of BC z scores derived from the previously defined reference curves in Figure 1, SM area was found to be consistently and significantly associated with risk of subsequent death within 2 years across simple and multivariable models (Figs 6, E4 [online]). In the combined model that included the BC areas adjusted for weight, SM area was predictive of death (P < .001), whereas weight was not (P = .17). In the combined model that included the BC areas adjusted for BMI, SM area was predictive of death (P = .04) with a greater statistically significant difference than BMI (P = .05) (Fig 6).
Figure 6:
Graphs show hazard ratios (solid lines) with 95% CIs (dotted lines) for risk of death (n = 9752 with 201 death events). A, Simple Cox proportional hazards models. B–D, Multivariable Cox proportional hazards models for, B, all areas (n = 12 128), C, all areas and weight (n = 7651), and, D, all areas and body mass index (BMI) (n = 7210). SFA = subcutaneous fat area, SMA = skeletal muscle area, VFA = visceral fat area.
Discussion
Although there is widespread interest in CT-based body composition (BC) analysis, manual segmentation of BC areas requires substantial time and expertise, which limits applications to well-funded research (8,15,18,20). With the ability to process complete abdominal CT examinations, excellent performance during external validation, equivalency to manual segmentation, and a low failure rate, our fully automated BC pipeline can replace manual segmentation for determining BC areas and clinical implementation is feasible. Furthermore, this pipeline was used to confirm that BC areas vary widely by age, sex, and race and to generate demographic-specific reference curves.
This study demonstrated a means by which artificial intelligence could add value in clinical practice. By fully automating a task that both is mundane and requires expertise and time, we extracted predictive information from existing data. A consumer-level graphics processing unit would be sufficient to fully automate BC analysis with the speed and scale necessary for a large hospital, harnessing latent value from routine imaging.
Previously published BC deep learning models did not include series selection and/or were not trained on routine abdominal CT examinations. Although Weston et al (11) presented a model that could segment the entire abdomen, it is unclear how whole-abdomen analysis relates to well-established epidemiologic results based on analysis of a single CT slice at L3 (7,18). Furthermore, no prior investigators, to our knowledge, have related their model results to population reference curves in order to understand the specific risk of a particular demographic group (9–13,19).
The reference curves generated in our study allow the calculation of z scores that represent the deviation of a particular patient’s BC area relative to a reference population of the same race, sex, and age. These reference curves are analogous to those used in bone mineral densitometry, wherein z scores drive the definitions of osteopenia and osteoporosis as well as treatment decisions (37). We purposely chose outpatients without cardiovascular or cancer diagnoses in order for this reference cohort to be broadly representative of the general population, avoiding undue bias toward individuals with major illnesses with known or presumed alterations in BC. Interestingly, these reference curves highlight differences in BC across demographic groups—differences that are not reflected with traditional metrics such as weight or BMI.
Compared with z scores that capture the demographic distribution of BC, the standard method of determining sarcopenia with sex-specific thresholds for skeletal muscle index (7,38) is biased by age and race. However, there is limited understanding of how clinically significant sarcopenia varies by age and race and whether absolute or relative sarcopenia is more important in different clinical scenarios. Furthermore, although muscle attenuation has also been recognized as an important biomarker that is complementary to BC area metrics (18,39), it is dependent on the use of intravenous contrast material, which adds complexity to interpretation. Ultimately, additional work will be needed to understand how z scores relate to important clinical outcomes and to calibrate z-score thresholds for scenarios such as preoperative risk or cancer cachexia (7,22).
We have shown that BC z scores can be predictive of survival in an outpatient population, augmenting the value of routine abdominal CT examination and providing utility beyond weight and BMI. Other work in oncology used manual BC analysis to show that BC metrics could be predictive of survival across tumor types, suggesting that fully automated BC analysis could add value to the treatment of patients with cancer if integrated into clinical decision pathways (20–22,38,40). Furthermore, compelling research revealed that weight management and exercise can decrease risk and improve outcomes of breast cancer, results that likely involve alterations in BC (41). It would be interesting to correlate our fully automated BC analysis to the marker of lean body mass and body surface area frequently used in the exercise physiology and pharmacology literature.
Our study had several limitations. Given the racial breakdown of outpatients at our large hospital system, we could derive reference curves only for White non-Hispanic patients and Black patients. Future plans include recruiting additional sites to improve the reference curves for Black patients, who were still less represented than White non-Hispanic patients; to derive reference curves for other racial groups; and to validate our reference curves in other geographic regions. Although our aim was to focus on patients without a major cardiovascular or oncologic diagnosis at the time of imaging, the included patients underwent imaging for a reason and may have been less healthy than the average American adult. Last, although prior research has shown that BC areas calculated from a single CT slice at L3 estimates whole-body composition well, we plan to investigate volumetric BC segmentation, which would necessitate large-scale collection of many manually segmented CT slices per patient examination for model training and validation.
In conclusion, we observed that body composition (BC) metrics, obtained by means of our fully automated analysis pipeline, varied significantly by age, race, and sex in a large outpatient, cross-sectional cohort that was used to generate population reference curves. Demographically adjusted BC z scores generated by using these reference curves will be useful for future research and clinical applications.
APPENDIX
SUPPLEMENTAL FIGURES
Acknowledgments
Acknowledgments
The authors thank Stacy Duey, BS, Shawn Murphy, MD, PhD, Henry Chueh, MD, and the Partners HealthCare Research Patient Data Registry group for facilitating use of their database. The authors also thank Mark Walters, Lina Chen, PhD, Adam McCarthy, MSc, Neil A. Tenenholtz, PhD, Brad Wright, MS, and Sean Doyle, MS, for their assistance in automated BC analysis at the MGH & BWH Center for Clinical Data Science.
Disclosures of Conflicts of Interest: K.M. Activities related to the present article: disclosed no relevant relationships. Activities not related to the present article: received salary support from NIH (NIBIB T32EB001631) as well as research funding from the Radiological Society of North America R&E Foundation and Society of Abdominal Radiology during the study period for unrelated work. Other relationships: disclosed no relevant relationships. C.P. Bridge Activities related to the present article: disclosed no relevant relationships. Activities not related to the present article: receives a salary from the Center for Clinical Data Science, part of Massachusetts General Brigham (formerly Partners Healthcare); MGH and BWH Center for Clinical Data Science receives funding from GE Healthcare, Nuance Communications, Nvidia, and Fujifilm Sonosite for unrelated work. Other relationships: disclosed no relevant relationships. C.P. Bay Activities related to the present article: disclosed no relevant relationships. Activities not related to the present article: received salary support from the National Institutes of Health (GM095467 and EY022445-04) during the study period for unrelated work. Other relationships: disclosed no relevant relationships. A.B. Activities related to the present article: disclosed no relevant relationships. Activities not related to the present article: received salary support from NIH (K07 CA222159) during the study period for unrelated work. Other relationships: disclosed no relevant relationships.disclosed no relevant relationships. F.J.F. Activities related to the present article: disclosed no relevant relationships. Activities not related to the present article: institution has grants/grants pending from the American Roentgen Ray Society; has a patent pending; institution received grants from the Society of Interventional Oncology and the William M. Wood Foundation for unrelated work; institution received a grant from the Society of Thoracic Radiology for related work; received salary support from William M. Wood Foundation and the Society of Interventional Oncology during the study period for unrelated work. Other relationships: received a one-time payment from Nulogix Health as part of a licensing deal for patent. F.M.T. disclosed no relevant relationships. N.M. disclosed no relevant relationships. W.C.W. disclosed no relevant relationships. L.K.B. disclosed no relevant relationships. K.P.A. Activities related to the present article: disclosed no relevant relationships. Activities not related to the present article: receives a salary from the Center for Clinical Data Science, part of Massachusetts General Brigham (formerly Partners Healthcare); MGH and BWH Center for Clinical Data Science receives funding from GE Healthcare, Nuance Communications, Nvidia, and Fujifilm Sonosite for unrelated work. Other relationships: disclosed no relevant relationships. B.M.W. Activities related to the present article: disclosed no relevant relationships. Activities not related to the present article: is a paid consultant for G1 Therapeutics, BioLineRx, Celgen, and GRAIL; institution has grants/grants pending at Celgene and Eli Lilly; received salary support from the NIH (NIH/NCI U01 CA210171), Lustgarten Foundation, and Stand Up to Cancer for related work; received salary support from Dana-Farber Cancer Institute Hale Family Center for Pancreatic Cancer Research, Lustgarten Foundation, NIH/NCI, and Stand Up to Cancer during the study period for unrelated work. Other relationships: disclosed no relevant relationships. M.H.R. Activities related to the present article: disclosed no relevant relationships. Activities not related to the present article: received salary support from the NIH (NIH/NCI U01 CA210171), Lustgarten Foundation, the Dana-Farber Cancer Institute Hale Family Center for Pancreatic Cancer, and Stand Up to Cancer for related work. Other relationships: disclosed no relevant relationships.
Abbreviations:
- BC
- body composition
- BMI
- body mass index
- SF
- subcutaneous fat
- SM
- skeletal muscle
- VF
- visceral fat
References
- 1.Berrington de Gonzalez A, Hartge P, Cerhan JR, et al. Body-mass index and mortality among 1.46 million white adults. N Engl J Med 2010;363(23):2211–2219. [DOI] [PMC free article] [PubMed] [Google Scholar]
- 2.Heymsfield SB, Peterson CM, Thomas DM, Heo M, Schuna JM Jr. Why are there race/ethnic differences in adult body mass index-adiposity relationships? A quantitative critical review. Obes Rev 2016;17(3):262–275. [DOI] [PMC free article] [PubMed] [Google Scholar]
- 3.Prentice AM, Jebb SA. Beyond body mass index. Obes Rev 2001;2(3):141–147. [DOI] [PubMed] [Google Scholar]
- 4.Mourtzakis M, Prado CMM, Lieffers JR, Reiman T, McCargar LJ, Baracos VE. A practical and precise approach to quantification of body composition in cancer patients using computed tomography images acquired during routine care. Appl Physiol Nutr Metab 2008;33(5):997–1006. [DOI] [PubMed] [Google Scholar]
- 5.Shen W, Punyanitya M, Wang Z, et al. Total body skeletal muscle and adipose tissue volumes: estimation from a single abdominal cross-sectional image. J Appl Physiol 2004;97(6):2333–2338. [DOI] [PubMed] [Google Scholar]
- 6.Shen W, Punyanitya M, Wang Z, et al. Visceral adipose tissue: relations between single-slice areas and total volume. Am J Clin Nutr 2004;80(2):271–278. [DOI] [PMC free article] [PubMed] [Google Scholar]
- 7.Prado CM, Lieffers JR, McCargar LJ, et al. Prevalence and clinical implications of sarcopenic obesity in patients with solid tumours of the respiratory and gastrointestinal tracts: a population-based study. Lancet Oncol 2008;9(7):629–635. [DOI] [PubMed] [Google Scholar]
- 8.MacDonald AJ, Greig CA, Baracos V. The advantages and limitations of cross-sectional body composition analysis. Curr Opin Support Palliat Care 2011;5(4):342–349. [DOI] [PubMed] [Google Scholar]
- 9.Graffy PM, Liu J, Pickhardt PJ, Burns JE, Yao J, Summers RM. Deep learning-based muscle segmentation and quantification at abdominal CT: application to a longitudinal adult screening cohort for sarcopenia assessment. Br J Radiol 2019;92(1100):20190327. [DOI] [PMC free article] [PubMed] [Google Scholar]
- 10.Chung H, Cobzas D, Birdsell L, Lieffers J, Baracos V. Automated segmentation of muscle and adipose tissue on CT images for human body composition analysis. In: Miga MI, Wong KH, eds. Proceedings of SPIE: medical imaging 2009—visualization, image-guided procedures, and modeling. Vol 7261. Bellingham, Wash: International Society for Optics and Photonics, 2009; 72610K. [Google Scholar]
- 11.Weston AD, Korfiatis P, Kline TL, et al. Automated Abdominal Segmentation of CT Scans for Body Composition Analysis Using Deep Learning. Radiology 2019;290(3):669–679. [DOI] [PubMed] [Google Scholar]
- 12.Hemke R, Buckless CG, Tsao A, Wang B, Torriani M. Deep learning for automated segmentation of pelvic muscles, fat, and bone from CT studies for body composition assessment. Skeletal Radiol 2020;49(3):387–395. [DOI] [PMC free article] [PubMed] [Google Scholar]
- 13.Lee H, Troschel FM, Tajmir S, et al. Pixel-Level Deep Segmentation: Artificial Intelligence Quantifies Muscle on Computed Tomography for Body Morphometric Analysis. J Digit Imaging 2017;30(4):487–498. [DOI] [PMC free article] [PubMed] [Google Scholar]
- 14.Goodpaster BH, Thaete FL, Simoneau JA, Kelley DE. Subcutaneous abdominal fat and thigh muscle composition predict insulin sensitivity independently of visceral fat. Diabetes 1997;46(10):1579–1585. [DOI] [PubMed] [Google Scholar]
- 15.Neeland IJ, Gupta S, Ayers CR, et al. Relation of regional fat distribution to left ventricular structure and function. Circ Cardiovasc Imaging 2013;6(5):800–807. [DOI] [PMC free article] [PubMed] [Google Scholar]
- 16.Abbasi SA, Hundley WG, Bluemke DA, et al. Visceral adiposity and left ventricular remodeling: the Multi-Ethnic Study of Atherosclerosis. Nutr Metab Cardiovasc Dis 2015;25(7):667–676. [DOI] [PMC free article] [PubMed] [Google Scholar]
- 17.Matsushita Y, Nakagawa T, Yamamoto S, et al. Adiponectin and visceral fat associate with cardiovascular risk factors. Obesity (Silver Spring) 2014;22(1):287–291. [DOI] [PubMed] [Google Scholar]
- 18.Brown JC, Caan BJ, Prado CM, et al. Body Composition and Cardiovascular Events in Patients With Colorectal Cancer: A Population-Based Retrospective Cohort Study. JAMA Oncol 2019;5(7):967–972. [DOI] [PMC free article] [PubMed] [Google Scholar]
- 19.Pickhardt PJ, Graffy PM, Zea R, et al. Automated CT biomarkers for opportunistic prediction of future cardiovascular events and mortality in an asymptomatic screening population: a retrospective cohort study. Lancet Digit Health 2020;2(4):e192–e200. [DOI] [PMC free article] [PubMed] [Google Scholar]
- 20.Martin L, Birdsell L, Macdonald N, et al. Cancer cachexia in the age of obesity: skeletal muscle depletion is a powerful prognostic factor, independent of body mass index. J Clin Oncol 2013;31(12):1539–1547. [DOI] [PubMed] [Google Scholar]
- 21.Antoun S, Lanoy E, Iacovelli R, et al. Skeletal muscle density predicts prognosis in patients with metastatic renal cell carcinoma treated with targeted therapies. Cancer 2013;119(18):3377–3384. [DOI] [PubMed] [Google Scholar]
- 22.Prado CMM, Baracos VE, McCargar LJ, et al. Sarcopenia as a determinant of chemotherapy toxicity and time to tumor progression in metastatic breast cancer patients receiving capecitabine treatment. Clin Cancer Res 2009;15(8):2920–2926. [DOI] [PubMed] [Google Scholar]
- 23.Prado CMM, Baracos VE, McCargar LJ, et al. Body composition as an independent determinant of 5-fluorouracil-based chemotherapy toxicity. Clin Cancer Res 2007;13(11):3264–3268. [DOI] [PubMed] [Google Scholar]
- 24.Kyrgiou M, Kalliala I, Markozannes G, et al. Adiposity and cancer at major anatomical sites: umbrella review of the literature. BMJ 2017;356:j477. [DOI] [PMC free article] [PubMed] [Google Scholar]
- 25.Bridge CP, Rosenthal M, Wright B, et al. Fully-Automated Analysis of Body Composition from CT in Cancer Patients Using Convolutional Neural Networks. In: Stoyanov D, Taylor Z, Sarikaya D, et al., eds. OR 2.0 Context-Aware Operating Theaters, Computer Assisted Robotic Endoscopy, Clinical Image-Based Procedures, and Skin Image Analysis. CARE 2018, CLIP 2018, OR 2.0 2018, ISIC 2018. Lecture Notes in Computer Science, vol 11041. Cham, Switzerland: Springer, 2018; 204–213. [Google Scholar]
- 26.Danai LV, Babic A, Rosenthal MH, et al. Altered exocrine function can drive adipose wasting in early pancreatic cancer. Nature 2018;558(7711):600–604. [DOI] [PMC free article] [PubMed] [Google Scholar]
- 27.DeFilipp Z, Troschel FM, Qualls DA, et al. Evolution of Body Composition Following Autologous and Allogeneic Hematopoietic Cell Transplantation: Incidence of Sarcopenia and Association with Clinical Outcomes. Biol Blood Marrow Transplant 2018;24(8):1741–1747. [DOI] [PubMed] [Google Scholar]
- 28.Huang G, Liu Z, Van Der Maaten L, Weinberger KQ. Densely Connected Convolutional Networks. In: 2017 IEEE Conference on Computer Vision and Pattern Recognition (CVPR), Honolulu, HI, July 21–26, 2017. Piscataway, NJ: IEEE, 2017. [Google Scholar]
- 29.Ronneberger O, Fischer P, Brox T. U-Net: Convolutional Networks for Biomedical Image Segmentation. In: Navab N, Hornegger J, Wells W, Frangi A, eds. Medical Image Computing and Computer-Assisted Intervention – MICCAI 2015. MICCAI 2015. Lecture Notes in Computer Science, vol 9351. Cham, Switzerland: Springer, 2015; 234–241. [Google Scholar]
- 30.Dice LR. Measures of the Amount of Ecologic Association Between Species. Ecology 1945;26(3):297–302. [Google Scholar]
- 31.Dixon PM, Saint-Maurice PF, Kim Y, Hibbing P, Bai Y, Welk GJ. A Primer on the Use of Equivalence Testing for Evaluating Measurement Agreement. Med Sci Sports Exerc 2018;50(4):837–845. [DOI] [PMC free article] [PubMed] [Google Scholar]
- 32.Iachine I, Petersen HC, Kyvik KO. Robust tests for the equality of variances for clustered data. J Stat Comput Simul 2010;80(4):365–377. [Google Scholar]
- 33.Stasinopoulos MD, Rigby RA, Heller GZ, Voudouris V, De Bastiani F. Flexible regression and smoothing: using GAMLSS in R. Boca Raton, Fla: CRC, 2017; 449–487. [Google Scholar]
- 34.Stasinopoulos DM, Rigby RA. Generalized Additive Models for Location Scale and Shape (GAMLSS) in R. J Stat Softw 2007;23(7):1–46. [Google Scholar]
- 35.Cole TJ, Green PJ. Smoothing reference centile curves: the LMS method and penalized likelihood. Stat Med 1992;11(10):1305–1319. [DOI] [PubMed] [Google Scholar]
- 36.Zhou SH, McCarthy ID, McGregor AH, Coombs RR, Hughes SP. Geometrical dimensions of the lower lumbar vertebrae Z: analysis of data from digitised CT images. Eur Spine J 2000;9(3):242–248. [DOI] [PMC free article] [PubMed] [Google Scholar]
- 37.Lorente-Ramos R, Azpeitia-Armán J, Muñoz-Hernández A, García-Gómez JM, Díez-Martínez P, Grande-Bárez M. Dual-energy x-ray absorptiometry in the diagnosis of osteoporosis: a practical guide. AJR Am J Roentgenol 2011;196(4):897–904. [DOI] [PubMed] [Google Scholar]
- 38.Caan BJ, Cespedes Feliciano EM, Prado CM, et al. Association of muscle and adiposity measured by computed tomography with survival in patients with nonmetastatic breast cancer. JAMA Oncol 2018;4(6):798–804. [DOI] [PMC free article] [PubMed] [Google Scholar]
- 39.Dijksterhuis WPM, Pruijt MJ, van der Woude SO, et al. Association between body composition, survival, and toxicity in advanced esophagogastric cancer patients receiving palliative chemotherapy. J Cachexia Sarcopenia Muscle 2019;10(1):199–206. [DOI] [PMC free article] [PubMed] [Google Scholar]
- 40.Black D, Mackay C, Ramsay G, et al. Prognostic Value of Computed Tomography: Measured Parameters of Body Composition in Primary Operable Gastrointestinal Cancers. Ann Surg Oncol 2017;24(8):2241–2251. [DOI] [PMC free article] [PubMed] [Google Scholar]
- 41.Ligibel JA, Basen-Engquist K, Bea JW. Weight Management and Physical Activity for Breast Cancer Prevention and Control. Am Soc Clin Oncol Educ Book 2019;39(39):e22–e33. [DOI] [PubMed] [Google Scholar]
Associated Data
This section collects any data citations, data availability statements, or supplementary materials included in this article.


