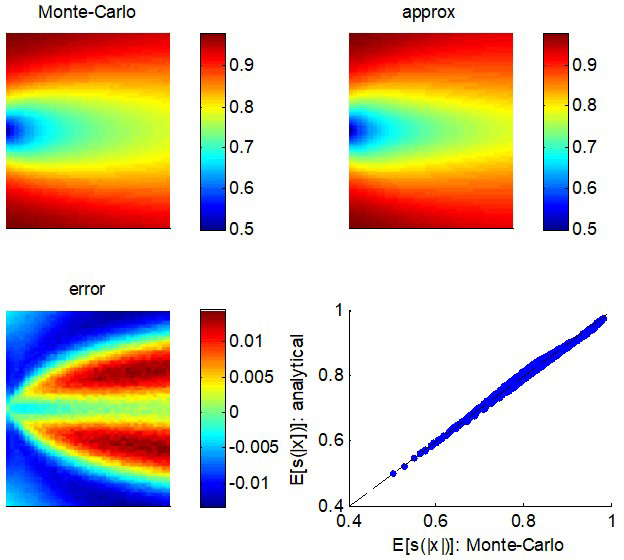
Appendix 1—figure 1. Quality of the analytical approximation to .

Upper left panel: the Monte-Carlo estimate of (color-coded) is shown as a function of both the mean (y-axis) and the variance (x-axis) of the parent process . Upper right panel: analytic approximation to as given by Equation A3 (same format). Lower left panel: the error, that is, the difference between the Monte-Carlo and the analytic approximation (same format). Lower right panel: the analytic approximation (y-axis) is plotted as a function of the Monte-Carlo estimate (x-axis) for each pair of moments of the parent distribution.
