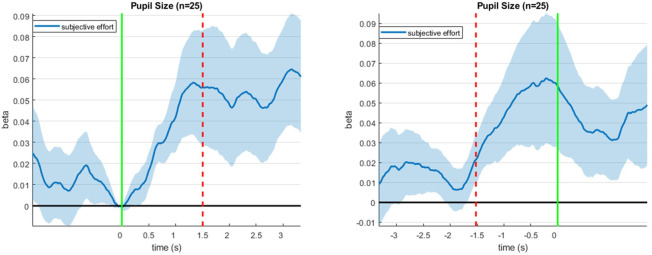
Appendix 1—figure 8. Correlation between pupil size and subjective effort ratings during decision time.
Left panel: Mean (± s.e.m.) correlation between pupil size and subjective effort (y-axis) is plotted as a function of peristimulus time (x-axis). Here, epochs are co-registered w.r.t. stimulus onset (the green line indicates stimulus onset and the red dotted line indicates the average choice response). Right panel: Same, but for epochs co-registered w.r.t. choice response (the green line indicates choice response and the red dotted line indicates the average stimulus onset).

