

Why was the cohort set up?
The NorwegianOffshore Petroleum Workers (NOPW) cohort is a cohort that recruited nearly 28 000 offshore workers in 1998 for prospective follow-up of cancer and cause-specific mortality. The cohort was based on a list of possible former or current offshore workers who were invited to fill in and return a comprehensive questionnaire on work history, diet, alcohol, tobacco, education and other factors possibly related to cancer risk (Supplemental material, available as Supplementary data at IJE online).
In 1963, Norway proclaimed sovereignty of the continental shelf along the Norwegian coastline and its natural resources.1 From 1966, exploration and drilling for oil and gas in the North Sea eventually resulted in a large number of wells that were operated from movable and stationary installations, with production starting in 1971. In this pioneer time of the industry, there were few automated processes and the work was highly manual, physically demanding and dirty, with relatively high injury and death rates from accidents.2,3 Health and safety regulations were scarce and the use of personal protective equipment limited.1,4 The weather conditions offshore are harsh, and the workers are subject to a wide range of exposures: chemical, physical, ergonomic and psychosocial.5 Some of the chemical exposures are known or suspected to be carcinogenic, and exposure to natural gas and chemicals from water injection, oil/solvent vapour, exhaust fumes and skin contact with oil and diesel have been frequently reported by the workers.5
The first questions about cancer risk related to drilling and production of oil and gas on the Norwegian continental shelf were raised in the early 1980s. It was pointed out that the possible carcinogenic effects from long-term low-level hydrocarbon exposure and other chemical agents required continuous monitoring due to long latency time.6,7 In 1990, a review of health effects from exposure to oil-based drilling fluids concluded that there is insufficient information of such exposure, especially regarding carcinogenicity and pathological changes in the lungs.8 The living conditions and working environment offshore led the oil and gas employers’ association, labour unions and the Cancer Registry of Norway (CRN) to plan a follow-upstudy of cancer incidence and cause-specific mortality among Norwegian offshore workers. In 1992 the CRN issued a research protocol,9 but it proved impossible to establish a uniform and complete historical cohort of offshore petroleum workers—neither by means of data from employers nor from census and registry data. Because of this situation, the CRN planned and conducted the above-mentioned recruitment of participants for the prospective cohort study by compiling lists of possible offshore workers from oil companies, educational institutions, unions and other relevant sources.10
Who is in the cohort?
Among 57 329 workers with possible employment in the offshore petroleum industry, 35 458 (62%) returned the questionnaire (Supplementary Table S1, available as Supplementary data at IJE online). After excluding those who reported no offshore work (n = 7249), had missing address (n = 222), worked on ships with no drilling or production activity (n = 68) or had missing personal identification number (PIN: n = 2), the NOPW cohort consisted of 27 917 workers (79% of all responders). Since the true number of all offshore workers is unknown for the period 1965–98, we merged the NOPW cohort with the Norwegian State Register of Employers and Employees (NREE) based on first entry in offshore work after 1980 (although limited to data on type of work and duration) according to a protocol for another registry-based cohort study of Norwegian offshore petroleum workers.11 From these two independent sources, we estimated the participation rate in the NOPW cohort for the period 1981–98 to be 69%.12
Table 1 shows age, sex and county of residence for the NOPW cohort members and the non-responders at the time of recruitment in 1998. Age was similar in cohort members and non-responders (43.1 vs 42.8 years, respectively). Male workers constituted a slightly larger proportion among the cohort members (90.8%) than among the non-responders (88.6%). Differences in county of residence were small; 23.1% of the cohort members vs 19.7% of the non-responders resided in Hordaland, and correspondingly 31.4% vs 36.3% in Rogaland, which constituted the two most relavent counties.
Table 1.
Age, sex and county of residence for participants in the Norwegian Offshore Petroleum Workers (NOPW) cohort and non-responders at baseline in 1998
| NOPW cohort (n = 27 917) a | Non-responders (n = 21 871) a | |
|---|---|---|
| Age in 1998 (years), mean (SD) | 42.6 (9.8) | 42.8 (10.2) |
| Sex, n (%) | ||
| Males | 25 347 (90.8) | 19 381 (88.6) |
| Females | 2570 (9.2) | 2490 (11.4) |
| County in 1998, n (%) | ||
| Akershus | 710 (2.5) | 667 (3.0) |
| Aust-Agder | 1302 (4.7) | 1032 (4.7) |
| Buskerud | 500 (1.8) | 411 (1.9) |
| Finnmark | 70 (0.3) | 67 (0.3) |
| Hedmark | 152 (0.5) | 114 (0.5) |
| Hordaland | 6440 (23.1) | 4301 (19.7) |
| Møre og Romsdal | 1249 (4.5) | 802 (3.7) |
| Nord-Trøndelag | 500 (1.8) | 297 (1.4) |
| Nordland | 491 (1.8) | 316 (1.4) |
| Oppland | 154 (0.6) | 100 (0.5) |
| Oslo | 622 (2.2) | 793 (3.6) |
| Rogaland | 8769 (31.4) | 7945 (36.3) |
| Sogn og Fjordane | 700 (2.5) | 363 (1.7) |
| Sør-Trøndelag | 842 (3.0) | 620 (2.8) |
| Telemark | 1107 (4.0) | 715 (3.3) |
| Troms | 311 (1.1) | 224 (1.0) |
| Vest-Agder | 1837 (6.6) | 1415 (6.5) |
| Vestfold | 1552 (5.6) | 1240 (5.7) |
| Østfold | 606 (2.2) | 449 (2.1) |
SD, standard deviation.
Missing county on three NOPW cohort members (n = 27 914) and four non-responders (n = 21 867).
All counties of Norway are represented in the NOPW cohort, where workers residing in the northernmost and inland counties constituted the smallest fractions (Figure 1). The cumulative numbers of persons starting (dotted line) and stopping (solid line) offshore work over the time period 1965–98 are shown in Figure 2. A steep increase in the number starting offshore work was seen during the 1970s and 1980s.
Figure 1.
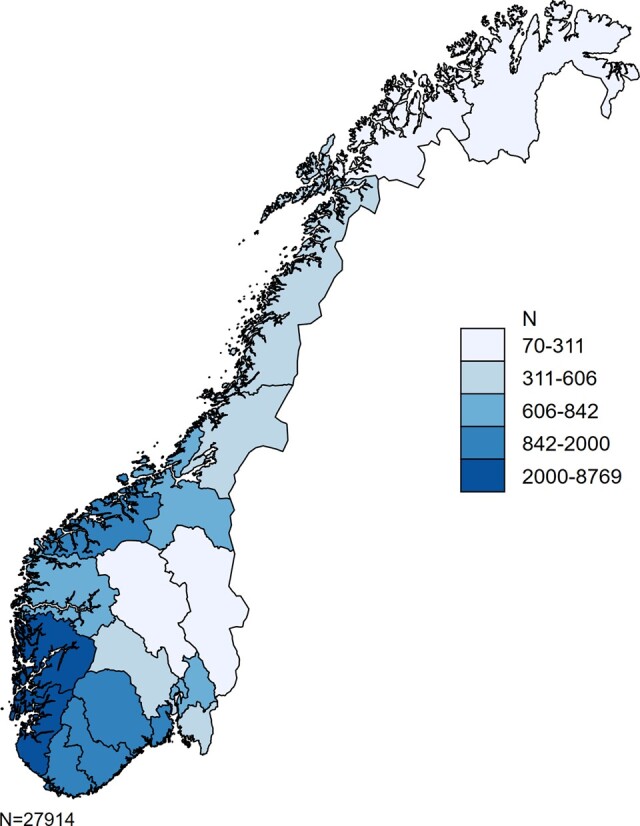
Map of Norway showing the county of residence for the members of Norwegian Offshore Petroleum Worker (NOPW) cohort at the baseline (1998), displayed as number of workers on a five-category colour scale (n = 27 914; missing county on three workers).
Figure 2.

Cumulative number of persons starting (dotted line) and stopping (solid line) offshore work in the NOPW cohort over the time period 1965–98.
Start of cancer follow-up was set to 1 July 1999 to allow for delayed questionnaires to be received before starting the follow-up time, and thereby ensuring a prospective follow-up through 31 December 2017. The linkage was conducted by use of the unique 11-digit PIN assigned to all Norwegians in 1964 for those alive in 1960 or born later. Reporting of incident cancers to the CRN has been compulsory in Norway since 1953, and data from a number of sources ensure a high degree of completeness and validity.13 A total of 3868 and 303 cases were identified among 25 347 male and 2570 female workers, respectively (Table 2). Among cancer sites possibly related to occupational exposure, we computed standardized incidence ratios (SIRs) with 95% confidence intervals (CIs) from gender-, age (5-year)- and time (1-year)-specific incidence rates for the Norwegian population (Table 2). We assumed a Poisson distribution of the observed cases. Analyses were performed using Stata 16.1 (StataCorp, TX, USA). A total of 568 prevalent cancer cases (i.e. occurring 1955–30 June 1999) were excluded.
Table 2.
Standardized incidence ratios (SIRs) with 95% confidence intervals (CIs), by sex, in the Norwegian Offshore Petroleum Workers (NOPW) cohort (n = 27 917), 1999–2017
| Cancer site | ICD-10 | Males (n = 25 347) |
Females (n = 2570) |
||||
|---|---|---|---|---|---|---|---|
| Obs. | Exp. | SIR (95% CI) | Obs. | Exp. | SIR (95% CI) | ||
| Oral cavity and pharynx | C01–C14 | 73 | 80.7 | 0.90 (0.71–1.14) | 2 | 3.0 | 0.67 (0.08–2.43) |
| Oesophagus | C15 | 41 | 43.2 | 0.95 (0.68–1.29) | 2 | 0.9 | 2.26 (0.27–8.16) |
| Adenocarcinoma | C15 | 27 | 24.2 | 1.12 (0.74–1.63) | 1 | 0.3 | 3.45 (0.09–19) |
| Squamous cell carcinoma | C15 | 12 | 13.7 | 0.87 (0.45–1.53) | 1 | 0.5 | 2.12 (0.05–12) |
| Colorectal | C18–C21 | 431 | 446.0 | 0.97 (0.88–1.06) | 33 | 28.0 | 1.18 (0.81–1.66) |
| Larynx | C32 | 24 | 26.8 | 0.89 (0.57–1.33) | 1 | 0.4 | 2.56 (0.06–14) |
| Lung | C34 | 386 | 356.6 | 1.08 (0.98–1.20) | 23 | 21.1 | 1.09 (0.69–1.64) |
| Small-cell lung cancer | C34 | 53 | 54.8 | 0.97 (0.72–1.26) | 5 | 3.9 | 1.29 (0.42–3.01) |
| Non-small-cell lung cancer | C34 | 333 | 301.8 | 1.10 (0.99–1.23) | 18 | 17.2 | 1.05 (0.62–1.66) |
| Pleura | C38.4 | 32 | 13.5 | 2.38 (1.63–3.36) | 0 | 0.1 | — |
| Cutaneous melanoma | C43 | 214 | 219.4 | 0.98 (0.85–1.12) | 32 | 19.8 | 1.62 (1.11–2.29) |
| Cutaneous squamous cell carcinoma | C44 | 133 | 119.3 | 1.12 (0.93–1.32) | 10 | 6.1 | 1.65 (0.79–3.04) |
| Breast | C50 | 12 | 5.5 | 2.18 (1.13–3.81) | 99 | 86.3 | 1.15 (0.93–1.40) |
| Prostate | C61 | 1277 | 1060.1 | 1.20 (1.14–1.27) | — | ||
| Kidney | C64 | 136 | 130.4 | 1.04 (0.87–1.23) | 4 | 4.4 | 0.91 (0.25–2.33) |
| Bladder | C66–C68 | 213 | 214.2 | 0.99 (0.87–1.14) | 6 | 5.1 | 1.18 (0.43–2.58) |
| Lymphohaematopoietic | C81-C96, D45-D47 | 292 | 312.3 | 0.93 (0.83–1.05) | 16 | 17.4 | 0.92 (0.52–1.49) |
| Hodgkin lymphoma | C81 | 12 | 15.5 | 0.77 (0.40–1.35) | 0 | 0.9 | — |
| Non-Hodgkin lymphoma (NHL) | C82–C91 | 206 | 225.1 | 0.91 (0.79–1.05) | 11 | 11.9 | 0.92 (0.46–1.65) |
| Follicular lymphoma | C82 | 29 | 28.1 | 1.03 (0.69–1.48) | 2 | 2.2 | 0.93 (0.11–3.35) |
| Mantle cell lymphoma | C83.1 | 13 | 8.9 | 1.46 (0.78–2.50) | 0 | 0.2 | — |
| Diffuse large B cell lymphoma | C83.3 | 45 | 36.2 | 1.24 (0.91–1.66) | 2 | 1.8 | 1.10 (0.13–3.96) |
| Multiple myeloma | C90 | 48 | 47.8 | 1.00 (0.74–1.33) | 1 | 2.5 | 0.40 (0.01–2.24) |
| Acute lymphoid leukaemia | C91.0 | 5 | 2.5 | 1.97 (0.64–4.61) | 0 | 0.2 | — |
| Chronic/small lymphoid leukaemia | C91.1 | 35 | 39.0 | 0.90 (0.63–1.25) | 2 | 1.6 | 1.24 (0.15–4.48) |
| Acute myeloid leukaemia | C92.0 | 25 | 20.9 | 1.20 (0.77–1.77) | 5 | 1.3 | 3.76 (1.22–8.78) |
| Chronic myeloid leukaemia | C92.1 | 8 | 6.0 | 1.33 (0.57–2.61) | 0 | 0.4 | — |
| Myelodysplastic syndrome | D46 | 17 | 18.8 | 0.90 (0.53–1.45) | 0 | 0.8 | — |
| All sites | C00-C96, D45-D47 | 3868 | 3602.0 | 1.07 (1.04–1.11) | 303 | 268.3 | 1.13 (1.01–1.26) |
ICD, International Classification Of Diseases; Obs., observed; Exp., expected.
Figure 3 shows age distribution by sex among all cohort members at baseline (upper panel) and among the incident cancer cases at diagnosis (lower panel). The largest 5-year age group at baseline was 40–44 among males and 35–39 among females. Most male cancer cases occurred after age 59, whereas for females age groups were more evenly distributed, primarily because most breast cancer cases were diagnosed before age 54.
Figure 3.

Age distribution by sex among cohort members at baseline in 1998 (upper panel) and among cancer cases at diagnosis 1999–2017 (lower panel).
How often have they been followed up?
The cohort has been linked to the CRN five times thus far. The first linkage was conducted with follow-up through 2005 and yielded 773 incident cases.2,14 The second follow-up was through 2009 and yielded 1585 incident cases.12 The third and fourth follow-ups were conducted through 201115 and 2012,16,17 respectively. The fifth and current follow-up runs through 2017 and has yielded 4171 incident cases.
Necessary legal and ethical approvals were obtained from the Norwegian Data Inspectorate, the Regional Committee for Medical Research Ethics and the Norwegian Directorate of Health.
What has been measured?
The questionnaire at baseline was comprehensive, covering sociodemographic factors, work history before, after and in-between offshore work periods, and lifestyle factors.
Table 3 shows cohort characteristics relevant for cancer risk. More than 70% of the workers were born after 1950. Males were slightly older than females at recruitment (mean ages 42.9 and 39.1 years, respectively). A larger proportion of males (79%) had a partner than females (66%), but a lower proportion of males (18%) were childless than females (31%). Females with children were aged on average 25 years at first childbirth. Vocational training was the most frequent educational category among males (41%) and upper secondary education among females (33%). Among males, 55% were overweight or obese (body mass index ≥25 kg/m2), as were 25% of the females. The average number of offshore jobs was around two among males and 1.5 among females, and corresponding means of total offshore employment duration were 11 and 7 years, respectively. Maintenance activities constituted the largest work category among males (50%), whereas most females were engaged in catering, office and administrative work (68%); 41% of the males and 35% of the females reported shift work in their last position. Nearly 70% of the workers were either former or current smokers, with an average smoking history of 11.4 pack-years. Alcohol and red meat intake was divided into quartiles, and quartile 4 corresponded to ≥4.1 alcohol units/week (males 23%, females 8%) and red meat ≥25.1 times/week (males 24%, females11%). Physical activity with an intensity at the aerobic threshold (sweaty and short of breath) for ≥20 min was performed 1–2 times/week by 26% of the males and 30% of the females. During a year, 63% reported one sunburn and 2–3 weeks of sunbathing; 7% of the males and 16% of the females reported using a solarium 1–2 times a month, and 26% of the males and half the females reported using sunscreen almost always.
Table 3.
Baseline characteristics of the participants in the Norwegian Offshore Petroleum Workers (NOPW) cohort
| Variables | Males (n = 25 347) | Females (n = 2570) | Total (n = 27 917) |
|---|---|---|---|
| Socio-demographic | |||
| 5-year birth cohorts, n (%) | |||
| 1918–29 | 190 (<1) | 7 (<1) | 197 (<1) |
| 1930–34 | 461 (2) | 22 (1) | 483 (2) |
| 1935–39 | 1017 (4) | 50 (2) | 1067 (4) |
| 1940–44 | 2173 (9) | 134 (5) | 2307 (8) |
| 1945–49 | 3355 (13) | 222(9) | 3577 (13) |
| 1950–54 | 4204 (17) | 300 (12) | 4504 (16) |
| 1955–59 | 4931 (19) | 441 (17) | 5372 (19) |
| 1960–64 | 4361 (17) | 594 (23) | 4955 (18) |
| 1965–69 | 3309 (13) | 534 (21) | 3843 (14) |
| 1970–74 | 1211 (5) | 243 (9) | 1454 (5) |
| 1975–79 | 135 (<1) | 23 (<1) | 158 (<1) |
| Age in 1998 (years), mean (range)a | 42.9 (19–80) | 39.1 (19–75) | 42.6 (19–80) |
| Marital status, n (%) | |||
| Single | 2870 (11) | 509 (20) | 3379 (12) |
| Cohabitant/married | 19 964 (79) | 1683 (66) | 21 647 (78) |
| Separated/divorced | 2010 (8) | 320 (12) | 2330 (8) |
| Widow/widower | 182 (1) | 26 (1) | 208 (1) |
| Missing | 321 (1) | 32 (1) | 353 (1) |
| Number of children, n (%) | |||
| 0 | 4527 (18) | 803 (31) | 5330 (19) |
| 1 | 3898 (15) | 564 (22) | 4462 (16) |
| 2 | 8897 (35) | 745 (29) | 9642 (35)) |
| 3 | 5868 (23) | 348 (14) | 6216 (22) |
| ≥4 | 1968 (8) | 88 (3) | 2056 (7) |
| Missing | 189 (1) | 22 (1) | 211 (1) |
| Age at first child, mean (range)a | 26.6 (16–75) | 25.3 (16–42) | 26.5 (16–75) |
| Educational level, n (%) | |||
| Compulsory | 3010 (12) | 382 (15) | 3392 (12) |
| Vocational training | 10 412 (41) | 562 (22) | 10 974 (39) |
| Upper secondary | 6003 (24) | 853 (33) | 6856 (25) |
| University/college | 5736 (22) | 745 (29) | 6481 (23) |
| Missing | 186 (1) | 28 (1) | 214 (1) |
| Anthropometric | |||
| Height (cm), mean (range)a | 180 (125–205) | 167 (149–188) | 179 (125–205) |
| Weight (kg), mean (range)a | 83 (40–204) | 66 (40–170) | 82 (40–204) |
| BMI (kg/m2), n (%) | |||
| 12–18.4 | 49 (<1) | 68 (3) | 117 (<1) |
| 18.5–24.9 | 11 072 (44) | 1797 (70) | 12 869 (46) |
| 25.0–29.9 | 11 931 (47) | 524 (20) | 12 455 (45) |
| ≥30.0 | 1947 (8) | 136 (5) | 2083 (7) |
| Missing | 348 (1) | 45 (2) | 393 (1) |
| Work history | |||
| No. of offshore jobs, mean (range)a | 2.19 (1–8) | 1.53 (1–8) | 2.13 (1–8) |
| Employment duration (years), mean (range)a | 11.0 (<1–40) | 7.28 (<1–39.5) | 10.6 (<1–40) |
| Main activity last position, n (%) | |||
| Production | 1812 (7) | 151 (6) | 1963 (7) |
| Drilling | 3634 (14) | 146 (6) | 3780 (14) |
| Maintenance | 12 657 (50) | 273 (10) | 12 930 (46) |
| Catering/office/administration | 2955 (12) | 1731 (68) | 4686 (17) |
| Miscellaneous | 4036 (16) | 232 (9) | 4268 (15) |
| Missing | 253 (1) | 37 (1) | 290 (1) |
| Work schedule latest position, n (%) | |||
| Daytime | 12 698 (50) | 1459 (57) | 14 157 (51) |
| Night-time | 1001 (4) | 70 (3) | 1071 (4) |
| Shift work | 10 398 (41) | 902 (35) | 11 300 (40) |
| Missing | 1250 (5) | 139 (5) | 1389 (5) |
| Lifestyle | |||
| Smoking status, n (%) | |||
| Never | 7290 (29) | 768 (30) | 8058 (29) |
| Former | 7527 (30) | 607 (24) | 8134 (29) |
| Current | 9888 (39) | 1133 (44) | 11 021 (39) |
| Missing | 642 (2) | 62 (2) | 704 (3) |
| Pack years, mean (range)a | 11.6 (0–96.5) | 9.3 (0–63.8) | 11.4 (0–96.5) |
| Alcohol intake, n (%)b | |||
| Never/rarely | 1264 (5) | 285 (11) | 1549 (6) |
| Q1: 0.5–1.0 units/week | 5481 (22) | 1034 (40) | 6515 (23) |
| Q2: 1.1–2.5 units/week | 7230 (28) | 636 (25) | 7866 (28) |
| Q3: 2.6–4.0 units/week | 4402 (17) | 278 (11) | 4680 (17) |
| Q4: 4.1–66.0 units/week | 5795 (23) | 216 (8) | 6011 (22) |
| Missing | 1175 (5) | 121 (5) | 1296 (5) |
| Red meat intake, n (%)c | |||
| Q1: 0.0–7.0 times/week | 5928 (23) | 1112 (43) | 7040 (25) |
| Q2: 7.1–9.5 times/week | 5692 (22) | 554 (22) | 6246 (22) |
| Q3: 9.6–12.8 times/week | 6439 (26) | 502 (19) | 6341 (25) |
| Q4: 12.9–59.8 times/week | 6058 (24) | 281 (11) | 6339 (23) |
| Missing | 1230 (5) | 121 (5) | 1351 (5) |
| Physical activity, n (%)d | |||
| Never | 6070 (24) | 472 (19) | 6542 (23) |
| 1–3 times/month | 7798 (31) | 724 (28) | 8522 (31) |
| 1–2 times/week | 6589 (26) | 777 (30) | 7366 (26) |
| 3–4 times/week | 3362 (13) | 423 (17) | 3785 (14) |
| 5–7 times/week | 1095 (4) | 137 (5) | 1232 (4) |
| Missing | 433 (2) | 37 (1) | 470 (2) |
| Sunburns, n (%)e | |||
| Never | 5517 (22) | 840 (33) | 6357 (23) |
| 1 time/year | 16 224 (64) | 1430 (56) | 17 654 (63) |
| 2–3 times/year | 2565 (10) | 203 (8) | 2768 (10) |
| ≥4 times/year | 308 (1) | 31 (1) | 339 (1) |
| Missing | 733 (3) | 66 (2) | 799 (3) |
| Sunbathing, n (%)e | |||
| Never | 1959 (8) | 60 (2) | 2019 (7) |
| 1 week/year | 7208 (28) | 434 (17) | 7642 (27) |
| 2–3 weeks/year | 9803 (39) | 1187 (46) | 10 990 (40) |
| ≥4 weeks/year | 5496 (22) | 806 (32) | 6302 (23) |
| Missing | 881 (3) | 83 (3) | 964 (3) |
| Solarium use, n (%)e | |||
| Never | 11 759 (46) | 331 (13) | 12 090 (43) |
| Rarely | 10 400 (41) | 1523 (59) | 11 923 (43) |
| 1–2 times/month | 1729 (7) | 399 (16) | 2128 (8) |
| ≥3 times/month | 888 (4) | 264 (10) | 1152 (4) |
| Missing | 571 (2) | 53 (2) | 624 (2) |
| Sunscreen use, n (%) | |||
| Never/rarely | 10 137 (40) | 495 (19) | 10 632 (38) |
| Often | 8436 (33) | 737 (29) | 9173 (33) |
| Almost always | 6456 (26) | 1308 (51) | 7764 (28) |
| Missing | 318 (1) | 30 (1) | 348 (1) |
BMI, body mass index.
Missing numbers in continuous variables: age at first child (n = 6190); height (n = 331); weight (n = 374); no. of offshore jobs (n = 278); employment duration (n = 1480); pack-years (n = 704) among former or current smokers.
Summed units of beer (0.5 litre), wine (glass) or spirits (drink).
Mean units of cold red meat (e.g. roast beef, boiled ham), paté, bacon, steaks, hamburgers and hot dogs consumed onshore and offshore during a week.
Exercise the past year; minimum of 20 min with intensity that made you sweaty and short of breath.
After age 20.
Each worker reported their job title, start date and stop date for up to eight jobs. The decision to limit the questionnaire to eight jobs per worker was based on an assumption in the project reference group (i.e. experts from the petroleum industry, unions and the Norwegian Petroleum Safety Authorities) that few workers would have more jobs. Only the first and last job were electronically readable from the questionnaires, meaning that title, start date and stop date for job 2 to job 7 were coded as free-text, and had to be extracted manually from the questionnaires. Less than 2 % reported eight jobs, which means the fraction of workers with more than eight jobs was small and that the loss of employment data due to this restriction was small. The self-reported job titles were mapped into 27 aggregate job categories based on correspondence with the project reference group.18,19 The work history data reported by the workers (start date, stop date, job) required systematic harmonization of overlapping employment records to avoid overestimating exposure before exposure linkage to job-exposure matrices (JEMs).20
Development of job-exposure matrices (JEMs)
Table 4 gives an overview of the 18 JEMs that have been prepared specifically for the NOPW cohort, by type of exposure assessment, publication and exposed job categories. In 2005, a group at the University of Bergen started to develop expert-based JEMs where the aim was to identify and describe the degree of exposure to agents, mixtures or exposure situations with known and suspected carcinogenic potential among offshore workers on the Norwegian continental shelf who were employed 1970–2005.18,19 There has been a paucity of measurement data of known and suspected carcinogenic agents in the Norwegian offshore work environment, and most of the data available at the time of the JEM development were recorded after 1990.21 Hence, an expert-based approach was chosen for the development of the JEMs, where three university and five industry experts in occupational hygiene individually assessed the likelihood of exposure to 1836 combinations of carcinogens (n = 18), job categories (n = 27) and time periods (n = 4), resulting in the JEMs shown in Table 4. The JEMs and their development have been described in detail elsewhere.18,19,22,23
Table 4.
Overview of job-exposure matrices available for the Norwegian Offshore Petroleum Workers (NOPW) cohort
| Job-exposure matrices | Benzene | Mineral oil inhal. | Mineral oil skin | Crude oil skin | Oil mistvapour | Chlor. degreaser | Dichloro- methane | Asbestos | Cryst. silica | RCFs | Welding fumes | Diesel exhaust | Nickel | Chrome IV | Inorganic lead | Formal- dehyde | Exposure as painter | Ionizing radiation |
|---|---|---|---|---|---|---|---|---|---|---|---|---|---|---|---|---|---|---|
| Type of exposure assessment (X) | ||||||||||||||||||
| Expert-based | X | X | X | X | X | X | X | X | X | X | X | X | X | X | X | X | X | |
| Semi-quantitative | X | X | ||||||||||||||||
| Quantitative | X | |||||||||||||||||
| Measurement data used | X | X | X | |||||||||||||||
| JEM publication (X) | ||||||||||||||||||
| Steinsvåg et al., 2005 | X | X | X | X | X | X | X | X | X | X | X | X | X | X | X | X | X | |
| Steinsvåg et al., 2007 | X | X | X | X | X | X | X | X | X | X | X | X | X | X | X | X | X | |
| Bråtveit et al., 2011 | X | X | X | |||||||||||||||
| Exposed job-categories (X) | ||||||||||||||||||
| Production | ||||||||||||||||||
| Process technicians | X | X | X | X | X | X | X | X | X | X | X | |||||||
| Control room operators | ||||||||||||||||||
| Laboratory engineers | X | X | X | X | X | |||||||||||||
| Drilling | ||||||||||||||||||
| Drill floor crew | X | X | X | X | X | X | X | X | X | |||||||||
| Shale shaker operators | X | X | X | X | X | X | X | X | X | |||||||||
| Derrick employees | X | X | X | X | X | X | X | X | ||||||||||
| Drillers | X | X | X | X | X | X | X | |||||||||||
| Well service crew | X | X | X | X | X | X | X | |||||||||||
| MWD and mud loggers/engineers | X | X | X | X | X | X | ||||||||||||
| Maintenance | ||||||||||||||||||
| Electricians | X | X | X | X | X | X | ||||||||||||
| Electric instrument technicians | X | X | X | X | X | |||||||||||||
| Radio employees | ||||||||||||||||||
| Non-destructive testing | X | X | ||||||||||||||||
| Plumbers and piping engineers | X | X | X | X | X | X | X | X | X | X | ||||||||
| Welders | X | X | X | X | X | X | X | X | ||||||||||
| Sheet metal workers | X | X | X | X | X | X | X | X | ||||||||||
| Mechanics | X | X | X | X | X | X | X | X | X | X | X | |||||||
| Machinists | X | X | X | X | X | X | X | |||||||||||
| Turbine operators, hydraulics technicians | X | X | X | X | ||||||||||||||
| Deck crew | X | X | X | X | X | X | X | X | X | X | X | X | X | X | ||||
| Industrial cleaner | X | X | X | X | X | X | X | |||||||||||
| Surface treatment (painters) | X | X | X | X | X | X | X | X | X | X | ||||||||
| Scaffold crew | X | X | X | X | X | |||||||||||||
| Insulators | X | X | X | X | X | |||||||||||||
| Catering/office/administration | ||||||||||||||||||
| Catering workers | X | |||||||||||||||||
| Chefs | ||||||||||||||||||
| Health, office administration |
Chlor., chlorinated; inhal., inhale; cryst., crystalline; MWD, measure while drilling; RCF, refractory ceramic fibres.
In 2010–11, the JEMs for benzene, asbestos and oil mist/vapour were refined with more measurement data and a new methodological approach, in order to obtain exposure estimates that: (i) more clearly captured the contrasts in exposure between job categories and time periods; and (ii) were based on exposure determinants related to performed work-tasks, rather than probability for exposure at the job-category level.21 As indicated by type of exposure assessment in Table 4, two different refinement strategies were chosen for the three agents. For benzene and asbestos, the paucity of measurement data prompted a semi-quantitative and task-oriented strategy.24 For oil mist/vapour, however, measurement data during offshore drilling in Norway 1979–2004 were published by Steinsvåg et al.,25 who concluded that exposure to oil mist/vapour declined over time, and that exposure levels were associated with rig type, mud temperature, technical control measures, type and viscosity of the base oil, work area and season. Subsequently, these measurement data were used for development of the oil mist/vapour JEM with quantitative exposure estimates for drilling workers (Table 4).21 Details of the JEM refinement have been published elsewhere.15,16,21
What has been found? Key findings and publications
The studies that have been published from the cohort thus far have been of three types of epidemiological study design: cross-sectional studies (n = 2),26,27 cohort studies (n = 2)12,14 and case-cohort studies (n = 3).15–17 In addition, there was one methodological paper on harmonization of overlapping employment records.20 The cross-sectional studies used only data from the baseline questionnaire and described education, onshore occupations and factors associated with self-reported exposures in the offshore work environment. The cohort studies were linked to the CRN for prospective analyses of cancer risk, and SIRs were calculated for comparison with the Norwegian background population. The case-cohort design was used because work history data from job 2 to job 7 had to be extracted manually in order to obtain full work histories for each worker. To limit costs, this was extracted only for a random sample of the cohort (i.e. subcohort) and for all cancer cases based on a stratified case-cohort design.28 Simulation studies have confirmed that relative risk estimates from stratified case-cohort studies are similar to those produced by traditional cohort studies.29
In the first linkage (follow-up 1999–05), 695 male cancer cases were identified and the overall cancer incidence was close to that expected. Indications of excess risks were found for acute myeloid leukaemia (AML), (SIR 2.00, 95% CI: 0.97–3.72) and mesothelioma (SIR 2.18, 95% CI: 0.89–4.55).2,14 Among women, 78 cases were identified and excesses were found for the overall cancer incidence (SIR 1.31, 95% CI: 1.04–1.64) and for melanoma (SIR 2.75, 95% CI: 1.42–4.81).2 The first cross-sectional study showed that 59% had work experience before starting their offshore career and that 32% reported being employed outside the offshore sector at baseline. Vocational training was the most frequently reported educational level (39%).26
In 2014, the NOPW cohort was merged with the register-based cohort from the NREE (described above), resulting in a total of 41 000 workers including 2191 incident cancer cases identified between 1999 and 2009.12 In males, increased risks were seen for cancer of the urinary bladder (SIR 1.25, 95% CI: 1.05–1.49), the lung (SIR 1.14, 95% CI: 1.00–1.30) and the pleura (SIR 2.56, 95% CI; 1.58–3.91. A possible excess of kidney cancer was also observed (SIR 1.13, 95% CI: 0.90–1.39). In females, excesses were observed for overall cancer incidence (SIR 1.17, 95% CI: 1.02–1.34), lung cancer (SIR 1.69, 95% CI: 1.03–2.61), AML (SIR 5.29, 95% CI: 1.72–12) and melanoma (SIR 2.13, 95% CI: 1.41–3.08).
In 2015, a cross-sectional study was conducted to identify predictors of self-reported exposures. We found that holding a non-supervisory position, working shifts, being employed in the early period of the offshore industry and having only compulsory education increased the probability of reporting frequent exposure (e.g. vapours from mud, drilling/processing chemicals and solvents, exhaust fumes, natural gas).15
During 2015–17, three case-cohort studies were conducted to estimate cause-specific cancer risk. For benzene exposure, we found evidence for dose-response relationships with AML and multiple myeloma (Ptrends 0.052 and 0.024, respectively), and suggestively with chronic lymphocytic leukemia (Ptrend 0.094).15 For melanomas and non-melanomas of the forearm and hand, cumulative and duration metrics of benzene or of crude oil exposure showed Ptrends <0.05.16 For other anatomical sites, we observed an increased skin cancer risk associated with sunburn frequency and risk of melanoma and non-melanoma skin cancer (Ptrends <0.05 and <0.01, respectively).17
Table 2 shows SIRs of the latest linkage. Overall increased cancer risks were seen for both males (SIR 1.07, 95% CI: 1.04–1.11) and females (SIR 1.13, 95% CI: 1.01–1.26). Among males, elevated risk was found for pleura (SIR 2.38, 95% CI: 1.63–3.36), breast (SIR 2.18, 95% CI: 1.13–3.81) and prostate (SIR 1.20, 95% CI: 1.14–1.27). In females, risks of melanoma (SIR 1.62, 95% CI: 1.11–2.29) and AML (SIR 3.76, 95% CI: 1.22–8.78) were increased.
What are the main strengths and weaknesses?
A major asset of the NOPW cohort is the comprehensive questionnaire with extensive information on work history and potential confounding factors. Work history was recorded also for onshore periods before and after the offshore career, and in off-duty periods. Although these data are self-reported with the inherent potential of information bias, self-reporting of work histories has been found to be accurate and robust.30–33 Since all JEMs are developed by an independent group of industrial hygienists, and the work history was reported before diagnosis, we consider it as likely that neither exposure to specific agents nor case status affected the workers’ reporting. Thus, misclassification was most likely non-differential, which would result in attenuation of the effect estimate of the higher exposure category in crude age-adjusted models, whereas in multivariable models, non-differential misclassification may bias the effect estimates both away and towards the null.34 Due to the 11-digit PIN, linkage can be done with any population-based register in Norway, including the CRN, the Cause of Death Registry and the National Population Register (data on year of death/emigration) which enables precise calculation of person-time.
An important limitation is that data collection has only been performed once, in 1998. Hence, work histories only cover the period before and up to baseline: 1965–98. Thus, it is not possible to examine the effect of occupational exposure during the period of cancer follow-up from 1999 onwards. Moreover, no biological samples or clinical measurements have been collected, which hampers examination of molecular hypotheses.
Can I get hold of the data? Where can I find out more?
The data are held by the CRN. Requests for data sharing/case pooling may be directed to principal investigator Dr Tom K Grimsrud [tom.k.grimsrud@kreftregisteret.no]. Participation in the NOPW cohort studies is based on informed consent, which must be considered whenever use of data deviates from the original plans. Moreover, the research file uses data derived from state government registries, which deliver data under licence from regional committees for research ethics and data custodians. Thus, any requests to share these data will be subject to formal considerations and approval must be obtained from each data source. Background information on the study, the scientific team and study progress is available through the study website [https://www.kreftregisteret.no/en/Research/Projects/cancer-among-offshore-workers-in-norway/].
Profile in a nutshell
The Norwegian Offshore Petroleum Workers (NOPW) cohort was set up in 1998 for prospective follow-up of nearly 28 000 offshore workers for cancer incidence and cause-specific mortality; over 4000 cancer cases were identified by 2017.
The NOPW cohort is to our knowledge unique in consisting solely of offshore petroleum workers, which offers possibilities of gaining new insight into this part of upstream petroleum industry.
A range of job-exposure matrices has been developed specifically for the NOPW cohort, enabling studies of occupational exposures and cancer risk and mortality.
Due to the unique personal identification numbers, linkage can be done with national health registries, with complete follow-up and high-quality endpoints.
Supplementary Data
Supplementary data are available at IJE online.
Funding
This work was funded by grant 280537 from the Research Council of Norway’s PETROMAKS2 programme to the Cancer Registry of Norway (J.S.S., R.B., F.C.L., N.S. and T.K.G.). J.K. was funded by grant 280904 from the Research Council of Norway’s PETROMAKS2 programme. N.R., Q.L., D.T.S. and M.C.F. were funded by the Intramural Research Program of the Division of Cancer Epidemiology and Genetics, at the U.S. National Cancer Institute of the National Institutes of Health.
Supplementary Material
Acknowledgements
We wish to thank Adviser Tone Eggen and Research Assistant Ingunn Sivertsen (Cancer Registry of Norway) for extracting the detailed work histories and mapping job titles. Further, we wish to thank Industrial Hygienist Dr Bjørg Eli Hollund (University of Bergen and Haukeland University Hospital, Norway), and Prof. John Cherrie (Heriot-Watt University, Edinburgh, UK) for assistance in the development of the job-exposure matrices.
Author Contributions
J.S.S. and T.K.G. conceived of the paper. J.S.S., R.B., H.D.H., M.B.V. and T.K.G. drafted the paper. R.B. and J.S.S. performed the data management and analyses. M.B.V. and S.O.S. oversaw methodological aspects. M.B., J.K. and M.C.F. contributed to aspects relating to exposure assessment. N.R., Q.L., D.T.S., T.E.R., K.K., B.K.A., N.K.S. and F.C.L. contributed with knowledge specific to each cancer site. L.Å.S. contributed to the establishment of the NOPW cohort. All authors reviewed and revised the manuscript critically for important intellectual content and approved the final version for submission. Each author believes that the manuscript represents honest work and accepts responsibility for its content.
Conflict of Interest
The authors declare that they have no financial involvement or other relationships that might lead to a conflict of interest.
References
- 1. Hellesen G, Lønning A, Philipson C, Olsen A, Moe A.. Årsberetning. [Annual Report.] Stavanger, Norway: Statens Oljedirektorat [The Norwegian Petroleum Directorate; ], 1973. [Google Scholar]
- 2. Aas GB, Strand LÅ, Grimsrud TK.. Kartlegging av Kreftrisiko og Årsaksspesifikk Dødelighet Blant Ansatte i Norsk Offshorevirksomhet—Foreløpig Vurdering av Kreftforekomst og Skisse for Fremtidige Studier. [Cancer Incidence and Cause-specific Mortality Among Norwegian Offshore Petroleum Workers—Preliminary Evaluation of Cancer Incidence and Outline for Future Studies.] Oslo: Kreftregisteret [Cancer Registry of Norway; ], 2007. [Google Scholar]
- 3. Haukelid K. Bedriftskultur og Sikkerhet i Oljeboring [Company Culture and Safety During Oil Drilling Operations]. Oslo: University of Oslo, 1986. [Google Scholar]
- 4. Stenehjem JS. Yrkesrisiko i offshoreindustrien – endringer gjennom femti år. [Occupational Risk in the Offshore Petroleum Industry - Changes in the Last 50 Years.] PhD Trial Lecture. Oslo: University of Oslo, 2014.
- 5. Gardner R. Overview and characteristics of some occupational exposures and health risks on offshore oil and gas installations. Ann Occup Hyg 2003;47:201–10. [DOI] [PubMed] [Google Scholar]
- 6. Iversen OH. Oljeindustri og kreft. [The oil industry and cancer.] Tidsskr nor Laegeforen 1983;103:2299. [Google Scholar]
- 7. Lærum OD, Haugen A, Mørk SJ, Norseth T.. Kreftfare ved oljeutvinning og oljeprodukter. [Cancer risks connected to oil processing and oil products.] Tidsskr nor Laegeforen 1983;103:2300–05. [PubMed] [Google Scholar]
- 8. Eide I. A review of exposure conditions and possible health effects associated with aerosol and vapour from low-aromatic oil-based drilling fluids. Ann Occup Hyg 1990;34:149–57. [DOI] [PubMed] [Google Scholar]
- 9. Glattre E, Neegaard G, Titlestad G.. Kartlegging av kreftrisiko og dødelighet blant ansatte i norsk offshorevirksomhet. [Project Protocol for Prospective Studies of Cancer Incidence and Mortality in the Norwegian Offshore Industry.] Oslo: Kreftregisteret [Cancer Registry of Norway], 1992, pp. 1–28.
- 10. Strand LÅ, Andersen A.. Kartlegging av kreftrisiko og årsaksspesifikk dødelighet blant ansatte i norsk offshorevirksomhet – innsamling av bakgrunnsdata og etablering av kohort. [Identification of Cancer Risk and Cause-specific Mortality Among Employees in the Norwegian Offshore Oil Industry – Data Retrieval and Cohort Establishment]. Oslo: Kreftregisteret [Cancer Registry of Norway], 2001, pp. 1–45.
- 11. Kirkeleit J, Riise T, Bråtveit M, Moen BE.. Increased risk of acute myelogenous leukemia and multiple myeloma in a historical cohort of upstream petroleum workers exposed to crude oil. Cancer Causes Control 2008;19:13–23. [DOI] [PubMed] [Google Scholar]
- 12. Stenehjem JS, Kjaerheim K, Rabanal KS, Grimsrud TK.. Cancer incidence among 41,000 offshore oil industry workers. Occup Med (Lond )2014;64:539–45. [DOI] [PubMed] [Google Scholar]
- 13. Larsen IK, Smastuen M, Johannesen TB. et al. Data quality at the Cancer Registry of Norway: an overview of comparability, completeness, validity and timeliness. Eur J Cancer 2009;45:1218–31. [DOI] [PubMed] [Google Scholar]
- 14. Aas GB, Aagnes B, Strand LÅ, Grimsrud TK.. Suggested excess of occupational cancers in Norwegian offshore workers: preliminary results from the Cancer Registry Offshore Cohort. Scand J Work Environ Health 2009;35:397–99. [DOI] [PubMed] [Google Scholar]
- 15. Stenehjem JS, Kjærheim K, Bråtveit M. et al. Benzene exposure and risk of lymphohaematopoietic cancers in 25 000 offshore oil industry workers. Br J Cancer 2015;112:1603–12. [DOI] [PMC free article] [PubMed] [Google Scholar]
- 16. Stenehjem JS, Robsahm TE, Bratveit M, Samuelsen SO, Kirkeleit J, Grimsrud TK.. Aromatic hydrocarbons and risk of skin cancer by anatomical site in 25 000 male offshore petroleum workers. Am J Ind Med 2017;60:679–88. [DOI] [PubMed] [Google Scholar]
- 17. Stenehjem JS, Robsahm TE, Bratveit M, Samuelsen SO, Kirkeleit J, Grimsrud TK.. Ultraviolet radiation and skin cancer risk in offshore workers. Occup Med (Lond )2017;67:569–73. [DOI] [PubMed] [Google Scholar]
- 18. Steinsvag K, Bratveit M, Moen BE.. Exposure to carcinogens for defined job categories in Norway's offshore petroleum industry, 1970 to 2005. Occup Environ Med 2006;64:250–58. [DOI] [PMC free article] [PubMed] [Google Scholar]
- 19. Steinsvåg K, Bråtveit M, Moen BE.. Eksponering for kreftfremkallende faktorer i norsk offshore petroleumsvirksomhet, 1970–2005. [Exposure to Carcinogenic Agents in the Norwegian Offshore Petroleum Industry 1970–2005.] Bergen, Norway: University of Bergen, 2005.
- 20. Stenehjem JS, Babigumira R, Friesen MC, Grimsrud TK.. Harmonizing work history data in epidemiologic studies with overlapping employment records. Am J Ind Med 2019;62:422–29. [DOI] [PMC free article] [PubMed] [Google Scholar]
- 21. Bråtveit M, Hollund BE, Kirkeleit J, Abrahamsen EH.. Supplementary Information to the Job Exposure Matrix for Benzene, Asbestos and Oil Mist/Oil Vapour Among Norwegian Offshore Workers. Bergen, Norway: University of Bergen, 2011. [Google Scholar]
- 22. Steinsvag K, Bratveit M, Moen B. et al. Expert assessment of exposure to carcinogens in Norway's offshore petroleum industry. J Expo Sci Environ Epidemiol 2008;18:175–82. [DOI] [PubMed] [Google Scholar]
- 23. Steinsvag K, Bratveit M, Moen BE, Kromhout H.. Inter-rater agreement in the assessment of exposure to carcinogens in the offshore petroleum industry. Occup Environ Med 2007;64:582–88. [DOI] [PMC free article] [PubMed] [Google Scholar]
- 24. Hopf NB, Waters MA, Ruder AM, Prince MM.. Development of a retrospective job exposure matrix for PCB-exposed workers in capacitor manufacturing. J Occup Health 2010;52:199–208. [DOI] [PubMed] [Google Scholar]
- 25. Steinsvag K, Bratveit M, Moen BE.. Exposure to oil mist and oil vapour during offshore drilling in norway, 1979-2004. Ann Occup Hyg 2006;50:109–22. [DOI] [PubMed] [Google Scholar]
- 26. Aas GB, Strand LÅ, Grimsrud TK.. Kartlegging av kreftrisiko og årsaksspesifikk dødelighet blant ansatte i norsk offshorevirksomhet—utdanning og yrkesaktivitet utenfor offshore. [Cancer Incidence and Cause-specific Mortality Among Norwegian Offshore Petroleum Workers—Education and Occupation in Off-duty Periods] . Oslo: Kreftregisteret [Cancer Registry of Norway; ], 2007. [Google Scholar]
- 27. Stenehjem JS, Friesen MC, Eggen T, Kjærheim K, Bråtveit M, Grimsrud TK.. Self-reported occupational exposures relevant for cancer among 28,000 offshore oil industry workers employed between 1965 and 1999. J Occup Environ Hyg 2015;12:458–68. [DOI] [PMC free article] [PubMed] [Google Scholar]
- 28. Borgan O, Langholz B, Samuelsen SO, Goldstein L, Pogoda J.. Exposure stratified case-cohort designs. Lifetime Data Anal 2000;6:39–58. [DOI] [PubMed] [Google Scholar]
- 29. Cologne J, Preston DL, Imai K. et al. Conventional case–cohort design and analysis for studies of interaction. Int J Epidemiol 2012;41:1174–86. [DOI] [PubMed] [Google Scholar]
- 30. Bourbonnais R, Meyer F, Theriault G.. Validity of self reported work history. Occup Environ Med 1988;45:29–32. [DOI] [PMC free article] [PubMed] [Google Scholar]
- 31. Kromhout H, Vermeulen R.. Application of job-exposure matrices in studies of the general population - some clues to their performance. Eur Respir Rev 2001;11:80–90. [Google Scholar]
- 32. Teschke K, Olshan A, Daniels J. et al. Occupational exposure assessment in case–control studies: opportunities for improvement. Occup Environ Med 2002;59:575–94. [DOI] [PMC free article] [PubMed] [Google Scholar]
- 33. Wärneryd B, Thorslund M, Östlin P.. The quality of retrospective questions about occupational history—a comparison between survey and census data. Scand J Soc Med 1991;19:7–13. [DOI] [PubMed] [Google Scholar]
- 34. Jurek AM, Greenland S, Maldonado G, Church TR.. Proper interpretation of non-differential misclassification effects: expectations vs observations. Int J Epidemiol 2005;34:680–87. [DOI] [PubMed] [Google Scholar]
Associated Data
This section collects any data citations, data availability statements, or supplementary materials included in this article.