Abstract
BACKGROUND AND PURPOSE: The outcome of radiosurgery for vestibular schwannoma (VS) is assessed by posttreatment measurement of tumor size and could be influenced by the timing and quality of the assessment. This study evaluates the volumetric changes of VS after radiosurgery and proposes a radiologic follow-up program.
MATERIALS AND METHODS: Of 142 patients with VS treated with radiosurgery, we selected patients who were followed at least 3 times during a minimum of 32 months with a T1-weighted gadolinium-enhanced high-resolution 3D MR imaging examination identical to the pretreatment MR imaging. Forty-five patients were identified with a mean follow-up of 50 months (range, 32–78 months). Pre- and posttreatment tumor volumes were calculated by using BrainSCAN software by manually contouring tumors on each MR imaging study. Volume changes of >13% were defined as events.
RESULTS: At last follow-up MR imaging, volumes were smaller in 37 (82.2%) of the 45 patients. Eleven (29.7%) of these 37 tumors showed transient swelling preceding regression, with a median time to regression of 34 months (range, 20–55 months). Seven (15.6%) of the 45 tumors had volume progression compared with the tumor on pretreatment MR imaging studies. Of these 7 tumors, 3, however, had volume regression compared with the preceding MR imaging study, and in 4, volume progression was ongoing. One tumor remained the same.
CONCLUSIONS: Tumor-volume measurements by standardized T1-weighted gadolinium-enhanced high-resolution 3D MR imaging follow-up protocols revealed good local control of VS after radiosurgery. The first-follow-up MR imaging at 2 years and the second at 5 years postradiosurgery differentiated transient progression from ongoing progression and may prevent unnecessary therapeutic interventions.
Vestibular schwannoma (VS), also known as acoustic neuroma or acoustic neurinoma, is a benign tumor in the cerebellopontine angle, which arises from Schwann cells forming the myelin sheath around the vestibulocochlear nerve. It may cause symptoms due to compression effects. These symptoms include unilateral hearing loss, facial and trigeminal nerve dysfunction, and eventually hydrocephalus. Surgical removal of VS has long been the treatment of choice. Although treatment-related mortality has dropped to <1%, serious side effects have been reported, including unilateral deafness, facial nerve pareses, and CSF leakage.1–5
Leksell6 first described radiosurgery in 1971 as an alternative treatment for patients with VS. With the introduction of CT and MR imaging, this treatment has become more popular in the past decade, and treatment-related toxicity seems to be less compared with that in surgery.5,7,8 The aim of radiosurgery for VS is tumor control (ie, arrest of further increase of tumor volume). This means that treatment outcome has to be assessed by measurement of tumor size rather than with surgical removal. Most publications on treatment outcome in radiosurgery of VS report maximal tumor diameter as a criterion of assessing local control.9–14 Tumor-volume calculations, based on perpendicular tumor diameters, as described by the American Academy of Otolaryngology-Head and Neck Surgery, have been found to be more adequate in the assessment of local control.15 Improvements in the quality of MR imaging and the availability of digital data in recent years, however, enable measurement of tumor volume more accurately. Publications on measured tumor-volume outcome after radiosurgery for VS, however, are scarce and report voxel-based volume measurements, which are only applicable with small intracanalicular VS, or report volume measurements based on tumor contour drawings on hard copies and drawings on CT scans, or do not use uniform imaging techniques.16–18
Because local tumor control is always defined at a certain time interval after treatment, some authors published tumor size at different time points after radiosurgery, based on tumor diameter.19–21 The few studies that are available on these tumor-size time trends based on actual tumor-volume measurements have follow-up periods that are generally too short to assess long-term tumor-size time trends.17,18
To describe actual tumor-volume changes in VS treated with radiosurgery and subsequently to propose a post-treatment follow-up MR imaging program, we performed a retrospective study in which we measured and analyzed long-term tumor-volume changes based on digital tumor contour drawings on T1-weighted gadolinium-enhanced high-resolution 3D MR imaging in patients treated with radiosurgery for VS.
Materials and Methods
Patients and Treatment
Between 1998 and 2003, 142 consecutive patients with VS were treated with stereotactic radiation therapy at the linear accelerator (linac)-based radiosurgery facility of the VU University Medical Center in Amsterdam, the Netherlands. Before treatment, all patients had tumor progression documented by serial imaging and/or progression of their symptoms. All these patients were offered stereotactic radiation therapy as a first-line treatment.
Treatment was given in a single fraction of 12.5 Gy in edentulous patients or in 5 fractions of 5 Gy each in 5–7 days in dentate patients. The dose was prescribed at the 80% isodose line encompassing the tumor and normalized at 100%. Further details on treatment technique have been published previously.22
In all patients, a standard pretreatment MR imaging protocol was used to localize and assess tumor extent within 1 week before treatment. This included a magnetization-prepared rapid acquisition of gradient echo (MPRAGE) T1-weighted (2700/4.5 ms [TR/TE]), gadolinium-enhanced high-resolution MR imaging. This is a rapid gradient-echo technique in which a preparation pulse is applied before the acquisition sequence to enhance contrast. All images were obtained with 1T and 1.5T MR imaging units (Impact and Vision; Siemens, Erlangen, Germany). After treatment, all patients were followed by MR imaging. The follow-up MR imaging technique and schedule, however, were not standardized but depended on the preference of any of the attending physicians and could consequently differ from the pretreatment MR imaging protocol.
To assess and compare volumes, we included patients in this study who fulfilled all of the following criteria:
They were followed with a volumetric 3D MPRAGE imaging technique, with section thickness ≤1.5 mm, identical to the pretreatment localization MR image.
They were followed with MR imaging at least 3 times.
They were followed during a period of at least 32 months.
A retrospective search was conducted, and 45 patients were identified who complied with these requirements. These 45 patients were the subjects of this analysis. The remaining 97 patients were excluded from further analysis. The main reason for exclusion was the availability of fewer than 3 follow-up MR imaging studies, the application of different MR imaging sequences, or the use of a section thicknesses >1.5 mm; because this exclusion depended on randomly assigned physicians and not on patients’ characteristics, it is unlikely to have caused selection bias.
Of the 45 patients included for further analysis, 25 (55%) were men and 20 (45%) were women. The mean patient age at the time of treatment was 56 years (range, 35–80 years). The mean age of the 14 edentulous patients, who were treated with a single-fraction irradiation schedule, was 66 years. The mean age of the 31 dentate patients, who were irradiated with a fractionated schedule, was 52 years, and this difference was statistically significant (P < .001, t test).
Tumor Localization and Volume Measurement
Mean follow-up time was 50 months (range, 32–78 months). Depending on the length of follow-up time, patients had 3–6 follow-up MR imaging scans. A total of 217 MR imaging scans was obtained in the 45 study patients, including the initial localization scans. For practical purposes, MR imaging was typically performed in a sagittal plane. These sagittal scans were used for tumor contouring, whereas transversal-oriented scans were reconstructed in a sagittal plane for contouring.
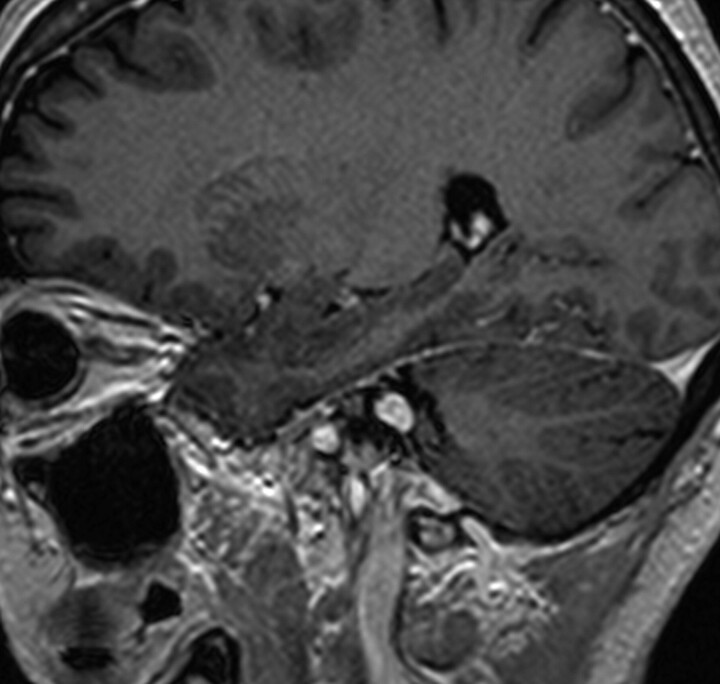
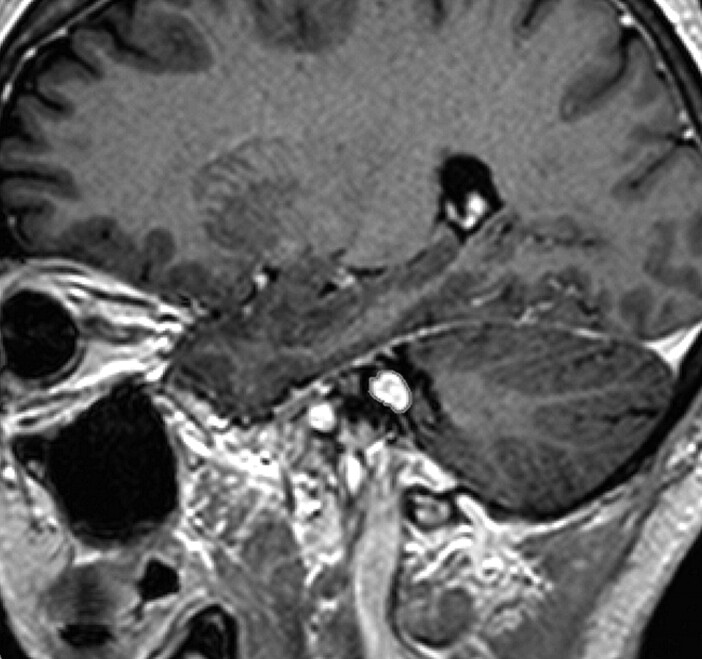
Every MR image was then transferred to a computer workstation (BrainLAB, Heimstetten, Germany), where the visible tumor was manually delineated on each section. On a mean number of 17 sections per scan, the tumors were visible and were delineated. This resulted in a total of 3689 sections on which the tumors were contoured. In order not to compromise tumor-volume comparison by systematic errors, all tumor volumes were delineated by the same observer (E.J.W.).23 Figures 1 and 2 show a typical MR imaging section and the corresponding processed image with the contoured tumor. Subsequently, a 3D tumor volume was determined for every MR imaging study by using BrainSCAN software (BrainLAB). The tumor contouring and volume calculation typically took only a few minutes in each patient and could well be used for daily clinical practice. Tumor volumes of the initial scan and of the follow-up scans were then available for analysis. With respect to Vokurka et al,16 who found, in manually delineated volumes on high-resolution 3D MR images, inaccuracies of ±13% in tumors with known volumes, we considered a volume change of >13% as progression or regression.
Fig 1.
Typical sagittal MR imaging section with a vestibular schwannoma.
Fig 2.
The processed image of the MR imaging section in Fig 1 with a contoured tumor.
Prognostic Factors
Specific patient- and treatment-related factors, which could predict tumor progression, were scored for analysis. These factors included sex, pretreatment tumor volume, patient age, left- or right-sided tumor localization, and treatment fractionation schedule.
Statistical Analysis
Comparisons of groups were made by using the paired t test, analysis of variance (ANOVA) for continuous data, and the χ2 test for categoric data. P values ≤ .05 were considered significant.
This retrospective study was performed with the approval of our review board; patient informed consent was waived by the board because all images were acquired for clinical purposes and were considered as existing data documents.
Results
Tumor Volumes and Follow-Up
The pretreatment tumor volumes ranged from 0.15 to 13.9 cm3, and the mean tumor volume was 3.1 cm3. Thirty-seven (82%) of the 45 irradiated tumors were reduced in volume on the last follow-up MR imaging examination compared with the initial pretreatment MR imaging examination. The mean tumor volume for these 37 tumors was reduced from 3.1 cm3 (range, 0.15–13.9 cm3) to 1.7 cm3 (range, 0.12–11.3 cm3). The difference from the mean pretreatment volume was statistically significant (P < .001, t test). The reduction in mean tumor volume in these 37 patients was 49% (range, 4%–90%). The mean tumor-volume reduction was more apparent in patients with the single-fraction irradiation schedule compared with the patients with the fractionated schedule, but this difference was not statistically significant (56% versus 46%, P = .424, ANOVA).
Of these 37 patients who had a smaller tumor volume on the last follow-up scan compared with the pretreatment localization scan, 11 tumors (30%) showed a transient increase in volume before the actual tumor-volume reduction took place. The transient swelling in these 11 patients resulted in a mean increase in volume of 25% after a mean follow-up time of 15 months. Median time to regression of these 11 tumors to a volume smaller than the initial pretreatment volume was 34 months (range, 20–55 months). Median time to regression to a volume smaller than the previously measured volume was 27 months (range, 20–55 months).
The remaining 8 of the 45 patients with irradiated tumors did not have a smaller tumor volume on the last follow-up scan compared with the pretreatment localization scan. An equal volume was found in 1 patient, and in 7 patients, the tumors had a larger volume on the last follow-up MR image in comparison with the initial pretreatment scan.
These 7 patients, who constituted 15.6% of the 45 patients with irradiated tumors, were followed for a median time of 47 months (range, 32–59 months). In 3 of those 7 patients however, the tumor showed regression in volume if it was compared with the previous follow-up scan instead of with the pretreatment scan. Median time to regression of those 3 tumors was 38 months (range, 35–47 months). The remaining 4 (9%) tumors had ongoing progression in their volumes. These 4 patients were followed for a median time of 54 months (range, 32–59 months). The increase in the mean volume of these 4 tumors was 44% (range, 13%–105%).
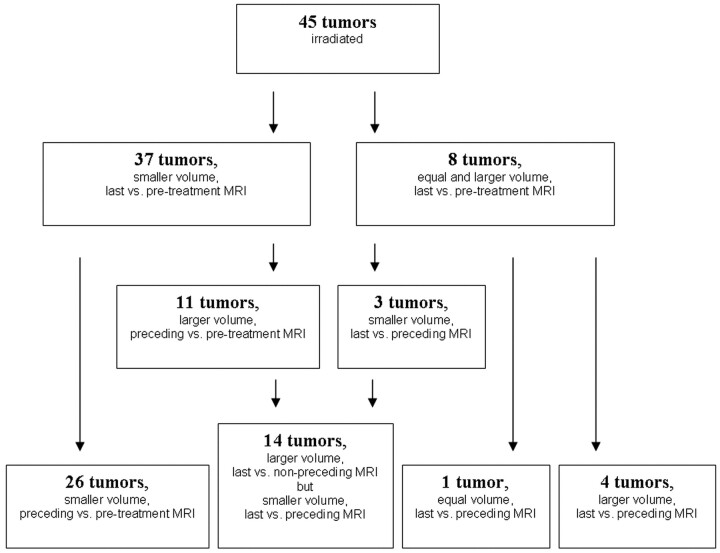
Totally, 14 (11 + 3) of 45 tumors initially showed progression but eventually regressed to a volume not per se smaller than the pretreatment volume. Median time to regression of these 14 tumors was 35 months (range, 20–55 months). Figure 3 shows the different tumor groups with respect to treatment response. It groups together the 26 tumors with ongoing regression, the 14 tumors with transient swelling, the single stable tumor, and the 4 ongoing progressive tumors.
Fig 3.
Tumor volumes grouped with respect to treatment response. MRI indicates MR imaging.
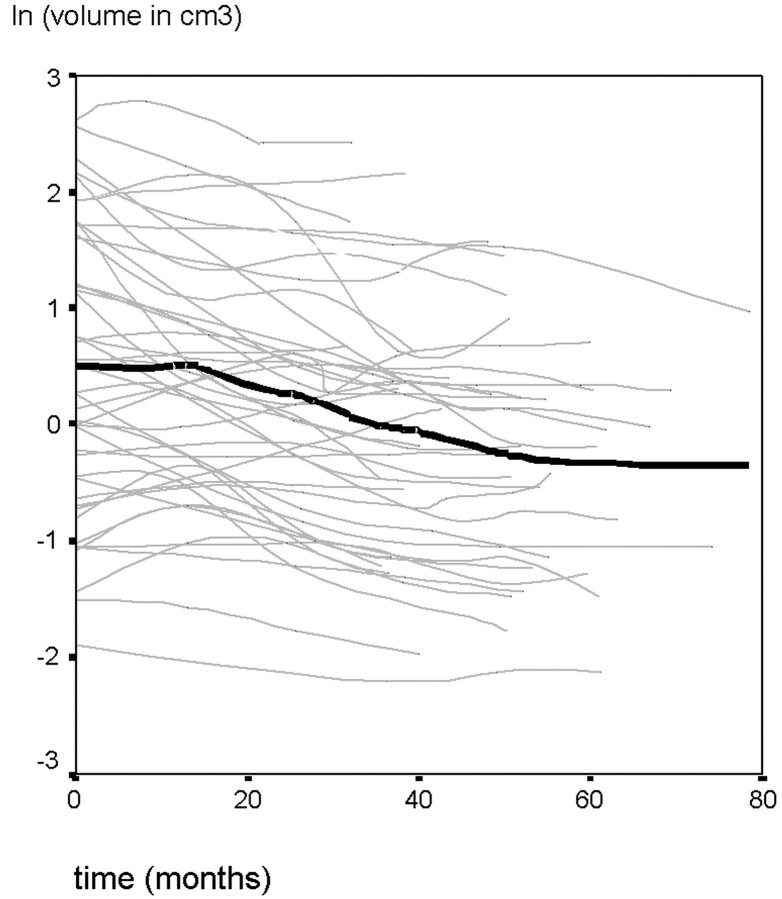
To reveal better the relative volume differences on the sequential MR images, we plotted tumor-volume changes on 3 different scales, ranging to 2.5, 10, and 20 cm3 (Fig 4A–C). To compare the individual tumor-volume changes after radiosurgery as a function of time, we normalized them by transforming them to their natural logarithms (Fig 5).
Fig 4.
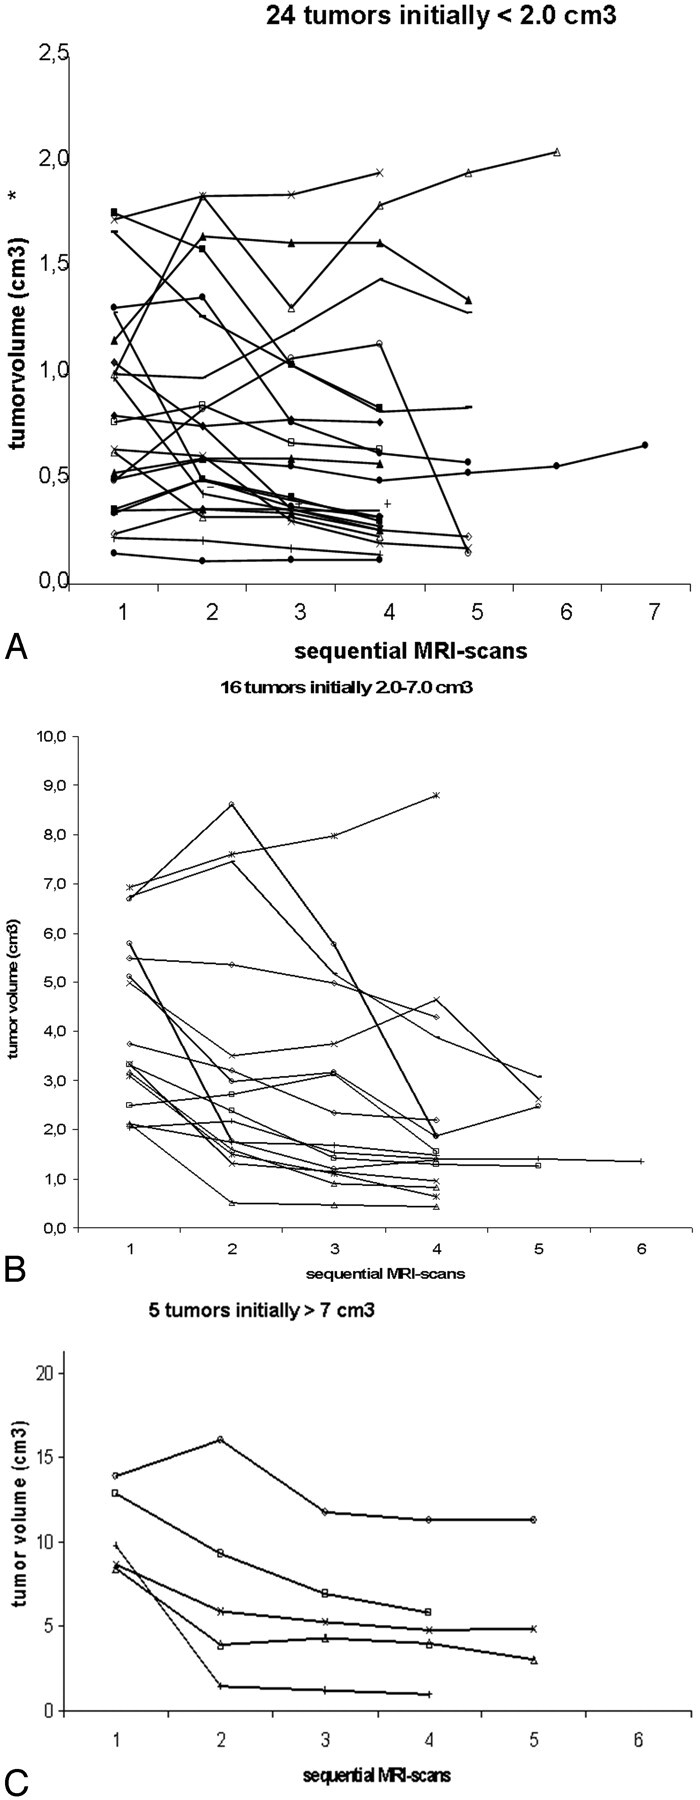
A, Tumor volumes at sequential MR images for the 24 tumors initially <2 cm3. B, Tumor volumes at sequential MR images for the 16 tumors initially from 2 to 7 cm3. C, Tumor volumes at sequential MR images for the 5 tumors initially >7 cm3.
Fig 5.
The logarithmic volumetric change of VS after radiosurgery with respect to time. The thick line represents the median natural logarithm of the tumor volumes as a function of time. Lines were smoothed by using a moving-average technique.
We also analyzed whether specific patient- or treatment-related factors could be found to predict tumor-volume progression. Differences in the number of progressive tumors with respect to patient age, sex, tumor volume, and radiation schedule were not statistically significant. The differences in the number of transient swelling tumors with respect to patient age, sex, and tumor volume or radiation schedule were also not found to be statistically significant (Table).
Tumor-volume progression with respect to patient- and treatment-related factors
| Progression | P value | Transient Swelling | P value | |
|---|---|---|---|---|
| Male | 4/25 | .93 | 6/25 | .94 |
| Female | 3/20 | 5/20 | ||
| Volume >3.1 cm3 | 3/16 | .66 | 3/16 | .51 |
| Volume ≤3.1 cm3 | 4/29 | 8/29 | ||
| Age >56 years | 2/19 | .43 | 6/19 | .34 |
| Age ≤56 years | 5/26 | 5/26 | ||
| Right-sided tumor | 3/16 | .66 | 3/16 | .51 |
| Left-sided tumor | 4/29 | 8/29 | ||
| Single-fraction treatment | 2/14 | .87 | 3/14 | .75 |
| Fractionated treatment | 5/31 | 8/31 |
Discussion
Tumor Control
During the past decade, radiosurgery has become an established treatment option for patients with VS. In recent series with long-term follow-up, local control rates of well over 90% were reported with this treatment.9–14,17–21
In the current series, we found that in as many as 7 of 45 patients (15.6%), the tumor was larger at last follow-up scanning than it was before treatment. In contrast to our current series, most of the studies used maximal axial diameters as a parameter to assess local control rates. Volume measurement, however, is more sensitive than linear-dimension measurement in detecting change.18 This typically means that a 10-mm tumor, which decreases in volume by 30%, will have only a 1-mm change in diameter. Part of these small volume changes might not have been found if a conventional assessment by measurement of tumor diameter was used.18
Prasad et al,17 in a large series on tumor assessment by volume measurement, found tumor progression after radiosurgery for VS in only 16% of their patients. An unknown proportion of their patients, however, was followed with CT instead of MR imaging, and section thickness and the technique of MR imaging follow-up studies were not stated and may have varied. In our current series, we included only patients who were followed with an MR imaging technique identical to that of the pretreatment technique.
Prasad et al17 also found that volume regression in smaller tumors was more difficult to assess and might negatively influence the tumor-control rate. Although we defined a volume reduction of >13% as regression, which corresponds to an absolute volume reduction of only 0.02 mL in the smallest tumor (0.15 mL) in our current series, we did not find a significant difference in the proportion of nonregressing tumors in patients with small tumors, compared with patients with large tumors (P = .175, ANOVA).16 The treatment technique of Prasad et al consisted of gamma knife (Electra, Stockholm, Sweden) radiosurgery, however, which can have considerable differences in maximum radiation dose between small volumes and large volumes. In our current series, all patients were treated with a linac radiosurgery technique, which gives equal radiation-dose homogeneity in large and small volumes. This might have contributed to our inability find a significant difference between the proportion of nonregressing tumors in small and large tumors.
In a VS series of Okunaga et al,24 tumor response after linac radiosurgery was assessed by volume measurements on high-resolution 3D MR images. After treatment, they found progressive tumors in 19% of patients. This relatively high proportion is in agreement with our present volumetric series, in which we found progression in 15.6% of patients. In the current series, however, all patients had documented progression before treatment. Okunaga et al, on the other hand, did not state their treatment indication, and treatment of stable lesions might have biased their results. In 3 of their 8 progressive tumors, progression was ongoing; and in 5 patients, progression eventually stopped. This is comparable to our current series, in which we found ongoing progression in 4 of the initial 8 progressive tumors.
Transient Swelling and Follow-Up Schedule
In early series, transient swelling was reported in 5% of VS treated with radiosurgery.25 In more recent series, an incidence of 25%–62% has been reported, but the definition of transient swelling was not always clearly stated.17,18,26,27 In our current series, we defined “transient swelling” as a tumor-volume decrease to a volume smaller than that in pretreatment, preceded by a tumor-volume increase. It was found in 11 (24.4%) patients. In another 3 (6.7%) patients however, tumor-volume progression preceded regression to a volume still larger than the pretreatment volume. If this was considered transient swelling, not only would the transient swelling rate increase but our local control rate would improve.
In a series of follow-up volume mapping of VS after gamma knife radiosurgery, Yu et al18 found transient swelling in 63% of their patients and progression in only 5%. In the series of Okunaga et al,24 transient swelling was reported in 45.2% of patients. However, both Okunaga et al and Yu et al defined transient swelling as any shrinkage after progression. Moreover, part of the patient group of Yu et al had only 2 follow-up MR images, and mean follow-up time was only 22 months. Therefore, this short follow-up might have influenced the local control and transient swelling rate. Yu et al used hard copies of their follow-up MR images in part of their patients. As in the series of Prasad et al,17 Yu et al did not state if they used an identical MR imaging technique and section thickness with all their follow-up MR imaging.
We did not find any patient- or treatment-related factor that could predict tumor-volume progression or transient swelling. Although in contrast to many surgical series, this is in agreement with most radiosurgical series.28
The scheduling and timing of the follow-up MR imaging are of importance to differentiate transient swelling from genuine progression. In our current series, the tumors with transient swelling had a median time to regression to a volume smaller than that of the initial volume of 34 months, with a range of 20–55 months. This means that the first follow-up MR imaging should be scheduled not earlier than 20 months after treatment to differentiate any progressive swelling from genuine progression. This would also be in agreement with the results of Okunaga et al,24 who found shrinkage of all the transient swelling tumors within 2 years after treatment. The second follow-up MR imaging should be scheduled not before 55 months after treatment to enable differentiation of all transient swelling from genuine progression. Short-term follow-up might thus give an underestimation of local control and may possibly lead to unnecessary therapeutic salvage interventions.
Because this study was an analysis of radiologic data, we did not include clinical parameters. In case of symptomatic progression, interim assessment by MR imaging could be warranted. In case of sustained progression at 55 months, ongoing MR imaging surveillance might also be required.
Conclusion
Tumor volume measurements by a standardized high-resolution 3D MR imaging follow-up protocol reveal good local control after radiosurgery for VS. First follow-up MR imaging at 2 years and second follow-up MR imaging at 5 years postradiosurgery differentiate transient swelling from tumor progression.
References
- 1.Pitts LH, Jackler RK. Treatment of acoustic neuromas. N Engl J Med 1998;339:1471–73 [DOI] [PubMed] [Google Scholar]
- 2.Deen HG, Ebersold MJ, Harner SG, et al. Conservative management of acoustic neuroma: an outcome study. Neurosurgery 1996;39:260–64 [DOI] [PubMed] [Google Scholar]
- 3.Lin VY, Stewart C, Grebenyuk J, et al. Unilateral acoustic neuromas: long-term hearing results in patients managed with fractionated stereotactic radiotherapy, hearing preservation surgery, and expectantly. Laryngoscope 2005;115:292–96 [DOI] [PubMed] [Google Scholar]
- 4.Sluyter S, Graamans K, Tulleken CA, et al. Analysis of the results obtained in 120 patients with large acoustic neuromas surgically treated via the translabyrinthine-transtentorial approach. J Neurosurg 2001;94:61–66 [DOI] [PubMed] [Google Scholar]
- 5.Roland PS, Eston D. Stereotactic radiosurgery of acoustic tumors. Otolaryngol Clin North Am 2002;35:343–55 [DOI] [PubMed] [Google Scholar]
- 6.Leksell L. A note on the treatment of acoustic tumours. Acta Chir Scand 1971;137:763–65 [PubMed] [Google Scholar]
- 7.Meijer OW, Wolbers JG, Baayen JC, et al. Fractionated stereotactic radiation therapy and single high-dose radiosurgery for acoustic neuroma: early results of a prospective clinical study. Int J Radiat Oncol Biol Phys 2000;46:45–49 [DOI] [PubMed] [Google Scholar]
- 8.Kondziolka D, Lunsford LD, McLaughlin MR, et al. Long-term outcomes after radiosurgery for acoustic neuroma. N Engl J Med 1998;339:1426–33 [DOI] [PubMed] [Google Scholar]
- 9.Williams JA. Fractionated stereotactic radiotherapy for acoustic neuromas. Int J Radiat Oncol Biol Phys 2002;54:500–04 [DOI] [PubMed] [Google Scholar]
- 10.Flickinger JC, Kondziolka D, Niranjan A, et al. Results of acoustic neuroma radiosurgery: an analysis of 5 years’ experience using current methods. J Neurosurg 2001;94:1–6 [DOI] [PubMed] [Google Scholar]
- 11.Andrews DW, Suarez O, Goldman HW, et al. Stereotactic radiosurgery and fractionated stereotactic radiotherapy for the treatment of acoustic schwannomas: comparative observations of 125 patients treated at one institution. Int J Radiat Oncol Biol Phys 2001;50:1265–78 [DOI] [PubMed] [Google Scholar]
- 12.Combs SE, Volk S, Schulz-Ertner D, et al. Management of acoustic neuromas with fractionated stereotactic radiotherapy (FSRT): long-term results in 106 patients treated in a single institution. Int J Radiat Oncol Biol Phys 2005;59:75–81 [DOI] [PubMed] [Google Scholar]
- 13.Foote KD, Friedman WA, Buatti JM, et al. Analysis of risk factors associated with radiosurgery for vestibular schwannoma. J Neurosurg 2001;95:440–49 [DOI] [PubMed] [Google Scholar]
- 14.Chung HT, Ma R, Toyota B, et al. Audiologic and treatment outcomes after linear accelerator-based stereotactic irradiation for acoustic neuroma. Int J Radiat Oncol Biol Phys 2004;59:1116–21 [DOI] [PubMed] [Google Scholar]
- 15.Committee on Hearing and Equilibrium guidelines for the evaluation of results of treatment of conductive hearing loss: American Academy of Otolaryngology-Head and Neck Surgery Foundation, Inc. Otolaryngol Head Neck Surg 1995;113:186–87 [DOI] [PubMed] [Google Scholar]
- 16.Vokurka EA, Herwadkar A, Thacker NA, et al. Using bayesian tissue classification to improve the accuracy of vestibular schwannoma volume and growth measurement. AJNR Am J Neuroradiol 2002;23:459–67 [PMC free article] [PubMed] [Google Scholar]
- 17.Prasad D, Steiner M, Steiner L. Gamma surgery for vestibular schwannoma. J Neurosurg 2000;92:745–59 [DOI] [PubMed] [Google Scholar]
- 18.Yu CP, Cheung JY, Leung S, et al. Sequential volume mapping for confirmation of negative growth in vestibular schwannomas treated by gamma knife radiosurgery. J Neurosurg 2000;93 (suppl 3):82–89 [DOI] [PubMed] [Google Scholar]
- 19.Laasonen EM, Troupp H. Volume growth rate of acoustic neurinomas. Neuroradiol 1986;28:203–07 [DOI] [PubMed] [Google Scholar]
- 20.Shirato H, Sakamoto T, Takeichi N, et al. Fractionated stereotactic radiotherapy for vestibular schwannoma (VS): comparison between cystic-type and solid-type VS. Int J Radiat Oncol Biol Phys 2000;48:1395–401 [DOI] [PubMed] [Google Scholar]
- 21.Williams JA. Fractionated stereotactic radiotherapy for acoustic neuromas: preservation of function versus size. J Clin Neurosci 2003;10:48–52 [DOI] [PubMed] [Google Scholar]
- 22.Meijer OW, Vandertop WP, Baayen JC, et al. Single-fraction vs. fractionated linac-based stereotactic radiosurgery for vestibular schwannoma: a single-institution study. Int J Radiat Oncol Biol Phys 2003;56:1390–06 [DOI] [PubMed] [Google Scholar]
- 23.Hermans R, Feron M, Bellon E, et al. Laryngeal tumor volume measurements determined with CT: a study on intra- and interobserver variability. Int J Radiat Oncol Biol Phys 1998;40:553–57 [DOI] [PubMed] [Google Scholar]
- 24.Okunaga T, Matsuo T, Hayashi N, et al. Lineair accelerator radiosurgery for vestibular schwannoma: measuring tumor volume changes on serial three-dimensional spoiled gradient-echo magnetic resonance images. J Neurosurg 2005;103:53–58 [DOI] [PubMed] [Google Scholar]
- 25.Pollock BE, Lunsford LD, Noren G. Vestibular schwannoma management in the next century: a radiosurgical perspective. Neurosurgery 1998;43:475–81 [DOI] [PubMed] [Google Scholar]
- 26.van Eck AT, Horstmann GA. Increased preservation of functional hearing after gamma knife surgery for vestibular schwannoma. J Neurosurg 2005; (102 suppl):204–06 [PubMed]
- 27.Wowra B, Muacevic A, Jess-Hempen A, et al. Outpatient gamma knife surgery for vestibular schwannoma: definition of the therapeutic profile based on a 10-year experience. J Neurosurg 2005; (102 suppl):114–18 [PubMed]
- 28.De Salles AAF, Frighetto L, Selch M. Stereotactic and microsurgery for acoustic neuroma: the controversy continues. Int J Radiat Oncol Biol Phys 2003;56:1215–17 [DOI] [PubMed] [Google Scholar]


