

Abstract
BACKGROUND AND PURPOSE: Widespread pain sensitivity in patients with fibromyalgia (FM) suggests a central nervous system (CNS)-processing problem. Therefore, it is conceivable that metabolic alterations exist in pain-processing brain regions of people with FM compared with healthy controls (HC) and that such metabolic data could correlate with clinical symptoms. The purpose of this study was to test these hypotheses using proton MR spectroscopy (1H-MR spectroscopy).
Materials and METHODS: There were 21 patients with FM and 27 HC who underwent conventional structural MR imaging and additional 2D-chemical shift imaging (CSI) MR-spectroscopy sequences. For the 2D-CSI spectroscopy, larger volumes of interest (VOIs) were centered at the level of the basal ganglia and the supraventricular white matter. Within these larger areas, 16 smaller voxels were placed in a number of regions previously implicated in pain processing. N-acetylaspartate (NAA)/creatine(Cr), choline (Cho)/Cr and NAA/Cho ratios were calculated for each voxel. Subjects underwent clinical and experimental pain assessment.
RESULTS: Mean metabolite ratios and ratio variability for each region were analyzed by using repeated-measures analysis of variance (ANOVA). Correlations between clinical symptoms and metabolite ratios were assessed. Cho/Cr variability in the right dorsolateral prefrontal cortex (DLPFC) was significantly different in the 2 groups; a significant correlation between Cho/Cr in this location and clinical pain was present in the FM group. Evoked pain threshold correlated significantly with NAA/Cho ratios in the left insula and left basal ganglia.
CONCLUSION: Our data suggest that there are baseline differences in the variability of brain metabolite relative concentrations between patients with FM and HC, especially in the right DLPFC. Furthermore, there are significant correlations between metabolite ratios and clinical and experimental pain parameters in patients with FM.
Fibromyalgia (FM) is a chronic pain condition that afflicts 2% to 4% of the population in industrialized countries.1 It is the second most common rheumatologic disease behind osteoarthritis; however, the underlying pathology is unknown. Pain sensitivity in FM is widespread, suggesting a potential dysfunction in CNS processing of painful sensations.
Patients with FM exhibit a normal “detection threshold” to sensory stimuli; however, they also display hyperalgesia or allodynia.2–4 This enhanced sensitivity to painful stimuli is not confined to pressure but includes responses to multiple stimuli such as heat, noise, and electricity.5,6 These data, in conjunction with the finding that pain is not localized to a particular body region, suggest that this condition may be largely because of augmented CNS processing of pain.
The neurophysiology of pain processing has received increasing interest in recent years with the use of functional neuroimaging, providing an invaluable tool to investigate these mechanisms. Data from multiple functional imaging techniques consistently identify the same brain structures that are activated during painful conditions. These structures have been termed the pain matrix. Positron-emission tomography (PET) and functional MR imaging (fMRI) show that painful thermal, electrical, chemical, and pressure stimulation result in increased regional cerebral blood flow (rCBF) in structures involved in the processing of sensation, movement, cognition, and emotion.7–9
A single-photon emission CT (SPECT) study by Mountz et al10 of patients with FM revealed diminished baseline rCBF in bilateral thalami and caudate nuclei in these patients compared with healthy controls (HC). Kwiatek et al11 also demonstrated reduced rCBF in the inferior dorsal pons and the right thalamus with a similar trend in the left thalamus in patients with FM compared with HC. The same study also revealed a restricted region in the right lentiform nucleus.
An fMRI investigation conducted by Gracely et al12 showed a significant relative increase in fMRI signal intensity in multiple brain regions implicated in pain processing in patients with FM when both these patients and HC were challenged with the same painful stimulus.12 These findings of augmented central pain processing have been confirmed in other studies.13,14
Proton MR spectroscopy (1H-MR spectroscopy) is a noninvasive technique that provides an insight into brain biochemistry.15
Measurement of CNS metabolites has been largely understudied in the field of pain research. Grachev et al16 discovered that the level of N-acetylaspartate (NAA), a marker for neuronal viability and also function, is lower within the dorsolateral prefrontal cortex (DLPFC) of patients with chronic low back pain as compared with HC.
The purpose of our study was twofold:
1) To test the hypothesis that there are metabolic alterations detected by 1H-MR spectroscopy in several brain regions implicated in pain processing between patients with FM and healthy age-matched controls.
2) To test the hypothesis that metabolic data in these areas correlates with levels of both clinical (ie, spontaneously reported) and evoked (ie, in response to experimental pain testing) pain.
Methods
Subjects
Twenty-one patients (17 women, 4 men; age range, 20–57 years; mean age, 41.0 years) who met the 1990 American College of Rheumatology (ACR) criteria for fibromyalgia17 as well as 27 HC (21 women, 6 men; age range, 22–59 years; mean age, 43.9 years) were included. Our institutional review board approved this study, and we obtained informed consent from all participants.
All subjects underwent comprehensive screening, during which diagnosis according to the ACR criteria for FM was confirmed for the patient population. Time from diagnosis of FM for patients included in the study varied from 0.25 to 11.75 years, mean value of 5.15 ± 2.25 years.
Pregnant and left-handed subjects were excluded from the study; left-handed subjects were excluded from the study to reduce potential laterality effects in the pain-processing pathway. Exclusion criteria also included presence of comorbid conditions capable of causing worsening of physical functional status independent of the diagnosis and any psychiatric disorder involving a history of psychosis, current suicide risk or attempt within the last 2 years, or substance abuse within the last 2 years; these were chosen to limit potential confounding effects on the spectroscopic data. Depression itself was not part of the exclusion criteria for the study, given its high prevalence in this population. However, it was assessed via the Center for Epidemiological Studies Depression Scale (CES-D) questionnaire.
Subjects who qualified for inclusion on the study were scheduled for a single day study protocol. This included obtaining the clinical history and completion of self-report questionnaires, as well as experimental pressure pain testing followed by a standard pre- and postcontrast-enhanced MR imaging and additional 2D-chemical shift imaging (CSI) 1H-MR spectroscopy sequences.
Pain Assessment
Clinical pain.
Clinical pain was assessed immediately before the 1H-MR spectroscopy scan with a 10-cm visual analog scale (VAS). This scale was a 10-cm line anchored by the words “no pain” and “worst possible pain” on the left and right end of the scale, respectively.
Experimental pain.
Pressure pain threshold was assessed before the 1H-MR spectroscopy scan. Discrete pressure stimuli were applied to the subject's left thumbnail with use of a stimulation device, which eliminates any direct examiner/subject interaction. The apparatus induced pressure via a hydraulic system connected to a 1-cm2 hard rubber circular probe that was pressed against the thumbnail. The thumbnail was chosen, as it has been shown to be highly representative for overall pressure sensitivity.18 The stimulator was positioned over the thumb by a plastic housing and the hydraulic system activated by calibrated weights placed on a moveable table. Valves controlled stimulus timing and the combination of valves and calibrated weights allowed for controlled and repeatable stimulation. Pain intensity ratings were recorded on the GBSint questionnaire.19 To first determine the subject's pain range, stimuli of 5-second duration were applied to the right thumbnail in ascending order. Initial stimulation pressure was 0.5 kg, and the pressure was increased in 0.5-kg increments up to either a subject's level of pain tolerance or to a maximum of 10 kg.
These values were then used to determine the starting pressure levels for the random presentation paradigm (multiple random staircase). During the random staircase testing, the stimulus pressures were determined interactively: a computer program continuously adjusted the stimulus pressures in the 3 staircases to produce the same response distribution in each subject.20 The 3 staircases used were to titrate stimulus pressures to pain responses of 0.5 (“faint”), 7.5 (“mild”), and 13.5 (“slightly intense”). Each of the 3 staircases delivered 12 stimuli (36 total), and the program switched between staircases in a pseudorandomized order. Subjects were instructed that they would receive a series of pressure stimuli within the range of the previous ascending series. Pain intensity ratings were obtained with the GBSint scale, and interstimulus interval was 30 seconds. The results of the 3 staircases were used to assess evoked pressure pain sensitivity.
Questionnaires
The CES-D questionnaire, a 20-item self-report questionnaire assessing symptoms of depression in nonpsychiatric adults, was administered to the FM group.21 The Spielberger Trait Personality Inventory anxiety questionnaire22 and the Catastrophizing Component of the Coping Strategies Questionnaire were also given to all patients in the FM group.23
MR Imaging and MR Spectroscopy
All subjects were imaged on a 1.5T MR unit (GE Healthcare, Milwaukee, Wis). The patients underwent a standard adult protocol brain MR examination before and after administration of intravenous contrast (Magnevist; Bayer HealthCare Pharmaceuticals, Wayne, NJ), which included the following sequences: axial and sagittal T1 (spin-echo [SE] TR/TE 470/min full); axial T2 (fast spin-echo TR/TE 3000–5000/102); axial fluid-attenuated inversion recovery (T2-weighted, TR/TE 10000/95); axial diffusion-weighted (SE-echo-planar imaging b-value 0–1000 directions 9); and axial, coronal, and sagittal postcontrast T1 SE. If a tumor or an area of ischemia was present within the brain regions analyzed by MR spectroscopy, the patients would be excluded from the analysis. These as well as any other clinically relevant findings on structural MR imaging were reported to the patient's primary physician.
2D CSI MR-spectroscopy was performed as the last sequence of the study; volumes of interest (VOIs) were centered first at the level of the basal ganglia and then the supraventricular white matter at the centrum semiovale.
The following parameters were used: a point-resolved spectroscopy sequence; TR, 1500; TE, 144; FOV, 16 cm; matrix, 16 × 16; section thickness, 10 to 20 mm; acquisition, 1 average; scanning time, 5 minutes. The VOI was placed on non-angled contrast-enhanced axial T1-weighted images. One VOI was placed at the level of the basal ganglia, and a second VOI was placed in the periventricular white matter just superior to the lateral ventricles.
Out-of-field-of-view saturation bands were routinely placed in all MR spectroscopy examinations. Automatic prescanning was performed twice before each spectroscopic scan to assure adequate water suppression of 99% and acceptable full width half maximum values (<12).
MR spectroscopy was performed after intravenous contrast administration in all subjects. Contrast administration was part of the anatomic imaging protocol evaluating for potential pathologic enhancement as well as being part of an MR perfusion sequence. MR spectroscopy was the last sequence in the entire imaging protocol.
Imaging Postprocessing and Analysis
Conventional MR images were interpreted by a neuroradiology attending physician for safety reasons. These were specifically evaluated for brain volume loss, abnormal signal intensity, abnormal contrast enhancement, abnormal diffusion, presence of hemorrhage or mineralization, and any additional abnormalities.
All spectral postprocessing was performed on an Advantage Windows workstation equipped with the FuncTool 2000 software (GE Healthcare).
Postprocessing involved systematically placing multiple 1 × 1 × 1-cm voxels in a number of gray and white matter regions that have been implicated in pain processing. These voxels were positioned within the 2 greater VOIs selected at the levels of the basal ganglia and centrum semiovale. Specifically, a total of 8 voxels were placed within the VOI centered at the basal ganglia. These were positioned in the insula, thalamus, putamen, and caudate nuclei bilaterally. The exact locations of the voxels are best illustrated in Fig 1A. A total of 8 voxels were also placed within the VOI centered at the centrum semiovale. These were positioned in the DLPFC, the posterior frontal white matter, and the parietal white matter bilaterally. The exact locations of these voxels are best illustrated in Fig 1B. Voxel placement areas were chosen a priori because of known involvement in pain transmission or because they had shown abnormalities in previous neuroimaging studies of pain.
Fig 1.

Images illustrating voxel placement at the level of the basal ganglia (A) with corresponding spectra (B) and the centrum semiovale (C), also with corresponding spectra (D).
The signal intensity of various metabolite peaks was evaluated in every voxel; integrals of the area under each peak were used as a measure of its intensity. The integration limits of the respective peaks were manually defined by the same neuroradiologist before computerized calculations.24 For calculations of metabolite ratios, metabolite intensities in the same voxel were used. The spectra were analyzed for the signal intensity of NAA, choline (Cho), and creatine (Cr) and were assessed for the presence of lactates and lipids. NAA/Cr, Cho/Cr, and NAA/Cho ratios were calculated for each voxel.
Given the long TE (144 ms) used to collect the data, the baseline of the spectrum was fairly flat because of the lack of macromolecule contamination. Therefore, we did not subtract the spectrum baseline from the peak integration. The mean signal-to-noise ratio of Cr and Cho was estimated as 15:20, and the noise was defined as root-mean-square of the values between 0.5 ppm and 1.0 ppm in the spectrum. No threshold was used in the calculations of the present data.
Statistical Analysis
A repeated-measures analysis of variance (ANOVA) was used to assess the effect of brain location, group (FM vs HC), and group-location interaction on mean metabolite ratios as well as metabolite ratio variability. For each of the 3 metabolite ratios as outcome, fixed effects of group, location, and group-location interaction were used as factors in the model. To account for the clustering effect, an unstructured variance-covariance pattern is assumed for the observations on the same subject. Because of the heterogeneity across groups (see below), we allowed for different variance-covariance pattern across groups, thereby assuming a quite flexible modeling framework. We adjusted metabolite ratio comparisons between groups for each location for multiple comparisons using a Bonferroni correction.
To analyze the ratio variability, for each location within each group, we calculated the absolute deviations of the observations from their respective means. These deviations were then analyzed under the framework of repeated-measures ANOVA as described in the previous paragraph. Because the absolute deviations from the mean roughly estimate a scale multiple of the SD, this approach is deemed as a reasonable one to analyze the variability, as it represents an adaptation of Levene's25 method of testing homogeneity of variance under the usual ANOVA framework.
Results
Conventional structural MR imaging results were normal for all subjects included in the study, except for a right cavernous carotid aneurysm found in one of the HC, which was reported to the patient's primary physician and subsequently treated without complications.
Spectra of good quality were achieved in all cases. No lactate/lipid peaks were present in any of the spectral sets.
There was a significant effect of brain location for all 3 mean metabolite ratios with P values of less than .0001 for each ratio. The effects of group and group-location interaction on mean metabolite ratios were not found to be significant for any of the metabolites. Mean metabolite ratios for the different brain regions in patients with FM and HC are shown in the on-line Tables 1 to 3.
Brain location was found to have significant main effect on variability in NAA/Cr (P < .0001), whereas neither group nor group-location interaction was significant (P > .05). Brain location was also found to have a significant effect on variability in Cho/Cr ratios with significantly more variability noted in the right and left caudate (P < .05).
A significant group-location interaction was detected for Cho/Cr variability (P = .0025). Greater variation in Cho/Cr was detected the right DLPFC in the FM group compared with that of the control group (P = .01 adjusted for multiple comparisons; FM estimate, 0.288; HC estimate, 0.116). The left caudate also displayed slightly higher variability in the patients, though not statistically significant.
The distribution of Cho/Cr in the right DLPFC in patients with FM and HC is depicted in Fig 2A. To investigate whether there may be shared abnormalities in the 2 regions that differed between patients with FM and controls (ie, the right DLPFC and left caudate), we examined the correlation between Cho/Cr in these 2 regions in the FM and control groups (Fig 2B). A significant correlation between the Cho/Cr ratios in these regions was detected within the FM group (r = 0.468; P < .05) but not among HC (r = 0.018; P > .05).
Fig 2.

Graphs showing the distribution of Cho/Cr ratios in the right DLPFC in patients with FM and HC (A) as well as the correlations between Cho/Cr ratios in the right DLPFC and left caudate nucleus for patients and controls (B).
To examine the relationship between FM specific spectroscopy findings and pain report, we made correlations between Cho/Cr levels in the right DLPFC and clinical pain in the patients. A positive correlation was detected with greater Cho/Cr levels tracking with greater pain (r = 0.603; P = .02; Fig 3A).
Fig 3.
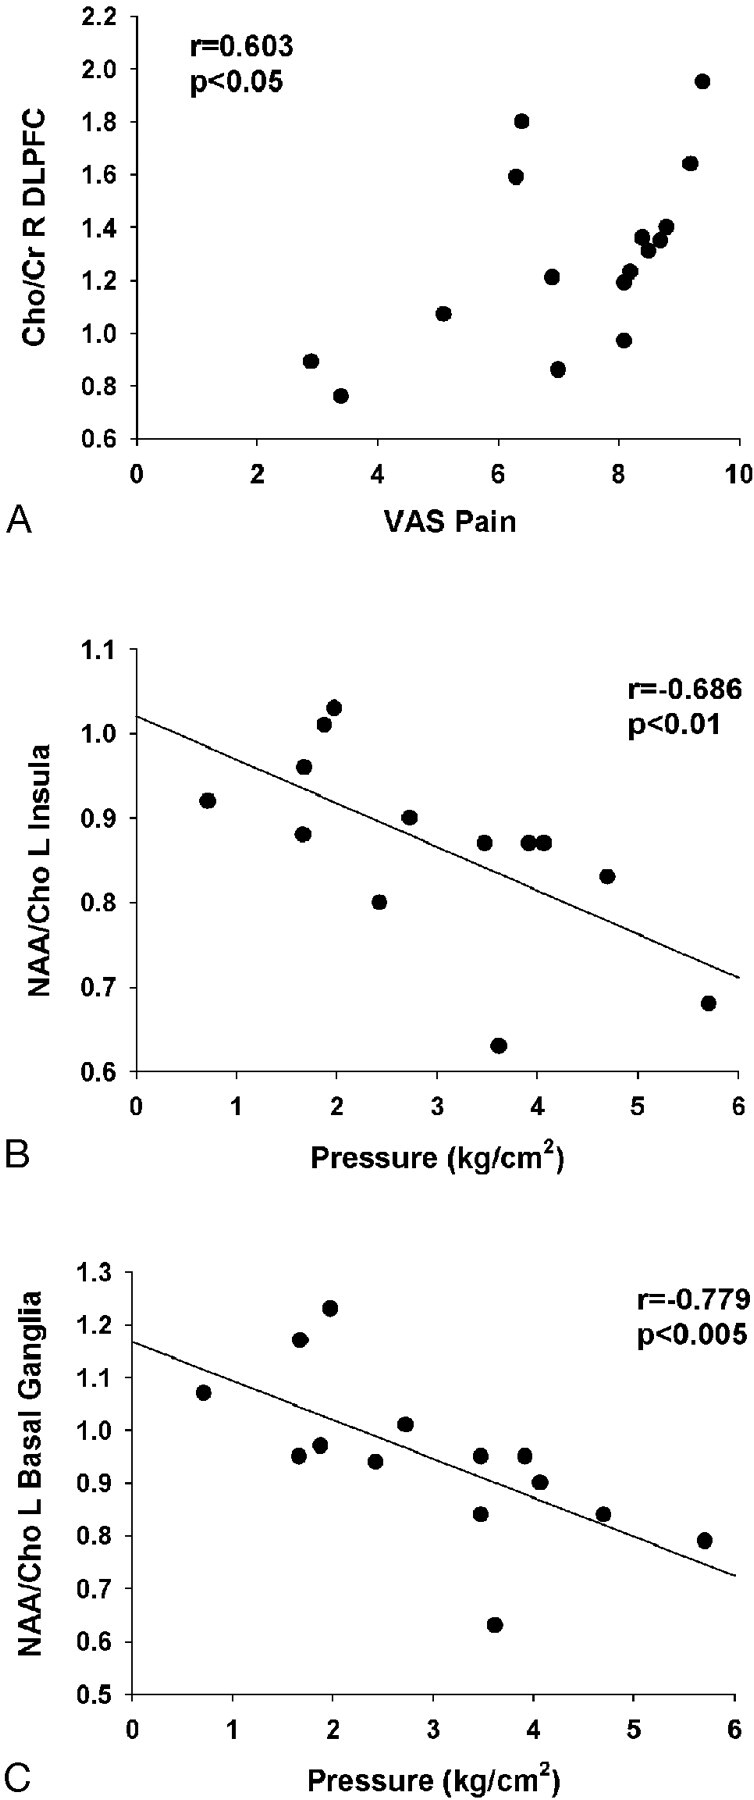
Significant correlations between metabolite ratios and clinical symptoms. Correlations between Cho/Cr ratios in the right DLPFC and clinical pain scores on the visual analog scale (VAS) are shown in A. Correlations between evoked pain thresholds and NAA/Cho ratios in the left insula and left basal ganglia are shown in B and C, respectively.
This ratio was not associated with evoked pain threshold (r = 0.20; P = .557). Evoked pain threshold did exhibit correlations with NAA/Cho ratios in the left insula and left basal ganglia, as shown in Fig 3B and 3C.
Given the high prevalence of depression among patients with chronic pain,26 correlations between depression and anxiety scores and Cho/Cr ratios in the right DLPFC were assessed. There was a nonsignificant correlation between CES-D scores and Cho/Cr ratios in the right DLPFC (r = 0.437; P = .14). Adding CES-score as one of the covariates in a multiple regression model with clinical pain scores on the VAS as the independent variable and Cho/Cr ratio as the dependent variable results in attenuation of the clinical pain score coefficient. However, the trend is maintained (b = 0.109; P = .04 without including CES-D scores, b = 0.095; P = .11 after including CESD-scores in the model). No such effect was noted for anxiety scores. Depression and anxiety scores did not affect the relationship between NAA/Cho and evoked pressure pain in the left insula and basal ganglia.
Discussion
Many studies have suggested that the widespread pain sensitivity in FM is caused by a CNS-based problem in pain processing. Our study results also indicate that there may be baseline alterations in brain metabolites in this condition. Although there were no apparent differences in the mean metabolite ratios for each brain location between patients and controls, the spread or variability in Cho/Cr ratios was markedly different in several regions in the FM group, namely in the right DLPFC and, to a lesser extent, the left caudate nucleus. This variability in Cho/Cr levels within the patient group appeared to be a “widespread” phenomenon, because those with low levels in 1 brain region typically had low levels in the other, and vice versa, whereas no such association was seen within controls. Finally, the level of Cho/Cr in the right DLPFC correlated significantly with the patient's pain level at the time of the study, suggesting that the covariation in this biologic marker relates to a relevant clinical parameter.
The concentration of Cho is felt to reflect cellular attenuation or total membrane content, or both. The Cho molecules that are detected in 1H-MR spectra are largely from phosphorylcholine and glycerophosphorylcholine, which are precursors to cell membrane biosynthesis and breakdown, respectively.27–29 An increased Cho/Cr ratio could potentially be an indicator of several cellular processes. For example, it could reflect active demyelination that may be too early or too subtle to detect on anatomic imaging; elevated Cho/Cr levels have been demonstrated in the context of active demyelination or ongoing gliosis in patients with multiple sclerosis.30,31 Elevated Cho/Cr levels can also be seen in malignant neoplasms32–36 as well as in the context of CNS infection37–39 or inflammatory conditions such as neuropsychiatric lupus erythematosus.40–44 Although neither demyelination nor malignant neoplasms are likely to be the cause of these abnormalities in FM, changes in Cho/Cr levels (though nonspecific) do provide a sensitive indication of altered brain metabolic activity. The exact pathophysiology that could explain altered Cho/Cr levels in FM is unclear. Given its nonspecific nature, the finding could potentially reflect a secondary effect of other primary metabolite or physiologic alterations that were not assessed in our study.
That the Cho/Cr ratio in the DLPFC is associated with clinical pain levels strengthens the likelihood that this finding is of pathophysiologic significance in FM. The increased variability in Cho/Cr ratios within patients may reflect heterogeneity in the underlying disease process or in symptom presentation among our cohort of patients. The strong correlation we observed between Cho/Cr levels in the right DLPFC and caudate in patients, but not in CS, also suggests a shared dysfunction across multiple brain regions in the patient group.
We also detected strong correlations between NAA/Cho levels in the insula and basal ganglia, and evoked pressure pain sensitivity. Previous studies have suggested that the insula is very important in pain processing, as well as in overall sensory integration.45 Again, the exact pathophysiology underlying these findings is uncertain but is consistent with the Cho levels being, in some way, indicative of the ongoing disease process in FM, as well as the presence of altered NAA levels in the setting of chronic pain.16
The main strength of our study was the novel approach to the study of patients with FM and to noninvasively attempt to obtain an insight into brain metabolism in this condition using 1H-MR spectroscopy. Brain 1H-MR spectroscopy in the context of FM has not been reported previously in the literature. The use of 2D-CSI 1H-MR spectroscopy as opposed to single-voxel methods allows us to simultaneously assess a greater number or brain regions in this pilot study.
Our study had several limitations. Although the number of subjects included in the study is comparable or larger than other studies investigating FM with functional neuroimaging techniques, it may still be a small number of subjects when looking for subtle differences between groups. This may explain the lack of significant differences between groups for mean metabolite levels. A small sample size can be limiting when one considers the heterogeneity in clinical presentation of the patient group, length of disease, differential treatment regimens as well as comorbidities that can be associated with FM such as depression, which, as we have shown, can interfere with spectroscopic parameters. Our study used a 1.5T MR unit; higher field strengths such as 3T could provide greater peak resolution and therefore can be more sensitive when looking for subtle differences between groups.
We also acknowledge that it is impossible to distinguish between cause and effect in the metabolic profiles observed here, given the cross-sectional nature of the study. We do, however, feel that the data from this novel study suggest the presence of altered baseline metabolic activity in a number of brain regions in patients with FM. Additional studies could explore metabolic and physiologic changes in the regions showing baseline metabolic alterations in this initial pilot study with use of more focused spectroscopic techniques, a dynamic setting in which subjects are challenged with a painful stimulus and looking at other, perhaps more specific metabolites implicated in pain processing such as glutamate. Therefore, the results of our study do provide a good foundation for further investigation of pathophysiology of FM and potential response to treatment with use of MR spectroscopic techniques.
Conclusion
No baseline differences in standard mean metabolite ratios obtained in a number of predefined regions thought to be involved in pain processing were detected between patients with FM and HC. Significant differences were detected in the variability of these ratios for some of these regions between patients and controls. Furthermore, significant correlations between metabolite ratios showing differential variability and clinical presentation parameters were detected.
Supplementary Material
Acknowledgments
We acknowledge the support of Laura Mayo-Bond, the study coordinator for this study and Suzan Rohrer, BA RT(B)(MR) for performing the MR examinations.
Footnotes
This study was in part supported by Department of the Army grant DAMD 17/002-0018.
Paper previously presented in part at: Annual Meetings of the European Congress of Radiology, March 3–7, 2006, Vienna, Austria; and the American Society of Neuroradiology, April 29–May 5, 2006, San Diego, Calif.
Indicates article with supplemental on-line tables.
References
- 1.Wolfe F, Ross K, Anderson J, et al. The prevalence and characteristics of fibromyalgia in the general population. Arthritis Rheum 1995;38:19–28 [DOI] [PubMed] [Google Scholar]
- 2.Lautenbacher S, Rollman GB, McCain GA. Multi-method assessment of experimental and clinical pain in patients with fibromyalgia. Pain 1994;59:45–53 [DOI] [PubMed] [Google Scholar]
- 3.Kosek E, Hansson P. Modulatory influence on somatosensory perception from vibration and heterotopic noxious conditioning stimulation (HNCS) in fibromyalgia patients and healthy subjects. Pain 1997;70:41–51 [DOI] [PubMed] [Google Scholar]
- 4.Petzke F, Clauw DJ, Ambrose K, et al. Increased pain sensitivity in fibromyalgia: effects of stimulus type and mode of presentation. Pain 2003;105:403–13 [DOI] [PubMed] [Google Scholar]
- 5.Arroyo JF, Cohen ML. Abnormal responses to electrocutaneous stimulation in fibromyalgia. J Rheumatol 1993;20:1925–31 [PubMed] [Google Scholar]
- 6.Lorenz J. Hyperalgesia or hypervigilance? An evoked potential approach to the study of fibromyalgia syndrome. Z Rheumatol 1998;57 Suppl 2:19–22 [DOI] [PubMed] [Google Scholar]
- 7.Jones AK, Brown WD, Friston KJ, et al. Cortical and subcortical localization of response to pain in man using positron emission tomography. Proc R Soc Lond B Biol Sci 1991;244:39–44 [DOI] [PubMed] [Google Scholar]
- 8.Derbyshire SW. Imaging the brain in pain. American Pain Society (APS) Bulletin 1999;9[3]:7–8 [Google Scholar]
- 9.Aziz Q, Thompson DG, Ng VW, et al. Cortical processing of human somatic and visceral sensation. J Neuroscience 2000;20:2657–63 [DOI] [PMC free article] [PubMed] [Google Scholar]
- 10.Mountz JM, Bradley LA, Modell JG, et al. Fibromyalgia in women. Abnormalities of regional cerebral blood flow in the thalamus and the caudate nucleus are associated with low pain threshold levels. Arthritis Rheum 1995;38:926–38 [DOI] [PubMed] [Google Scholar]
- 11.Kwiatek R, Barnden L, Tedman R, et al. Regional cerebral blood flow in fibromyalgia: single-photon-emission computed tomography evidence of reduction in the pontine tegmentum and thalami. Arthritis Rheum 2000;43:2823–33 [DOI] [PubMed] [Google Scholar]
- 12.Gracely RH, Petzke F, Wolf JM, et al. Functional magnetic resonance imaging evidence of augmented pain processing in fibromyalgia. Arthritis Rheum 2002;46:1333–43 [DOI] [PubMed] [Google Scholar]
- 13.Cook DB, Lange G, Ciccone DS, et al. Functional imaging of pain in patients with primary fibromyalgia. J Rheumatol 2004;31:364–78 [PubMed] [Google Scholar]
- 14.Giesecke T, Gracely RH, Grant MA, et al. Evidence of augmented central pain processing in idiopathic chronic low back pain. Arthritis Rheum 2004;50:613–23 [DOI] [PubMed] [Google Scholar]
- 15.Ross AJ, Sachdev PS. Magnetic resonance spectroscopy in cognitive research. Brain Res Brain Res Rev 2004;44:83–102 [DOI] [PubMed] [Google Scholar]
- 16.Grachev ID, Fredrickson BE, Apkarian AV. Abnormal brain chemistry in chronic back pain: an in vivo proton magnetic resonance spectroscopy study. Pain 2000;89:7–18 [DOI] [PubMed] [Google Scholar]
- 17.Wolfe F, Smythe HA, Yunus MB, et al. The American College of Rheumatology 1990 Criteria for the Classification of Fibromyalgia. Report of the Multicenter Criteria Committee. Arthritis Rheum 1990;33:160–72 [DOI] [PubMed] [Google Scholar]
- 18.Petzke F, Khine A, Williams D, et al. Dolorimetry performed at 3 paired tender points highly predicts overall tenderness. J Rheumatol 2001;28:2568–69 [PubMed] [Google Scholar]
- 19.Petzke F, Harris RE, Williams DA, et al. Differences in unpleasantness induced by experimental pressure between patients with fibromyalgia and controls. Eur J Pain 2005;9:325–35 [DOI] [PubMed] [Google Scholar]
- 20.Gracely RH, Lota L, Walter DJ, et al. A multiple random staircase method of psychophysical pain assessment. Pain 1988;32:55–63 [DOI] [PubMed] [Google Scholar]
- 21.Radloff LS. The CES-D scale: a self-report depression scale for research in the general population. Applied Psychological Measurement 1977;1:385–401 [Google Scholar]
- 22.Spielberger CD, Gorsuch RC, Lushene RE, et al. Manual for the State-Trait Anxiety Inventory (Form Y): “Self-evaluation questionnaire.” Palo Alto, Calif: Consulting Psychologists;1983. :36
- 23.Rosenstiel AK, Keefe FJ. The use of coping strategies in chronic low back pain patients: relationship to patient characteristics and current adjustment. Pain 1983;17:33–44 [DOI] [PubMed] [Google Scholar]
- 24.Petrou M, Sundgren PC, Pang Y, et al. Manually adjusted versus vendor preset definition of metabolite boundaries: impact on proton metabolite ratios. Acad Radiol 2007;14:340–43 [DOI] [PubMed] [Google Scholar]
- 25.I. Olkin, ed. Contributions to Probability and Statistics: Essays in Honor of Harold Hotelling. Stanford, Calif: Stanford University Press;1960. :278–92
- 26.Giesecke T, Gracely RH, Williams DA, et al. The relationship between depression, clinical pain, and experimental pain in a chronic pain cohort. Arthritis Rheum 2005;52:1577–84 [DOI] [PubMed] [Google Scholar]
- 27.Castillo M, Kwock L, Mukherji SK. Clinical applications of proton MR spectroscopy. AJNR Am J Neuroradiol 1998;17:1–15 [PMC free article] [PubMed] [Google Scholar]
- 28.Maheshwari SR, Fatterpekar GM, Castillo M, et al. Proton MR spectroscopy of the brain. Semin Ultrasound CT MR 2000;21:434–51 [DOI] [PubMed] [Google Scholar]
- 29.Burtscher IM, Holtas S. Proton MR spectroscopy in clinical routine. J Magn Reson Imaging 2001;13:560–67 [DOI] [PubMed] [Google Scholar]
- 30.Bitsch A, Bruhn H, Vougioukas, V, et al. Inflammatory CNS demyelination: histopathologic correlation with in vivo quantitative proton MR spectroscopy. AJNR Am J Neuroradiol 1999;20:1619–27 [PMC free article] [PubMed] [Google Scholar]
- 31.Tartaglia MC, Narayanan S, De Stefano N, et al. Choline is increased in pre-lesional normal appearing white matter in multiple sclerosis. J Neurol 2002;249:1382–90 [DOI] [PubMed] [Google Scholar]
- 32.Burtscher IM, Holtas S. Proton MR spectroscopy in brain tumors: clinical applications. Neuroradiology 2001;43:345–52 [DOI] [PubMed] [Google Scholar]
- 33.Bruhn H, Frahm J, Gungel MJ, et al. Noninvasive differentiation of tumors with the use of localized H-1 MR spectroscopy in vivo: initial experience in patients with cerebral tumors. Radiology 1989;172:541–48 [DOI] [PubMed] [Google Scholar]
- 34.Moller-Hartmann W, Herminghaus S, Krings T, et al. Clinical applications of proton magnetic resonance spectroscopy in the diagnosis of intracranial mass lesions. Neuroradiology 2002;44:371–81 [DOI] [PubMed] [Google Scholar]
- 35.Herminghaus S, Dierks T, Pilatus U, et al. Determination of histopathological tumor grade in neuroepithelial brain tumors by using spectral pattern analysis of in vivo spectroscopic data. J Neurosurg 2003;98:74–81 [DOI] [PubMed] [Google Scholar]
- 36.Weybright P, Sundgren PC, Maly P, et al. Differentiation between brain tumor recurrence and radiation injury using MR spectroscopy. AJR Am J Roentgenol 2005;185:1471–76 [DOI] [PubMed] [Google Scholar]
- 37.Laubenberger J, Haussinger D, Bayer S, et al. HIV-related metabolic abnormalities in the brain: depiction with proton MR spectroscopy with short echo times. Radiology 1996;199:805–10 [DOI] [PubMed] [Google Scholar]
- 38.Chang L, Ernst T. MR spectroscopy and diffusion-weighted MR imaging in focal brain lesions in AIDS. Neuroimaging Clin N Am 1997;7:409–26 [PubMed] [Google Scholar]
- 39.Meyerhoff DJ, Bloomer C, Cardenas V, et al. Elevated subcortical choline metabolites in cognitively and clinically asymptomatic HIV+ patients. Neurology 1999;52:995–1003 [DOI] [PubMed] [Google Scholar]
- 40.Brooks WM, Sabet A, Sibbitt WL Jr., et al. Neurochemistry of brain lesions determined by spectroscopic imaging in systemic lupus erythematosus. J Rheumatol 1997;24:2323–29 [PubMed] [Google Scholar]
- 41.Sibbit WL Jr, Haseler LJ, Griffey RR, et al. Neurometabolism of active neuropsychiatric lupus determined with proton MR spectroscopy. AJNR Am J Neuroradiol 1997;18:1271–77 [PMC free article] [PubMed] [Google Scholar]
- 42.Lim MK, Suh CH, Kim HJ, et al. Systemic lupus erythematosus: brain magnetic resonance imaging and single voxel hydrogen1 MR spectroscopy. Radiology 2000;217:43–09 [DOI] [PubMed] [Google Scholar]
- 43.Axford JS, Howe FA, Heron C, et al. Sensitivity of quantitative(1)H magnetic resonance spectroscopy of the brain in detecting early neuronal damage in systemic lupus erythematosus. Ann Rheum Dis 2001;60:106–11 [DOI] [PMC free article] [PubMed] [Google Scholar]
- 44.Sundgren PC, Jennings J, Attwood JT, et al. MRI and 2D-CSI MR spectroscopy of the brain in the evaluation of patients with acute onset of neuropsychiatric systemic lupus erythematosus. Neuroradiology 2005;47:576–85 [DOI] [PubMed] [Google Scholar]
- 45.Augustine JR. Circuitry and functional aspects of the insular lobe in primates including humans. Brain Res Brain Res Rev 1996;22:229–44 [DOI] [PubMed] [Google Scholar]
Associated Data
This section collects any data citations, data availability statements, or supplementary materials included in this article.