Abstract
Objective: To research the effects of Aricept on the intestinal flora in patients with mild Alzheimer’s disease (AD) and explore the relationship between the improvement from Aricept on AD and the changes in intestinal flora. Methods: One month after Aricept treatment, DNA was extracted from stool samples of patients and the quality of DNA was detected. Then, the library was constructed, quantified, pooled and the quality of the library was checked. Sequencing was conducted using the Miseq sequencer and the related results were analyzed by bioinformatics. Results: The overall structure of intestinal flora in AD patients was largely changed after Aricept treatment (P<0.05), which was mainly shown as decreased abundance of Firmicutes, Proteobacteria, actinobacteria and fusobacteria, and increased abundance of Bacteroidetes. The average abundance of intestinal flora in lipid metabolism pathwa was also different before and after treatment (P<0.05). The function of target receptor molecules in the Aricept drug target network mainly targets G-protein coupled receptors; biological processes in energy metabolism; and biological pathways mostly target proteoglycans. Conclusion: The occurrence and progression of AD are closely related to abnormal changes in intestinal flora structure. Bile acids may improve the symptoms of mild AD by changing the intestinal flora through lipid energy metabolism. In other words, Bile acids regulate the activity of the host nervous system through intestinal flora regulation. Intestinal flora maintains the homeostasis of bile acid and further affects the physiological and pathological processes of the host. The analysis of AD related flora structure pattern helps to understand the molecular pathological basis of AD and provides theoretical basis for the development and design of innovative drugs for AD.
Keywords: Alzheimer’s disease, 16S rRNA, sequencing, intestinal flora, Aricept
Introduction
Alzheimer’s disease (AD) is a degenerative disease of the central nervous system, which often occurs in the elderly. It not only endangers the health of the elderly, but AD also brings heavy mental and economic burden to families. By 2019, AD has gradually become the fifth leading cause of death in China and the related social burden is increased with the acceleration of aging. Currently, there are many hypotheses about the pathogenesis of AD, such as inflammation, amyloid deposition, abnormal phosphorylation of tau proteins, cholinergic hypothesis, oxidative stress reactions and apoptosis theory etc. [1,2]. There are also many drugs for the treatment of AD, such as donepezil and Aricept etc. [3,4].
Mild dementia is commonly seen in clinical practice. As the first drug covering the whole range of mild, moderate and severe AD in China, Aricept has achieved good clinical effects. However, the specific pharmacological mechanisms of Aricept are still unclear. More and more evidence shows the relevance between intestinal microorganisms and the central nervous system (CNS) [5,6]. As a drug target for AD, the further study of intestinal flora may provide a methods for the treatment of AD.
In our present study, the effects of Aricept on the intestinal flora of patients with mild AD and the related possible pharmacological mechanisms were explored. Stool samples were acquired from 12 patients with mild AD who were selected as the research subjects, including samples before and after one month of continuous administration of Aricept. The diversity of the V3 region of 16S rRNA gene was detected by MiSeq sequencer and the changes of intestinal flora structure in AD patients were revealed [7,8]. The related study is as follows.
Materials and methods
Research subjects
This is a prospective study. A total of 12 patients with mild AD, including 5 females and 7 males with an average age of (84.4±3.2) years old, who were diagnosed in Tongde Hospital of Zhejiang Province during January 2018 to September 2019 were selected. All subjects were hospitalized for the first occurrence of AD symptoms without any treatment before sampling, and they were screened according to the inclusion criteria. All the subjects signed the informed consent, and the project was also approved by the Ethics Committee of Tongde Hospital of Zhejiang Province.
Inclusion criteria
1) All the selected subjects met the AD diagnostic criteria formulated by the latest diagnostic criteria for Alzheimer’s disease in 2011 [9].
2) Aged between 60-90 years old.
3) Without operation history in the past two years, and no antibiotics or probiotics were used one month before the stool samples were collected; all selected patients were admitted to the hospital for the first time, and had not received any treatment before sampling.
4) No high-fat food intake within 5 days. All the subjects had good compliance with little potential bias. A minimum of 30 days of treatment was guaranteed according to the treatment course. During this period, the diet was regular and high-fat foods were forbidden. Patients were selected from the city in Zhejiang Province to avoid any deviation caused by the differences between urban and rural life.
Exclusion criteria
1) Patients with cancer and hematological malignancies; 2) Patients with renal insufficiency, liver cirrhosis or abnormal blood glucose and obese patients with excessive body mass index (BMI); 3) Patients with bad habits such as smoking, drinking, unbalanced diet etc.; such that the influence of external factors on the later microbial analysis could be strictly controlled.
Methods
Main equipment and materials
Drug name: Aricept, manufacturer: Weicai (China) Pharmaceutical Co., Ltd., China; dosage: once a day, one tablet at a time, 5 mg/day.
Main equipment: NanoDrop 2000 (manufacturer: Thermo Fisher Scientific, USA), Invitrogen Qubit 3.0 Spectrophotometer (manufacturer: Thermo Fisher Scientific, USA), Agilent 2100 bioanalyzer (manufacturer: Agilent Technologies, USA), Illumina MiSeq Benchtop Sequencer (manufacturer: Illumina, USA), ABI 2720 Thermal Cycler (manufacturer: Thermo Fisher Scientific, USA), Eppendorf 5810R Centrifuge (manufacturer: Eppendorf, H burg, Germany).
Main reagents: MiSeq Reagent Kit v3 (Illumina, USA), AgencourtAMPureXPPCR Purification Beads (Beckman Coulter, USA), TopTaq DNA Polymerase kit (Transgen, China).
Administration plan and sampling
The protocol was a self-controlled trial with the comparison before and after the medication. Twelve stool samples in each group before and after drug administration were compared. Aricept was used 5 mg/day, once a day. Two batches of samples were taken before and a month after the treatment, respectively. During the whole treatment period, a reasonable dietary structure was maintained and antibiotics were forbidden.
Sampling method: Urine was drained firstly to avoid contamination; then a fresh stool sample from patients were kept in aseptic cryopreservation tubes (the middle section of stool samples was taken; and the inside of the stool was taken; liquid stools could not be used as the sample); 3-10 g of the middle inside part of the sample was put into the aseptic cryopreservation tube using a sterile spoon. Outside of the stool was not be taken as sample because of external pollution and partly degraded bacterial DNA due to air exposure; next, the aseptic cryopreservation tubes containing the stool samples were put into the -40°C freezer immediately.
Genomic DNA quality detection, amplification, library construction and sequencing of stool samples
Genomic DNA quality detection
High quality and integrity genomic DNA was the premise of the Library construction and amplification.
The extracted genomic DNA was detected as follows: a) The integrity of DNA was detected by agarose gel electrophoresis: the electrophoresis strip was clearly visible without obvious degradation; b) DNA quality was detected using Nanodrop 2000: concentration ≥20 ng/μL, total amount ≥500 ng, OD260/280 = 1.8~2.0.
The target region was detected and amplified (e.g., Amplification of V3V4 Region)
The qualified sample detection area was amplified by high fidelity PCR in triplicate. The standard bacterial/fungal genomic DNA mixture was used as the positive control. The amplification primers were determined according to the selected detection region.
Agarose gel electrophoresis was used to detect whether the amplified products were single and specific. Three parallel amplification products of the same sample were mixed, and the same volume of AgencourtAMpure XP Magnetic beads for nucleic acid purification (Beckman Coulter, USA) was added to each sample to purify the product.
Added Sample-specific index sequence
The specific Index sequence was inserted into the end of the library through high fidelity PCR using primers with Index sequence. The amplified products were detected by agarose gel electrophoresis and purified using nucleic acid purified magnetic beads. Then, the original library of the sample was obtained.
Library quantification and pooling
The concentration of the sample library with specific Index tags was appropriately diluted according to the preliminary quantitative results of agarose gel electrophoresis. Subsequently, the library was quantified accurately using Qubit. The samples were mixed in corresponding proportion (mole ratio) according to the sequencing flux requirements of different samples.
Library quality check
The size of the inserted fragments in the mixed library samples was detected by Agilent 2100 Bioanalyzer. To ensure that there was no non-specific amplification between 120-200 bp, and the concentration of the sequencing library was quantified accurately.
Sequencing on Miseq
The library was sequenced through Miseq platform and the 2×250 bp double ended sequencing strategy. Further bioinformatics analysis was also carried out.
Bioinformatics analysis of sequencing results
According to the tag sequences in the sequencing results, the sequences of different samples were distinguished and the corresponding library was established. The CD-HIT software without redundant sequences was used for cluster analysis, and the operational taxonomic units (OTUs) in each library were analyzed accordingly [10]. The samples were sequenced by Miseq sequencer and bioinformatics analysis platform, and the distribution of intestinal flora was finally obtained. Bioinformatics analysis includes Alpha diversity analysis, β diversity analysis, microbial metabolic pathway analysis, GO (gene ontology) analysis, drug target network analysis and so on.
Wilcoxon rank sum test was used for the comparison between groups (two groups of samples). P value <0.05 was used as the screening threshold of significant difference. At the same time, Bonferroni test and False Discovery Rate (fdr) were used to perform Multiple Hypothesis Testing on the P values to evaluate whether there was significant difference between groups.
Results
Classification analysis of species
A total of 24 samples were included in this study, including 12 samples before and 12 samples after the treatment.
In terms of phylum level, there are 257 genera of bacteria belonging to 19 phyla in the intestinal tract of Chinese population. Firmicute (blue), Proteobacteria (yellow), Bacteroidetes (pink) and Actinobacteria (purple) were the most dominant, accounting for more than 90% of the total intestinal bacteria. Relative abundance distribution at phylum level is shown in Figure 1. After treatment (AT group), relative abundance of Bacteroides was increased and the abundance of Firmicutes was decreased.
Figure 1.
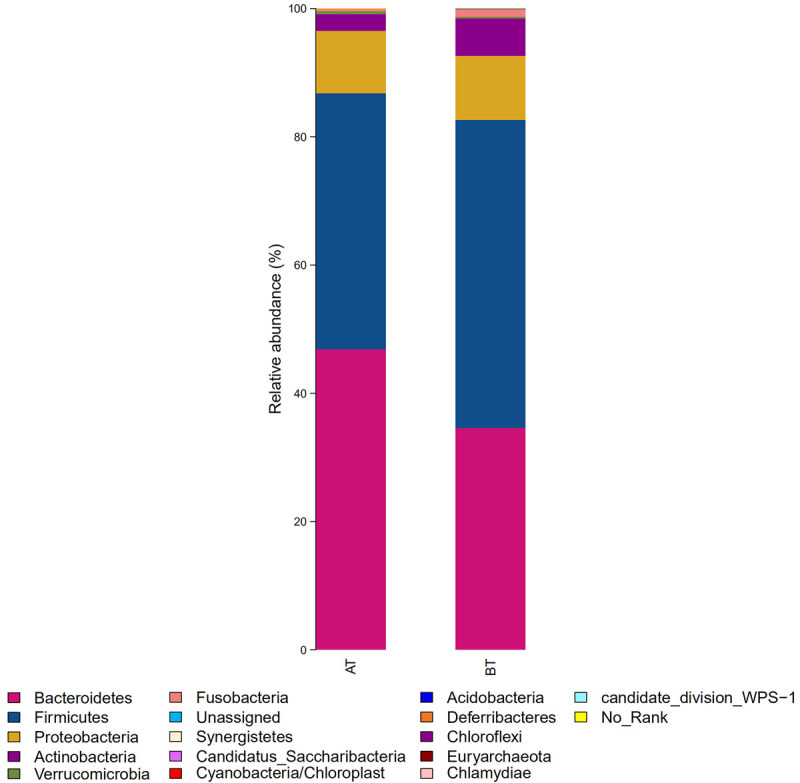
Relative abundance distribution at phylum level in two groups of samples. BT: before treatment; AT: after treatment.
In terms of genus level, all sequences were divided into 1003 operational taxonomic units (OTUs) according to 97% similarity level. The diversity composition of intestinal flora in the two groups showed differences at the genus level, as shown in Figure 2 and Table 1. Relative abundance of Sneathia was increased to a certain extent, while the relative abundance of other genera was decreased.
Figure 2.
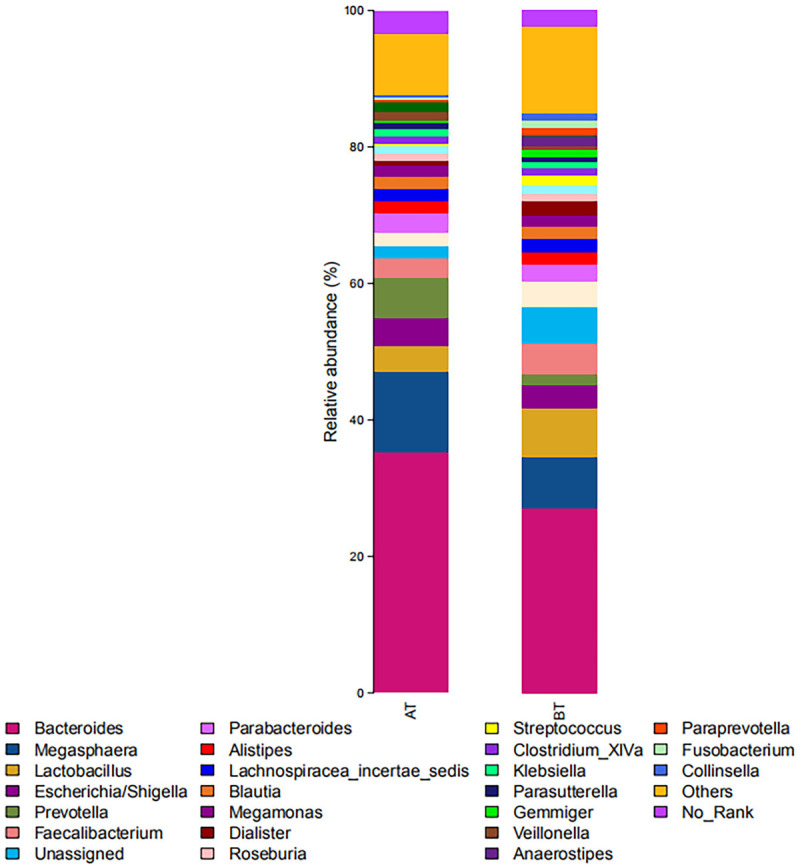
Relative abundance distribution at genus level in two groups of samples. BT: before treatment; AT: after treatment.
Table 1.
Genera with significant difference in relative abundance before and after the treatment
| Species classification at genus level | Mean abundance of before treatment | SD of before treatment | Mean abundance of after treatment | SD of after treatment | P-value |
|---|---|---|---|---|---|
| Actinobacteria > Kocuria | 8.00E-06 | 8.00E-06 | 0 | 0 | 0.031 |
| Firmicutes > Gemmiger | 0.012457 | 0.003689 | 0.003656 | 0.001332 | 0.031 |
| Fusobacteria > Sneathia | 3.00E-06 | 3.00E-06 | 1.60E-05 | 1.00E-05 | 0.022 |
| Proteobacteria > Methylophaga | 1.00E-05 | 1.00E-05 | 0 | 0 | 0.016 |
| Synergistetes > Fretibacterium | 1.40E-05 | 1.30E-05 | 1.00E-06 | 1.00E-06 | 0.012 |
| Proteobacteria > Pseudoalteromonas | 1.10E-05 | 1.10E-05 | 0 | 0 | 0.008 |
| Bacteroidetes > Phocaeicola | 2.70E-05 | 2.70E-05 | 0 | 0 | 0.001 |
Alpha diversity analysis before and after the treatment
Alpha diversity is mainly related to the number of species, i.e., richness, and biodiversity, i.e., the evenness of the individual distribution in the community. The indexes of community richness mainly include adaptive communication environment (ACE) index and Chao1 index. The indexes of community diversity mainly include Simpson index and Shannon index. The richness and diversity of community were both decreased through the treatment, but there existed no significant difference compared with that before administration (P>0.05). See Figure 3 for details.
Figure 3.
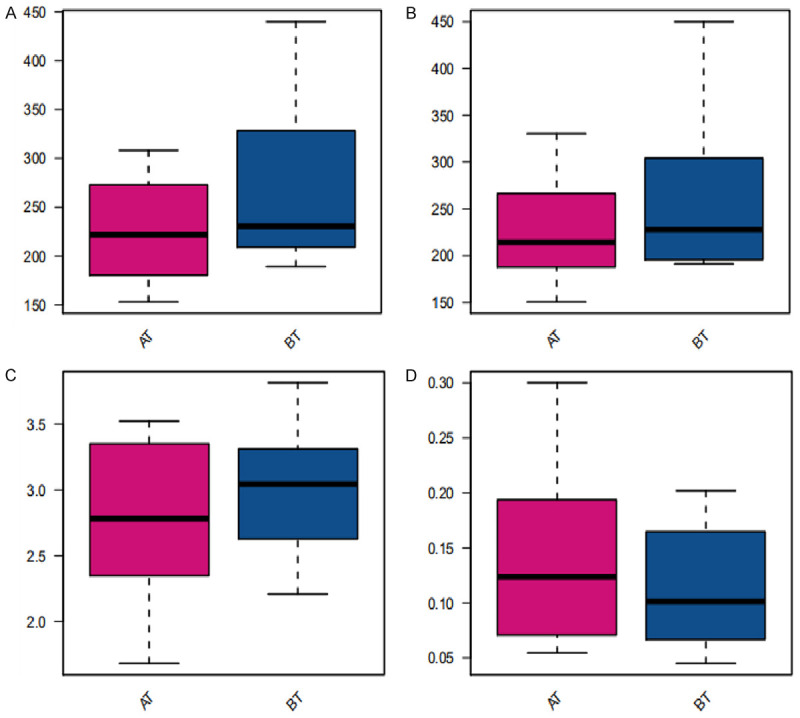
Alpha diversity analysis. A: Chao1 index (P value = 3.78e-01); B: ACE index (P value = 4.78e-01); C: Shannon index (P value = 4.1e-01); D: Simpson index (P value = 4.78e-01). BT: before treatment; AT: after treatment.
Beta diversity analysis before and after the treatment
Beta diversity is used to compare the diversity of different ecosystems, in other words, differences between samples. The evolutionary relationship and abundance information of each sample sequence were adopted by Beta diversity to calculate the distance between samples, which reflects whether there exist significant differences in microbial communities among samples (groups). In this study, partial least squares discriminant analysis (PLS-DA), i.e. partial least squares discriminant analysis, was used to distinguish and classify the samples before and after treatment [11]. See details in Figure 4. Beta diversity analysis focuses on the differences in microbial communities between the samples before and after treatment. The drug was demonstrated to have a clear impact on the bacterial flora if the two types of samples could be significantly distinguished. At the same time, there exists differences in the bacterial diversity between the two groups before and after treatment.
Figure 4.
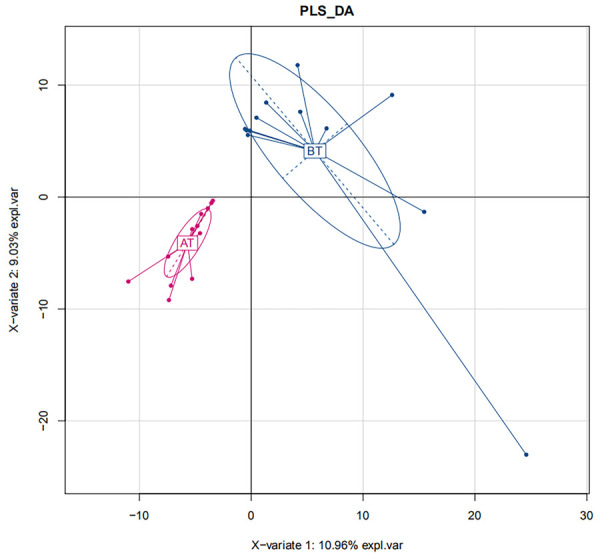
Beta diversity analysis. BT: before treatment; AT: after treatment.
The effects of Aricept and other drugs on intestinal flora
The composition of intestinal flora in AD patients before and after treatment of Aricept through the metagenomics 16S rRNA sequencing technology was analyzed. The results showed that Aricept had significant effects on the overall structure of intestinal flora in patients with AD, which was mainly manifested as decreased abundance of Firmicutes, Proteobacteria, Actinobacteria and Fusobacteria, and increased abundance of Bacteroidetes. Wang et al. firstly revealed that the change of intestinal flora in the process of AD had a certain correlation with infiltrated immune cells in the brain [12]. The 5XFAD transgenic mouse (TG) model was used in the study and the results exhibited significant change of the intestinal flora in TG mice during the progression of AD. The dynamic changes of intestinal flora in TG mice showed that the abundance of Bacteroides, Firmicutes and verrucomicrobia was the highest at the age of 2-3 months, which were 47.3%, 33.0% and 12.2%, respectively. However, at the age of 7-9 months, Firmicutes becomes the dominant intestinal flora with the abundance of 62.8%. These previous results indicate that the composition of intestinal flora in TG mice have changed significantly with the development of AD, and the increase of Firmicum may be a potential risk factor for AD progression. The results of this study showed that the abundance of Firmicum was decreased with the treatment. After treatment, relative abundance of Gemmiger in intestinal flora decreased significantly, and there existed significant difference before and after treatment (P<0.05; Figure 5), which was consistent with the results of Wang et al. [3]. Detection about the 16S rDNA of intestinal flora in AD mice was conducted by Zhang Yunlong et al. The results showed that the diversity of Firmicutes, Bacteroidetes, Proteobacteria and other bacteria in the intestinal tract of AD model mice was regulated by Jiedu Huayu Decoction, and the abundance of Firmicutes was decreased after treatment [13]. These above studies indicate that increased abundance of Firmicum may be closely related to the formation and development of AD, which also have a strong correlation with the distribution of intestinal flora [14]. Exploration from gutMDisorder database showed that the abundance of Proteobacteria and Sutterella in a rat AD model was increased, and the abundance of Desulfovibrionaceae and Helicobacteraceae was also increased after fructooligosaccharide intervention [15-17].
Figure 5.
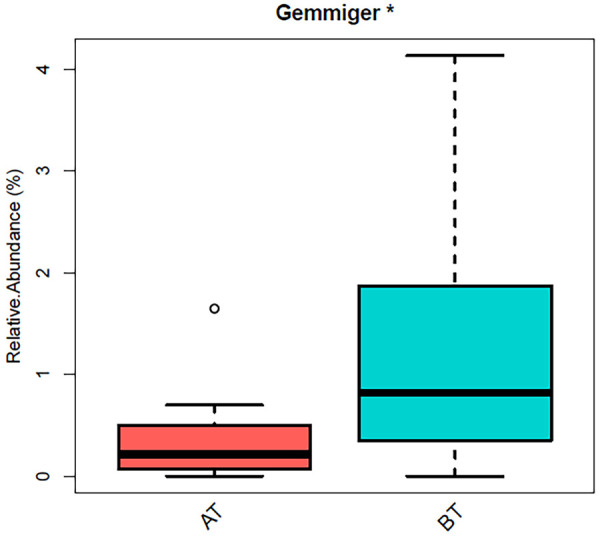
Significant differences existed in the relative abundance of Gemmiger before and after administration (*P<0.05). BT: before treatment; AT: after treatment.
Analysis of microbial metabolic pathways
The measured sequences were annotated by KEGG database, and a total of 285 pathways were annotated. There existed significant differences in one of the lipid metabolic pathways between the two groups (P<0.05), as shown in Table 2. Average abundance of microorganisms in the Ether lipid metabolism pathway of AT group was much lower than that in BT group (P<0.05). The reasons, we speculate are that the number of bacteria related to disease progression induction was decreased after treatment, such as the Firmicutes, which is consistent with previous studies.
Table 2.
Difference of intestinal microbial abundance in different metabolic pathways before and after administration
| Metabolic pathways | Mean abundance of AT group | Mean abundance of BT group | P-value |
|---|---|---|---|
| Ether lipid metabolism | 0.000738979 | 0.001753797 | 0.013104663 |
Note: AT: after treatment; BT: before treatment.
Intestinal microorganisms are also involved in many physiological and pathological processes of host, including digestion and absorption of food, metabolism of nutrients, development of immune system and intestinal inflammation. In addition, intestinal microorganisms may participate in lipid metabolism regulation in a specific way. Bile acids are synthesized in the liver and stored in the gallbladder and then released in the gut. Then, bile acids emulsify dietary fat into smaller particles and enhance the degradation of lipase on triglycerides to further form fatty acids. At the same time, bile acids interact with a variety of receptors to become important signaling molecules involved in metabolic pathways, such as glucose metabolism and lipid metabolism.
The homeostasis of bile acid is regulated by intestinal flora, which indirectly affects various physiological and pathological processes of host. The changes of intestinal flora structure not only affect the composition of bile acids, but also affect the corresponding receptor signaling pathway, which further plays an important role in lipid metabolism regulation. Rima Kaddurah-Daouk and Jia Wei carried out a large-scale study of AD patients [18]. In this study, the bile acid spectrum of 1,464 patients (including 370 patients with normal cognition, 284 patients with early mild cognitive impairment, 505 patients with late mild cognitive impairment and 305 patients with AD) were detected, and relevant change rules of bile acid spectrum during the progression of AD were systematically observed. In this study, bile acids in clinical samples were quantitatively analyzed first. Then, whether there existed changes in bile acid spectrum in patients with mild cognitive impairment (MCI) and whether such changes were related to cognitive decline were analyzed. At the same time, the correlation between bile acid (BA) and ATN (β-amyloid protein, tau protein, nerve degeneration) was analyzed; then, the variation of BA spectrum induced by the changes of bacterial types and enzyme activities in the liver and intestinal flora were determined by the BA ratio; in addition, whether the differentially expressed genes related to AD immunity were related to differential BA markers was also explored.
The analysis about the bile acid spectrum of the AD group and the normal group showed significantly decreased primary bile acid cholic acid (CA), and obviously increased secondary bile acid Deoxycholic acid (DCA) and conjugated bile acid such as glycodeoxycholic acid (GDCA), Taurodeoxycholic acid (TDCA) and Glycosylcholic acid (GLCA) [19]. No significant change was found in the ratio of CA to CDCA in AD patients, but the ratio of DCA to CA was significantly correlated with the diagnosis of AD. In addition, GDCA/CA, DCA/CA and GLCA/CDCA were all closely correlated with Alzheimer’s Disease Assessment Scale-Cognitive 13 (ADAS-Cog13). Analysis of these ratios revealed that the higher the ratio of secondary to primary bile acids was, the worse the cognitive performance was. In addition, decreased CA level and increased levels of GDCA/CA and TDCA/CA were found during the progression from MCI to AD, which may be used as markers for judging and evaluating MCI progression. These above studies reveal that lipid metabolism pathway is an important pathway of bacterial community metabolism. Besides, there existed a significant difference in microbial abundance before and after treatment of Aricept. Aricept may regulate BA level by acting on the target receptors of metabolism related pathways, and then further affect the structure of bacterial community, thus improving the cognitive function of AD patients.
Analysis of drug target network of Aricept
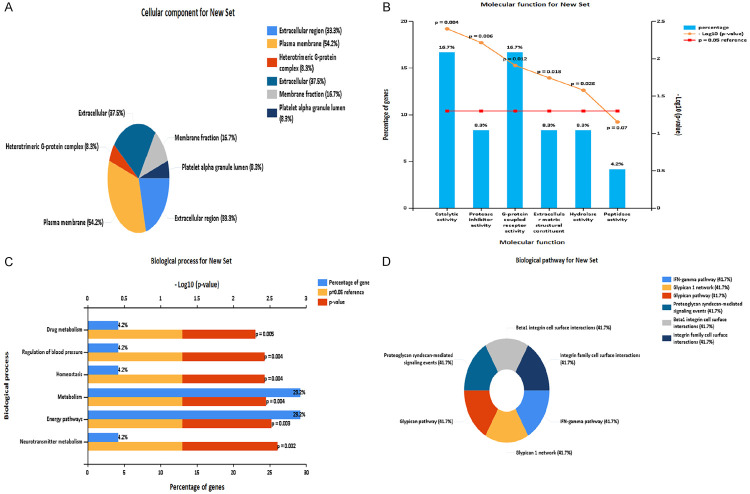
Through the drugbank database analysis, we found that Aricept directly acted on 10 target proteins. The interaction relationship between the targets of Aricept and other proteins was established by comparing the HRPD protein interaction database. Then, the targets network of Aricept was established using the software of cytoscape (see Figure 6 for details) [20]. There are 24 target receptors in the network, and the Gene Ontology analysis about these 24 target receptors was performed using funrich software [21]. We find that cell components mainly concentrate in the plasma membrane and extracellular region; molecular functions mainly concentrate in catalytic activity and G protein coupled receptors; biological processes are mainly enriched in energy metabolism; and biological pathways are mainly concentrated in proteoglycan, interferon GAMMA and other metabolic pathways (Figure 7). Studies have shown that bile acids can also be used as important signal molecules in regulating glucose, fat and energy metabolism. In addition, the secretion of intestinal hypoglycemic hormones in the intestine, gluconeogenesis in the liver, where aglycogen synthesis and energy consumption, inflammation and composition of intestinal flora are all affected by the combination of bile acids with Takeda G protein receptor 5 (TGR5) and nuclear hormone farnesoid X receptor (FXR) [22]. These above functions of bile acids are similar to the molecular function of Aricept’s targets.
Figure 6.
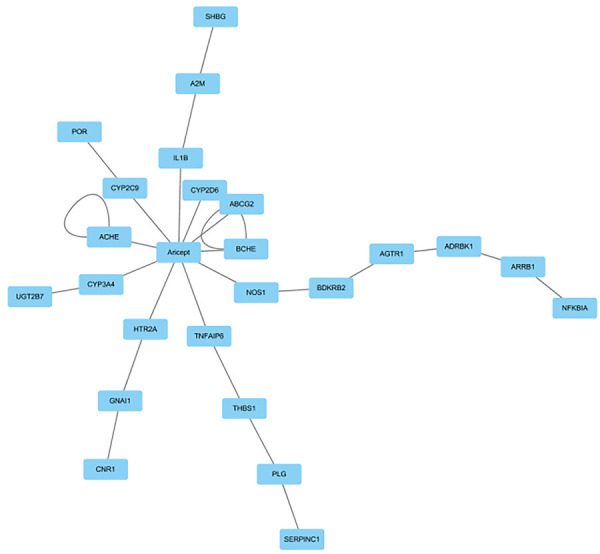
Targets network of Aricept.
Figure 7.
Analysis of target receptor gene function and pathway in the drug target network of Aricept. A: Cellular component analysis; B: Molecular function analysis; C: Biological process analysis; D: Biological pathway analysis.
Discussion
In our present study, commonly reduced Firmicutes was found in mild AD patients who were treated with Aricept for a month. The target receptors directly or indirectly affected by Aricept are mainly concentrated in the plasma membrane and extracellular region; the molecular functions are mainly concentrated in catalytic activity and G-protein coupled receptors; energy metabolism is the main biological process; and biological pathways mainly focus on proteoglycans, interferon GAMMA and other metabolic pathways. Bile acids are mainly involved in lipid energy metabolism. Besides, there exist certain interactions between bile acid and intestinal flora [23]. Through the degradation of bile acid, Intestinal flora affects the size of the bile acid pool and the proportion of bile acid components. In turn, bile acids regulate lipid, glucose and energy metabolism by regulating the homeostasis of intestinal flora. Through binding with FXR and TGR5, Bile acids affect intestinal hypoglycemic hormone secretion, hepatic gluconeogenesis, glycogen synthesis, energy consumption, inflammation and intestinal flora composition. These above views are consistent with the differential metabolic pathways of bacteria and the molecular functions of drug targets revealed in this study. Therefore, Aricept may affect the molecular function of the cluster target G protein coupled receptor, the biological process of energy metabolism, and the biological pathway of proteoglycan. In addition, Aricept and bile acids have synergistic or other regulatory effects on lipid and energy metabolism, and improve the symptoms of mild AD by changing the structure of intestinal flora together. In other words, Aricept and bile acids regulate the activity of the host’s nervous system via intestinal flora regulation.
AD may originate from the intestine and is associated with the imbalance of intestinal flora. In the follow-up study, we will detect the correlation between bile acid levels and brain magnetic resonance imaging (MRI) before and after treatment. The correlation between them and bacterial imbalance would also be explored. To sum up, through the comparative analysis of mild AD populations before and after treatment, Firmicutes was found to be commonly decreased in AD patients after treatment. This study suggests that intestinal flora may not only change in the early stage of AD, but also affect the whole process of AD progression. The changed characteristics of AD related flora composition will also contribute to a more in-depth and systematic study about the interaction between host and intestinal flora in metabolism and immunity, and reveal the role of flora in the occurrence and development of AD.
The deficiency of this study lies in the strict restriction of the inclusion criteria, which leads to a long clinical sampling period and the limited number of patients. In addition, the research methods used here are relatively single, and the multi-group data are not integrated for association analysis. The highly expressed or specifically expressed miRNA in the retina of AD model mice found in our preliminary experimental research group is likely to be a potential marker of AD. However, the relevant clinical trials have not been carried out because the animal experiments are not completed. Moreover, head MRI examination is difficult to carry out because of the low coordination degree of AD patients. In the follow-up study, we will collect larger sample data at different time points in the process of AD progression through multi-center clinical trials, and conduct feature extraction on MRI data of brain functional images for AD patients in different stages. Meanwhile, the miRNA data of AD patient’s retina will be integrated for correlation analysis. In general, through the integration of omics data at different levels, we hope to find potential markers of AD and provide theoretical basis for the development of innovative drugs targeting AD.
Acknowledgements
This research was supported by Zhejiang Provincial Natural Science Foundation of China under Grant No. (LGF18H090020) and Medical Health Science and Technology Project of Zhejiang Provincial Health Commission (No. 2017KY278, 2020KY497).
Disclosure of conflict of interest
None.
References
- 1.Tiwari S, Atluri V, Kaushik A, Yndart A, Nair M. Alzheimer’s disease: pathogenesis, diagnostics, and therapeutics. Int J Nanomedicine. 2019;14:5541–5554. doi: 10.2147/IJN.S200490. [DOI] [PMC free article] [PubMed] [Google Scholar]
- 2.Hampel H, Mesulam MM, Cuello AC, Farlow MR, Giacobini E, Grossberg GT, Khachaturian AS, Vergallo A, Cavedo E, Snyder PJ, Khachaturian ZS. The cholinergic system in the pathophysiology and treatment of Alzheimer’s disease. Brain. 2018;141:1917–1933. doi: 10.1093/brain/awy132. [DOI] [PMC free article] [PubMed] [Google Scholar]
- 3.Guo J, Wang Z, Liu R, Huang Y, Zhang N, Zhang R. Memantine, donepezil, or combination therapy-what is the best therapy for Alzheimer’s disease? A network meta-analysis. Brain Behav. 2020;10:e01831. doi: 10.1002/brb3.1831. [DOI] [PMC free article] [PubMed] [Google Scholar]
- 4.Jiang J, Liu G, Shi S, Li Y, Li Z. Effects of manual acupuncture combined with donepezil in a mouse model of Alzheimer’s disease. Acupunct Med. 2019;37:64–71. doi: 10.1136/acupmed-2016-011310. [DOI] [PubMed] [Google Scholar]
- 5.Sie C, Perez LG, Kreutzfeldt M, Potthast M, Ohnmacht C, Merkler D, Huber S, Krug A, Korn T. Dendritic cell accumulation in the gut and central nervous system is differentially dependent on α4 integrins. J Immunol. 2019;203:1417–1427. doi: 10.4049/jimmunol.1900468. [DOI] [PMC free article] [PubMed] [Google Scholar]
- 6.Li XJ, You XY, Wang CY, Li XL, Sheng YY, Zhuang PW, Zhang YJ. Bidirectional brain-gut-microbiota axis in increased intestinal permeability induced by central nervous system injury. CNS Neurosci Ther. 2020;26:783–790. doi: 10.1111/cns.13401. [DOI] [PMC free article] [PubMed] [Google Scholar]
- 7.Peng W, Yi P, Yang J, Xu P, Wang Y. Association of gut microbiota composition and function with a senescence-accelerated mouse model of Alzheimer’s disease using 16S rRNA gene and metagenomic sequencing analysis. Aging. 2018;10:4054–4065. doi: 10.18632/aging.101693. [DOI] [PMC free article] [PubMed] [Google Scholar]
- 8.Zhuang ZQ, Shen LL, Li WW, Fu X, Zeng F, Gui L, Lü Y, Cai M, Zhu C, Tan YL, Zheng P, Li HY, Zhu J, Zhou HD, Bu XL, Wang YJ. Gut microbiota is altered in patients with Alzheimer’s disease. J Alzheimers Dis. 2018;63:1337–1346. doi: 10.3233/JAD-180176. [DOI] [PubMed] [Google Scholar]
- 9.Carrillo MC, Dean RA, Nicolas F, Miller DS, Berman R, Khachaturian Z, Bain LJ, Schindler R, Knopman D. Revisiting the framework of the national institute on Aging-Alzheimer’s Association diagnostic criteria. Alzheimers Dement. 2013;9:594–601. doi: 10.1016/j.jalz.2013.05.1762. [DOI] [PubMed] [Google Scholar]
- 10.Kondratenko Y, Korobeynikov A, Lapidus A. Correction to: CDSnake: snakemake pipeline for retrieval of annotated otus from paired-end reads using CD-HIT utilities. BMC Bioinformatics. 2020;21:362. doi: 10.1186/s12859-020-03709-w. [DOI] [PMC free article] [PubMed] [Google Scholar]
- 11.Cai Z, Liao H, Wang C, Chen J, Tan M, Mei Y, Wei L, Chen H, Yang R, Liu X. A comprehensive study of the aerial parts of lonicera japonica thunb. Based on metabolite profiling coupled with PLS-DA. Phytochem Anal. 2020;31:786–800. doi: 10.1002/pca.2943. [DOI] [PubMed] [Google Scholar]
- 12.Wang X, Sun G, Feng T, Zhang J, Huang X, Wang T, Xie Z, Chu X, Yang J, Wang H, Chang S, Gong Y, Ruan L, Zhang G, Yan S, Lian W, Du C, Yang D, Zhang Q, Lin F, Liu J, Zhang H, Ge C, Xiao S, Ding J, Geng M. Sodium oligomannate therapeutically remodels gut microbiota and suppresses gut bacterial amino acids-shaped neuroinflammation to inhibit Alzheimer’s disease progression. Cell Res. 2019;29:787–803. doi: 10.1038/s41422-019-0216-x. [DOI] [PMC free article] [PubMed] [Google Scholar]
- 13.Zhang YL, Liu Y, Xu PY, Wen L. Exploring the mechanism of Jiedu Huayu decoction to improve the cognitive function of Alzheimer’s disease mice based on the regulation of the brain-gut axis. Chin J Pharmacol Toxicol. 2019;33:42. [Google Scholar]
- 14.Zhou KX, Xu LT, Ma YJ, Zhou JS, Dai JJ, Liang LL, Wei H. Relationships between intestinal zmicrobiota and Alzheimer disease and regulation of microbiota on prevention and treatment of Alzheimer disease: review. Chin J Pharmacol Toxicol. 2016;11:1198–1205. [Google Scholar]
- 15.Cheng L, Qi C, Zhuang H, Fu T, Zhang X. GutMDisorder: a comprehensive Database for dysbiosis of the gut microbiota in disorders and interventions. Nucleic Acids Res. 2020;48:D554–D560. doi: 10.1093/nar/gkz843. [DOI] [PMC free article] [PubMed] [Google Scholar]
- 16.Bäuerl C, Collado MC, Diaz Cuevas A, Viña J, Martínez GP. Shifts in Gut microbiota composition in an APP/PSS1 transgenic mouse model of Alzheimer’s disease during lifespan. Lett Appl Microbiol. 2018;66:464–471. doi: 10.1111/lam.12882. [DOI] [PubMed] [Google Scholar]
- 17.Sun J, Liu S, Ling Z, Wang F, Ling Y, Gong T, Fang N, Ye S, Si J, Liu J. Fructooligosaccharides ameliorating cognitive deficits and neurodegeneration in APP/PS1 transgenic mice through modulating gut microbiota. J Agric Food Chem. 2019;67:3006–3017. doi: 10.1021/acs.jafc.8b07313. [DOI] [PubMed] [Google Scholar]
- 18.MahmoudianDehkordi S, Arnold M, Nho K, Ahmad S, Jia W, Xie G, Louie G, Kueider-Paisley A, Moseley MA, Thompson JW, St John Williams L, Tenenbaum JD, Blach C, Baillie R, Han X, Bhattacharyya S, Toledo JB, Schafferer S, Klein S, Koal T, Risacher SL, Kling MA, Motsinger-Reif A, Rotroff DM, Jack J, Hankemeier T, Bennett DA, De Jager PL, Trojanowski JQ, Shaw LM, Weiner MW, Doraiswamy PM, van Duijn CM, Saykin AJ, Kastenmüller G, Kaddurah-Daouk R Alzheimer’s Disease Neuroimaging Initiative and the Alzheimer Disease Metabolomics Consortium. Altered bile acid profile associates with cognitive impairment in Alzheimer’s disease-an emerging role for gut microbiome. Alzheimers Dement. 2019;15:76–92. doi: 10.1016/j.jalz.2018.07.217. [DOI] [PMC free article] [PubMed] [Google Scholar]
- 19.Nho K, Kueider-Paisley A, MahmoudianDehkordi S, Arnold M, Risacher SL, Louie G, Blach C, Baillie R, Han X, Kastenmüller G, Jia W, Xie G, Ahmad S, Hankemeier T, van Duijn CM, Trojanowski JQ, Shaw LM, Weiner MW, Doraiswamy PM, Saykin AJ, Kaddurah-Daouk R Alzheimer’s Disease Neuroimaging Initiative and the Alzheimer Disease Metabolomics Consortium. Altered bile acid profile in mild cognitive impairment and Alzheimer’s disease: relationship to neuroimaging and CSF biomarkers. Alzheimers Dement. 2019;15:232–244. doi: 10.1016/j.jalz.2018.08.012. [DOI] [PMC free article] [PubMed] [Google Scholar]
- 20.Legeay M, Doncheva NT, Morris JH, Jensen LJ. Visualize omics data on networks with omics visualizer, a cytoscape app. F1000Res. 2020;9:157. doi: 10.12688/f1000research.22280.1. [DOI] [PMC free article] [PubMed] [Google Scholar]
- 21.Pathan M, Keerthikumar S, Ang CS, Gangoda L, Quek CY, Williamson NA, Mouradov D, Sieber OM, Simpson RJ, Salim A, Bacic A, Hill AF, Stroud DA, Ryan MT, Agbinya JI, Mariadason JM, Burgess AW, Mathivanan S. FunRich: an open access standalone functional enrichment and interaction network analysis tool. Proteomics. 2015;15:2597–2601. doi: 10.1002/pmic.201400515. [DOI] [PubMed] [Google Scholar]
- 22.Shapiro H, Kolodziejczyk AA, Halstuch D, Elinav E. Bile acids in glucose metabolism in health and disease. J Exp Med. 2018;215:383–396. doi: 10.1084/jem.20171965. [DOI] [PMC free article] [PubMed] [Google Scholar]
- 23.Kamp KJ, Cain KC, Utleg A, Burr RL, Raftery D, Luna RA, Shulman RJ, Heitkemper MM. Bile acids and microbiome among individuals with irritable bowel syndrome and healthy volunteers. Biol Res Nurs. 2021;23:65–74. doi: 10.1177/1099800420941255. [DOI] [PMC free article] [PubMed] [Google Scholar]


