Abstract
Tracheal, bronchus, and lung (TBL) cancer is the most common malignant tumor worldwide. This study aims to grasp the characteristics of the TBL cancer burden in China and the United States (USA). Data included incidence, deaths, and disability-adjusted life years (DALYs) as well as their age-standardized rates (ASRs) among different gender, age and risk factors. Joinpoint Regression Model and Age-period-cohort (APC) analysis were used to evaluate the variation tendency and effect of the risk factors. China and USA bore almost half of the TBL cancer burden, especially for males. ASRs of TBL cancer increased in China, but decreased in USA. In China, three factors related to TBL cancer deaths and DALYs related were tobacco, air pollution, and diet low in fruits; in USA, these are tobacco, occupational carcinogens, and high fasting plasma glucose. The younger the population, the less impact of birth cohort on morbidity and mortality. According to APC analysis, age effect played a key role in morbidity and mortality of TBL cancer, and the risk increased with age. Period effect kept increasing over time, while cohort effect decreased with the time of birth. Tobacco was always the top risk factor of death and DALYs in both countries. The policy should be tilted towards air pollution and a diet low in fruits in China, as well as occupational carcinogens and high fasting plasma glucose in USA. Healthcare reform in both countries should focus on planning how its health system could effectively prevent and manage TBL cancer at low cost.
Keywords: Age-period-cohort model, joinpoint regression, risk factors, tracheal, bronchus, lung cancer, GBD study
Introduction
Along with the social structure of population aging, the incidence of chronic non-communicable diseases keeps rising. Tracheal, bronchus, and lung (TBL) cancer remains a public health problem worldwide and its burden varies among countries [1,2]. Lung cancer ranks first for the cancer burden in both China [3] and the United States (USA) [4], while it causes the most years of life lost (YLLs) in China [5].
The geographical diversity in cancer burden exists at different phases of social and economic transformation, and the availability of health resources varies significantly among countries [6]. For instance, China provides one-fifth of the world’s population with limited health care resources, while USA is the third most populous country worldwide with advanced medical conditions. Based on our previous study, most of global TBL cancer burden originated from China and USA [7]. Cigarette smoking is the major risk factor for lung cancer, while the cigarette smoking rate differs drastically between China and USA [8,9]. Comparative investigation on TBL cancer burden between China and USA are sparse, which may generate ideas on its control and prevention [10].
Therefore, we aimed to investigate the incidence, deaths, risk factors, time trends, and disability-adjusted life years (DALYs) for TBL cancer in China and USA during 1990-2017, based on the Global Burden of Disease Study (GBD) 2017 data [11].
Methods
Study data
Data on TBL cancer-related incidence, deaths, DALYs and their age-standardized rates (ASRs), from 1990 to 2017, were retrieved from the GBD database (http://ghdx.healthdata.org/gbd-results-tool) [12-15]. Data for overall and the stratification by sex, age groups (15-49, 50-64, and ≥70 years) and for all known risk factors were collected from the GBD database. TBL cancer risk factors in different levels were obtained as below: Level 1 including metabolic risks, environmental/occupational risks and behavioral risks; Level 2 including tobacco (smoking, secondhand smoke), dietary risks (low-fruit diet), air pollution (ambient particulate matter pollution, household air pollution from solid fuels), other environmental risks (residential radon), occupational risks (occupational exposure to asbestos, chromium, arsenic, beryllium, nickel, cadmium, diesel engine exhaust, polycyclic aromatic hydrocarbons, and silica) and high fasting plasma glucose level.
Joinpoint trend analysis
The Joinpoint Regression Model (JRM) is a set of linear statistical models. JRM was used for assessing trends of diseases over time, i.e., and evaluating the significance of changes in different periods, thus avoiding the non-objectivity of the traditional trend analysis based on linear trend. The calculation principle of JRM is the application of the least square method, estimating the change rule of the disease rate. The turning point of the changing trend is determined by calculating the square sum of the residual error between the estimated and the real value [16].
JRM was conducted by Joinpoint software (version 4.7.0) of the Surveillance Research Program from the US National Cancer Institute. Meanwhile, annual percent change (APC) and average annual percent change (AAPC) were calculated. P-value was determined by a Monte Carlo permutation test, with a significance level of 0.05. By comparing APC and AAPC with 0, we ascertained whether the variation trend in different sections is statistically significant.
Age-period-cohort analysis
Based on Poisson distribution, we used Stata 14.0 software (StataCorp, College Station, TX, USA) to split the variation trend of TBL cancer morbidity and mortality in the age-period-cohort (APC) model and estimate the parameter values of age, period, and cohort effects, respectively. Compared with the traditional methods, APC model can be used for describing and explaining the long-term trend of the morbidity or mortality of disease with the change of time from three dimensions (age, period and cohort), and quantitatively analyzing the contribution of these three factors by controlling the interaction effect [17]. Therefore, it is widely used in morbidity and mortality investigation of chronic non-infectious diseases, especially for malignant tumors. Intrinsic Estimator (IE) could solve the problem of unrecognized in the APC model by estimable functions [18], generating estimated values of model parameters by vector space projection [19].
In the APC model, people with TBL cancer were divided into consecutive 5-year age groups (20-24, 25-29, …, 70-74, 75-79 years), sequential 5-year periods from 1990 to 2017, and relevant successive 5-year birth cohorts (1917-1921, 1922-1926, …, 1997-2001, 2002-2006).
Results
TBL cancer burden in China and USA
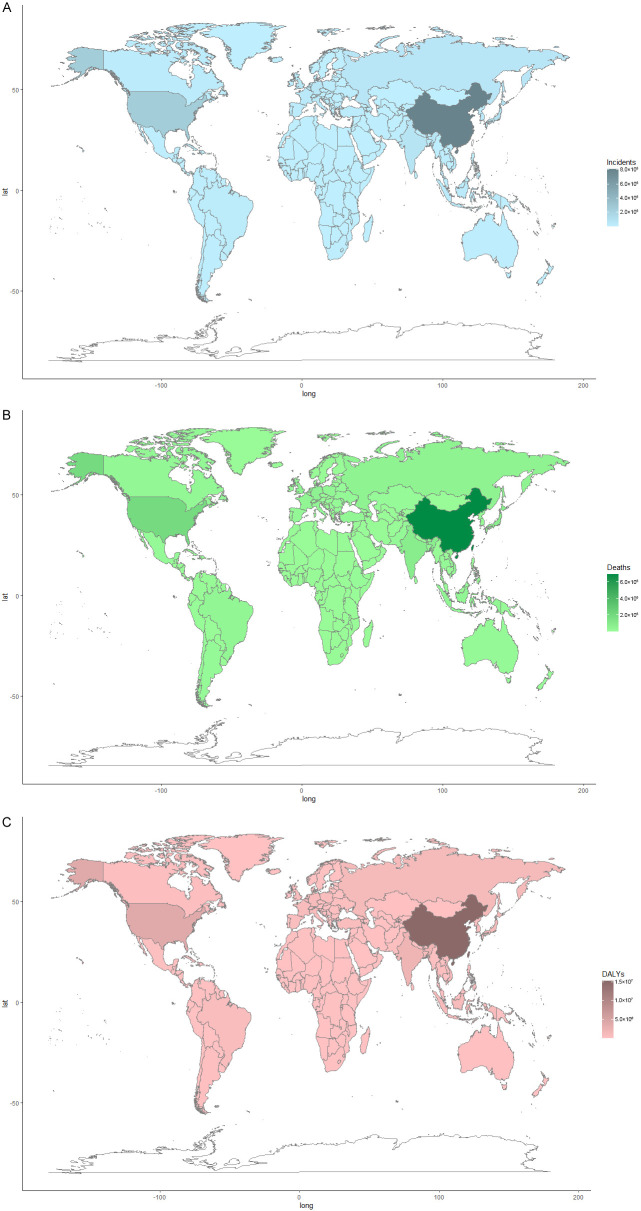
China and USA accounted for almost half of the global burden of TBL cancer. In 2017, there were 813,209 incident cases of TBL cancer in China (accounting for 37.59% worldwide, male to female ratio 2.33) and 247,661 incident cases (accounting for 11.45% worldwide, male to female ratio 1.30) in USA; 692,388 deaths in China (accounting for 36.77% worldwide, male to female ratio 2.22) and 190,697 deaths (accounting for 10.13% worldwide, male to female ratio 1.25) in USA; 15,252,918.02 DALYs in China (accounting for 37.27% worldwide, male to female ratio 2.26) and 3,765,845.01 DALYs (accounting for 9.20% worldwide, male to female ratio 1.19) in USA (Figure 1).
Figure 1.
The distribution of TBL cancer burden in 2017 worldwide. A. Incidents; B. Deaths; C. DALYs. DALY, disability adjusted life-year.
As shown in Figure 2, incident cases, deaths, DALYs of TBL cancer in China and USA all increased by years. From 1990 to 2017, there was a significant increase (237.38% increase of incident cases, 187.93% increase of deaths, and 140.26% increase of DALYs) in China and a slight increase (42.16% increase of incident cases, 24.94% increase of deaths, and 12.18% increase of DALYs) in USA. In China, the incident cases, deaths, DALYs for females increased by 229.32%, 182.98%, and 131.87% respectively, while for males these measures increased by 241.07%, 190.21%, and 144.05%, respectively. In USA, those indicators for females grew by 74.85%, 52.80%, and 35.28%, respectively; as for males, they grew by 22.91%, 8.99%, and -0.88%, respectively.
Figure 2.
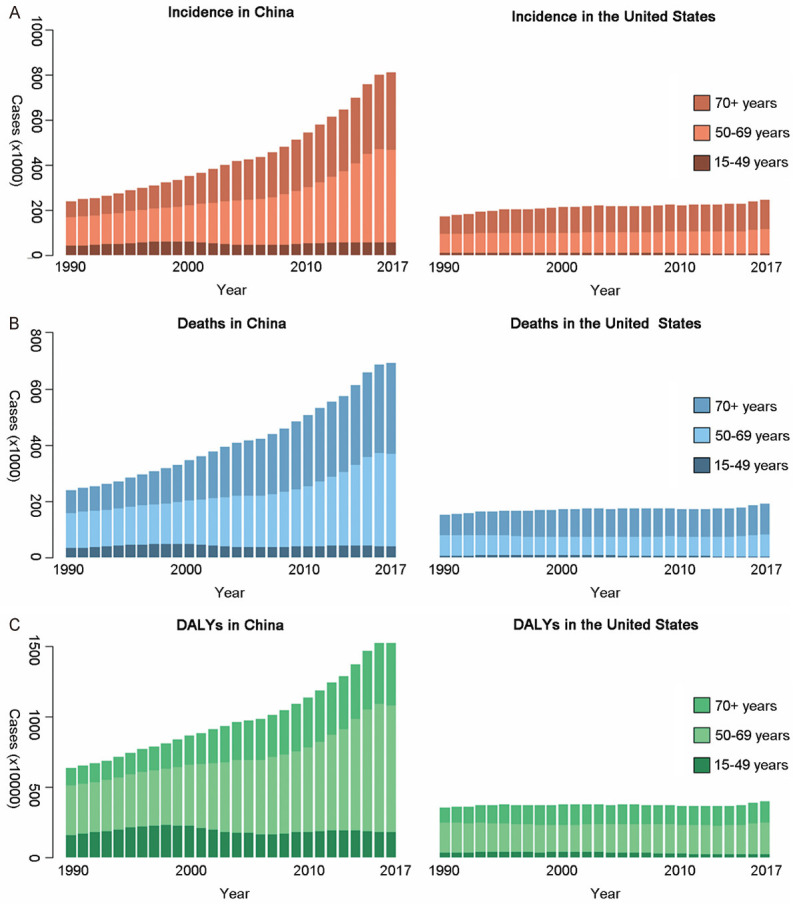
TBL cancer burden of three age groups in both countries over 28 years. A. Incidents; B. Deaths; C. DALYs. DALY, disability adjusted life-year.
From 1990 to 2017, the TBL cancer burden for females and males all increased faster in China than that in USA. Besides, the main age group of incident cases and deaths in both countries was 50+ years old. DALYs of TBL cancer in both countries was mainly distributed in 50-69 years old, regardless of the gender (Figures 3 and 4).
Figure 3.
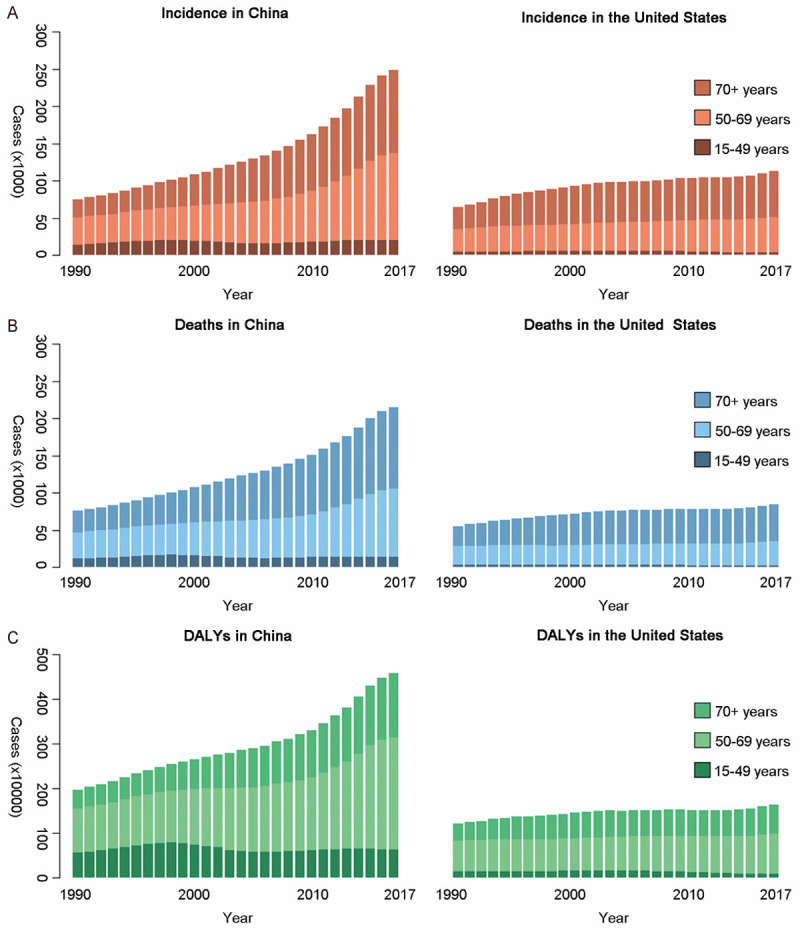
TBL cancer burden of three age groups among females in both countries over 28 years. A. Incidents; B. Deaths; C. DALYs. DALY: disability adjusted life-year.
Figure 4.
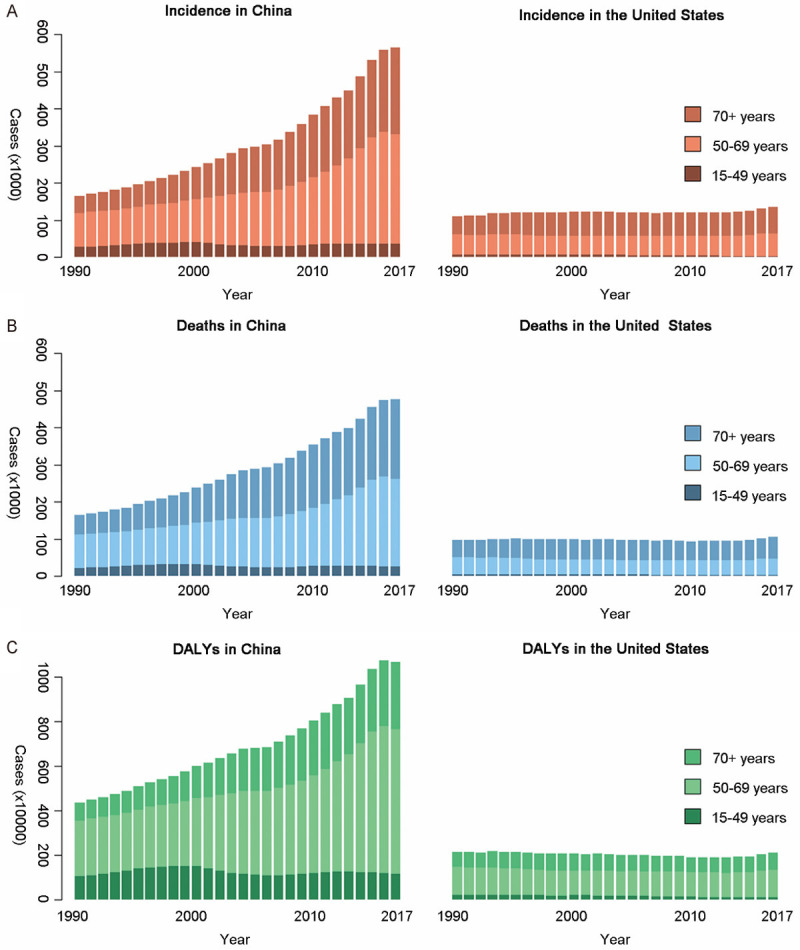
TBL cancer burden of three age groups among males in both countries over 28 years. A. Incidents; B. Deaths; C. DALYs. DALY: disability adjusted life-year.
Joinpoint regression
As shown in Table 1, during the 1994-2004 and 2007-2017 period, the age-standardized incidence rate (ASIR) of TBL cancer in China was on the rise. The ASIR in USA increased from 1990 to 1995, and decreased from 1995 to 2015. As for age-standardized death rate (ASDR), it increased during 1994-2004 and 2007-2017 in China. Age-standardized DALY Rate was on the rise during 1990-2004, 2007-2012 and 2012-2015 in China; whereas it was on the decline during 2004-2007, and 2015-2017. In USA, ASDR and age-standardized DALY rate decreased in period of 1994-2003 and 2003-2014. On the whole, ASRs of TBL cancer in both genders increased in China, but decreased in USA.
Table 1.
Log-transformed joinpoint trends of TBL cancer ASRs by sex in China and USA
| Measure | Country | Sex | Trend 1 | Trend 2 | Trend 3 | Trend 4 | Trend 5 | 1990-2017 AAPC† (95% CI) | 2000-2017 AAPC (95% CI†) | |||||
|---|---|---|---|---|---|---|---|---|---|---|---|---|---|---|
|
|
|
|
|
|
||||||||||
| Years | APC† | Years | APC | Years | APC | Years | APC | Years | APC | |||||
| ASIR† | China | Both | 1990-1994 | 0.36 | 1994-2004 | 1.64* | 2004-2007 | 0.18 | 2007-2017 | 2.79* | NA† | NA | 1.7*(1.3-2.1) | 2.1*(1.5-2.6) |
| Female | 1990-2004 | 0.98* | 2004-2007 | 0.43 | 2007-2011 | 2.25* | 2011-2015 | 3.73* | 2015-2017 | 1.06 | 1.5*(1.3-1.7) | 1.8*(1.5-2.2) | ||
| Male | 1990-1998 | 0.87* | 1998-2003 | 2.72* | 2003-2006 | -0.21* | 2006-2017 | 2.60* | NA | NA | 1.8*(1.3-2.3) | 2.1*(1.4-2.8) | ||
| USA | Both | 1990-1995 | 1.64* | 1995-2002 | -0.43* | 2002-2015 | -1.95* | 2015-2017 | 1.28 | NA | NA | -0.7*(-0.8- -0.5) | -1.4*(-1.6- -1.2) | |
| Female | 1990-1995 | 3.41* | 1995-2002 | 0.83* | 2002-2009 | -1.11* | 2009-2015 | -1.79* | 2015-2017 | 0.78 | 0.2*(0.1-0.3) | -0.9*(-1.0- -0.8) | ||
| Male | 1990-1995 | 0.49* | 1995-2002 | -1.52* | 2002-2014 | -2.60* | 2014-2017 | 0.53 | NA | NA | -1.4*(-1.5- -1.3) | -1.9*(-2.1- -1.8) | ||
| ASDR† | China | Both | 1990-1994 | 0.10 | 1994-2004 | 1.42* | 2004-2007 | -0.45 | 2007-2017 | 1.42* | NA | NA | 1.0*(0.7-1.3) | 1.1*(0.6-1.6) |
| Female | 1990-2003 | 0.77* | 2003-2008 | -0.06 | 2008-2012 | 1.44* | 2012-2015 | 2.60* | 2015-2017 | 0.28 | 0.9*(0.7-1.1) | 0.9*(0.6-1.3) | ||
| Male | 1990-1997 | 0.51* | 1997-2004 | 2.07* | 2004-2007 | -1.09 | 2007-2010 | 2.43 | 2010-2017 | 0.78* | 1.0*(0.5-1.6) | 1.0*(0.2-1.9) | ||
| USA | Both | 1990-1994 | 0.47 | 1994-2003 | -0.91* | 2003-2014 | -2.32* | 2014-2017 | 0.36 | NA | NA | -1.1*(-1.3- -1.0) | -1.6*(-1.8- -1.4) | |
| Female | 1990-1995 | 1.79* | 1995-2002 | 0.29* | 2002-2006 | -0.91* | 2006-2014 | -1.94* | 2014-2017 | 0.03 | -0.3*(-0.4- -0.2) | -1.1*(-1.2- -1.0) | ||
| Male | 1990-1994 | -0.55 | 1994-2003 | -1.93* | 2003-2014 | -2.89* | 2014-2017 | 0.69 | NA | NA | -1.8*(-2.0- -1.7) | -2.1*(-2.3- -1.9) | ||
| Age standardized DALY† Rate | China | Both | 1990-2004 | 0.46* | 2004-2007 | -1.47* | 2007-2012 | 1.13* | 2012-2015 | 2.38* | 2015-2017 | -0.52* | 0.5*(0.3-0.7) | 0.5*(0.2-0.9) |
| Female | 1990-1998 | 0.57* | 1998-2009 | -0.70* | 2009-2012 | 1.28 | 2012-2015 | 2.57* | 2015-2017 | 0.20 | 0.3*(0.1-0.5) | 0.3 (-0.1-0.7) | ||
| Male | 1990-1993 | -0.36 | 1993-2004 | 0.79* | 2004-2007 | -1.32 | 2007-2017 | 1.38* | NA | NA | 0.6*(0.2-1.0) | 0.8*(0.2-1.3) | ||
| USA | Both | 1990-1994 | -0.23 | 1994-2003 | -1.51* | 2003-2014 | -2.77* | 2014-2017 | 0.74 | NA | NA | -1.6*(-1.7- - 1.4) | -1.9 (-2.1- -1.8) | |
| Female | 1990-1995 | 0.91* | 1995-2002 | -0.36* | 2002-2006 | -1.46* | 2006-2014 | -2.39* | 2014-2017 | 0.28 | -0.8*(-0.9- -0.7) | -1.5*(-1.6- -1.3) | ||
| Male | 1990-1995 | -1.16* | 1995-1998 | -3.18* | 1998-2002 | -1.95* | 2002-2014 | -3.26* | 2014-2017 | 1.20* | -2.2*(-2.5- -1.9) | -2.3*(-2.5- -2.1) | ||
AAPC, Average annual percent change; APC, Annual percent change; CI, confidence interval; ASIR, age standardized incidence rate; ASDR, age standardized death rate; DALY, disability adjusted life-year; NA, not applicable.
Significantly different from zero, P value <0.05.
Differences of attributable risk factors
Tobacco (including cigarette smoking and secondhand smoke), air pollution, and a low diet in fruits were the top three attributable risk factors of ASDR and age-standardized DALYs rate of TBL cancer in China. In USA, the top three risk factors were tobacco, occupational carcinogens, and high fasting plasma glucose (Figures 5 and 6). Tobacco was the main risk factor of death and DALYs in both countries. Besides, it increased in China but decreased in USA over time. For females, tobacco and air pollution accounted for similar proportion of TBL cancer deaths and DALYs related risk factors in China, whereas in USA, tobacco accounted for the majority (Figures 5B and 6B). Occupational carcinogens had a large ASDR among males in USA, second to tobacco (Figures 5C and 6C).
Figure 5.
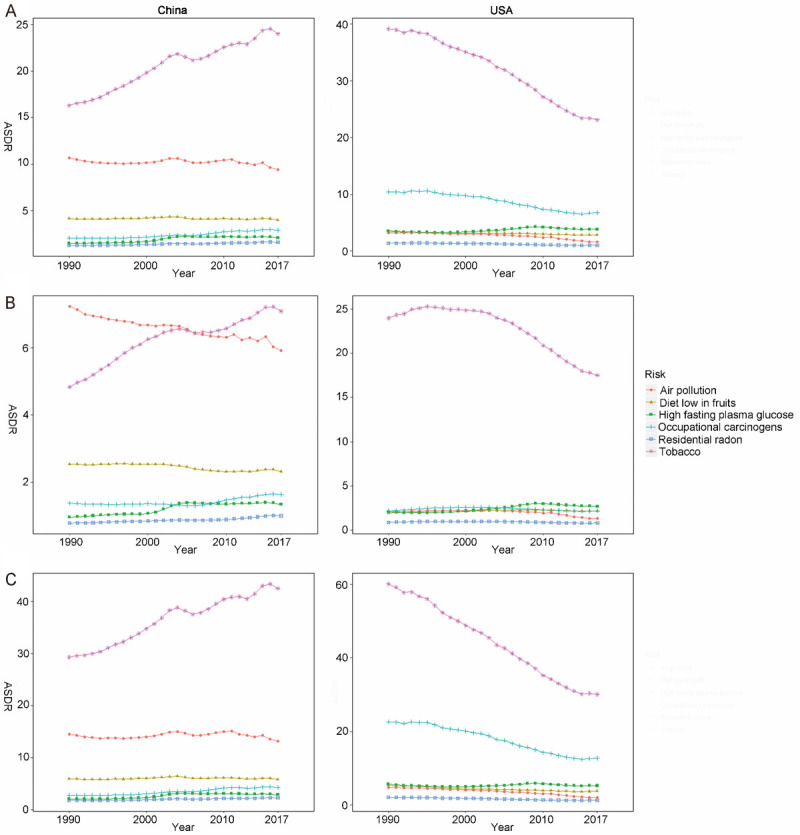
The variation trend of ASDR (per 100,000 people) of six risks in different genders over 28 years. A. Both gender; B. Females; C. Males. ASDR, age standardized death rate.
Figure 6.
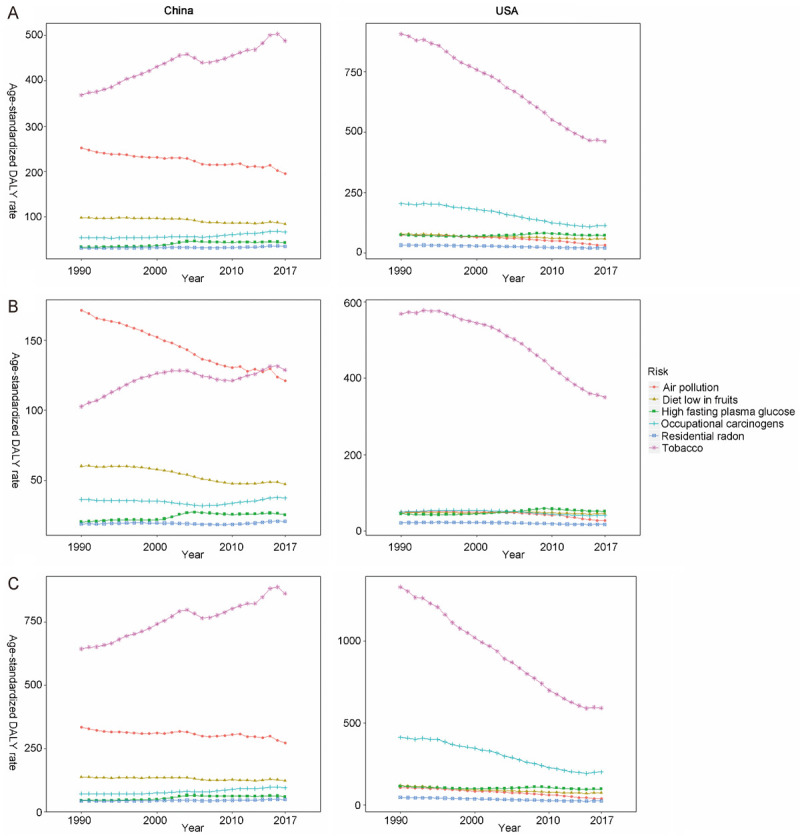
The variation trend of age standardized DALY rate (per 100,000 people) of six risks in different genders over 28 years. A. Both gender; B. Females; C. Males. DALY, disability adjusted life-year.
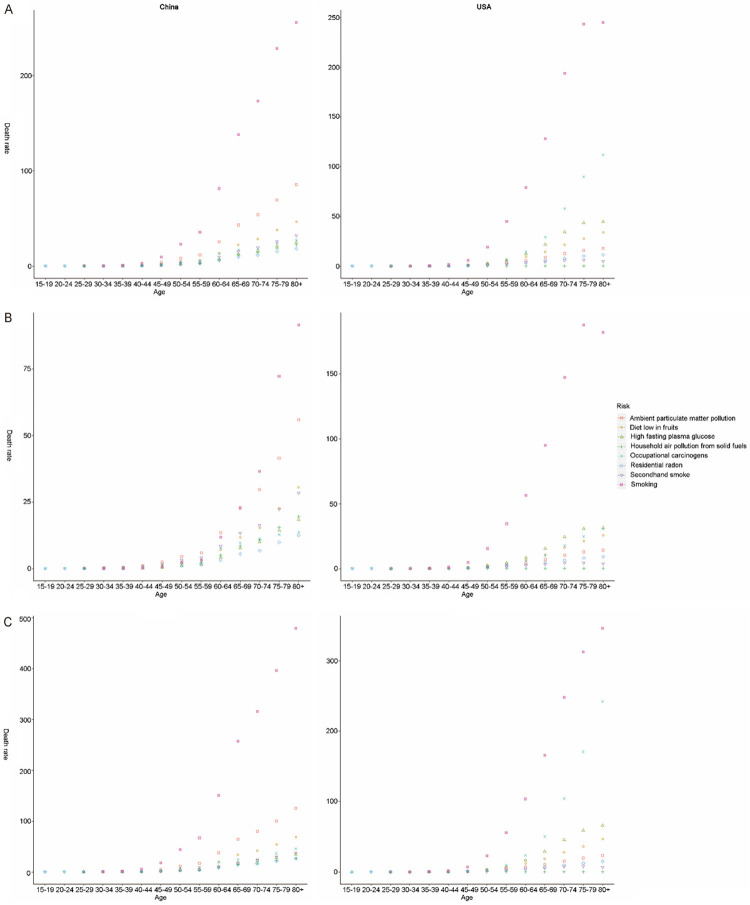
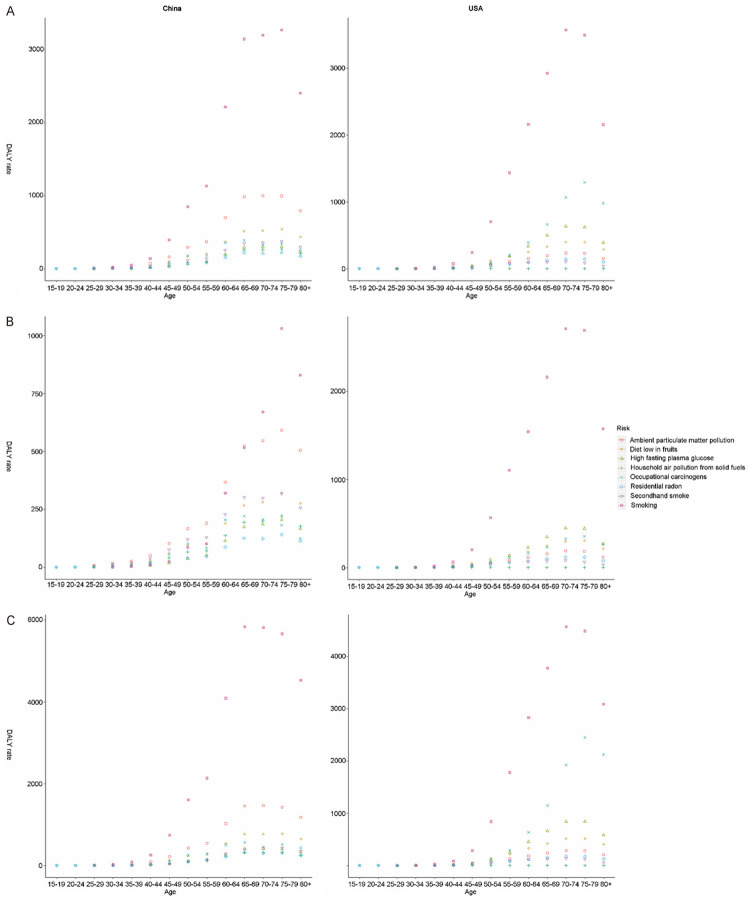
As shown in Figure 7A, all risk factors-related TBL cancer death rates increased with age in both countries since 40 years old, except for secondhand smoking and household air pollution from solid fuels in USA. Smoking, ambient particulate matter pollution, and a diet low in fruits were the top three risk factors for death rate and DALYs rate in China (with an evident cumulative age effect). All risk-related DALY rates in both countries showed a single age peak (age of 70 years for China and age of 70-75 years for USA), except for household air pollution from solid fuels (Figure 8A). Smoking, a low diet in fruits, ambient particulate matter pollution, and second smoking had similar cumulative effects on death rates among Chinese women (Figures 7B and 8B). However, smoking exerted a significant cumulative age-related influence on death rate for females in USA, but not for males (Figures 7C and 8C).
Figure 7.
The variation trend of death rate (per 100,000 people) of eight risks in different genders and age groups. A. Both gender; B. Females; C. Males.
Figure 8.
The variation trend of DALY rate (per 100,000 people) of eight risks in different genders and age groups. A. Both gender; B. Females; C. Males. DALY, disability adjusted life-year.
APC model
As shown in Tables 2 and 3, the age effect on TBL cancer morbidity and mortality increased in both countries. The period effect increased with time, while the cohort effect decreased in both countries.
Table 2.
APC model analysis of TBL cancer morbidity among females and males in both countries
| Morbidity | China | The United States | ||||||||||||||
|---|---|---|---|---|---|---|---|---|---|---|---|---|---|---|---|---|
|
|
|
|||||||||||||||
| Female | Male | Female | Male | |||||||||||||
|
|
|
|
|
|||||||||||||
| Coef. † | 95% CI† | p-value | Coef. | 95% CI | p-value | Coef. | 95% CI | p-value | Coef. | 95% CI | p-value | |||||
|
|
|
|
|
|||||||||||||
| LL† | UL† | LL | UL | LL | UL | LL | UL | |||||||||
| Age (years) | ||||||||||||||||
| 20-24 | -2.40 | -3.37 | -1.43 | 0.000 | -2.61 | -3.43 | -1.80 | 0.000 | -3.44 | -4.96 | -1.91 | 0.000 | -3.42 | -4.73 | -2.10 | 0.000 |
| 25-29 | -1.65 | -2.23 | -1.06 | 0.000 | -1.83 | -2.30 | -1.35 | 0.000 | -2.66 | -3.59 | -1.74 | 0.000 | -2.76 | -3.62 | -1.91 | 0.000 |
| 30-34 | -1.15 | -1.60 | -0.69 | 0.000 | -1.32 | -1.69 | -0.95 | 0.000 | -1.79 | -2.41 | -1.16 | 0.000 | -2.04 | -2.65 | -1.43 | 0.000 |
| 35-39 | -0.94 | -1.33 | -0.54 | 0.000 | -1.11 | -1.42 | -0.80 | 0.000 | -1.01 | -1.48 | -0.55 | 0.000 | -1.26 | -1.70 | -0.81 | 0.000 |
| 40-44 | -0.45 | -0.75 | -0.14 | 0.004 | -0.57 | -0.81 | -0.34 | 0.000 | -0.31 | -0.67 | 0.04 | 0.086 | -0.48 | -0.81 | -0.14 | 0.005 |
| 45-49 | -0.05 | -0.29 | 0.19 | 0.682 | -0.13 | -0.31 | 0.06 | 0.174 | 0.28 | 0.00 | 0.56 | 0.054 | 0.23 | -0.02 | 0.49 | 0.074 |
| 50-54 | 0.29 | 0.10 | 0.49 | 0.003 | 0.34 | 0.20 | 0.49 | 0.000 | 0.78 | 0.56 | 1.00 | 0.000 | 0.83 | 0.64 | 1.03 | 0.000 |
| 55-59 | 0.57 | 0.41 | 0.74 | 0.000 | 0.73 | 0.61 | 0.85 | 0.000 | 1.18 | 1.01 | 1.36 | 0.000 | 1.29 | 1.14 | 1.45 | 0.000 |
| 60-64 | 1.01 | 0.87 | 1.15 | 0.000 | 1.20 | 1.10 | 1.30 | 0.000 | 1.49 | 1.34 | 1.65 | 0.000 | 1.64 | 1.51 | 1.77 | 0.000 |
| 65-69 | 1.34 | 1.20 | 1.47 | 0.000 | 1.53 | 1.43 | 1.64 | 0.000 | 1.73 | 1.58 | 1.89 | 0.000 | 1.88 | 1.74 | 2.02 | 0.000 |
| 70-74 | 1.62 | 1.47 | 1.77 | 0.000 | 1.82 | 1.70 | 1.94 | 0.000 | 1.86 | 1.67 | 2.05 | 0.000 | 2.02 | 1.85 | 2.19 | 0.000 |
| 75-79 | 1.80 | 1.61 | 1.98 | 0.000 | 1.94 | 1.80 | 2.08 | 0.000 | 1.88 | 1.65 | 2.12 | 0.000 | 2.05 | 1.83 | 2.27 | 0.000 |
| Period (year) | ||||||||||||||||
| 1992 | -0.24 | -0.38 | -0.09 | 0.002 | -0.28 | -0.39 | -0.17 | 0.000 | -0.36 | -0.53 | -0.18 | 0.000 | -0.20 | -0.36 | -0.04 | 0.015 |
| 1997 | -0.18 | -0.29 | -0.08 | 0.001 | -0.23 | -0.31 | -0.15 | 0.000 | -0.16 | -0.27 | -0.04 | 0.006 | -0.09 | -0.19 | 0.01 | 0.069 |
| 2002 | -0.11 | -0.19 | -0.03 | 0.009 | -0.10 | -0.15 | -0.04 | 0.000 | -0.01 | -0.07 | 0.05 | 0.715 | -0.01 | -0.06 | 0.04 | 0.635 |
| 2007 | -0.03 | -0.11 | 0.05 | 0.463 | -0.02 | -0.07 | 0.04 | 0.554 | 0.07 | 0.01 | 0.13 | 0.034 | 0.00 | -0.05 | 0.06 | 0.871 |
| 2012 | 0.17 | 0.07 | 0.27 | 0.001 | 0.22 | 0.14 | 0.29 | 0.000 | 0.15 | 0.04 | 0.27 | 0.008 | 0.06 | -0.04 | 0.17 | 0.226 |
| 2017 | 0.39 | 0.26 | 0.53 | 0.000 | 0.41 | 0.31 | 0.52 | 0.000 | 0.30 | 0.13 | 0.48 | 0.001 | 0.24 | 0.08 | 0.40 | 0.003 |
| Cohort (year) | ||||||||||||||||
| 1917-1921 | 0.53 | 0.23 | 0.84 | 0.001 | 0.62 | 0.38 | 0.86 | 0.000 | 1.05 | 0.68 | 1.42 | 0.000 | 1.29 | 0.96 | 1.62 | 0.000 |
| 1922-1926 | 0.59 | 0.34 | 0.85 | 0.000 | 0.69 | 0.49 | 0.90 | 0.000 | 1.06 | 0.75 | 1.37 | 0.000 | 1.22 | 0.94 | 1.50 | 0.000 |
| 1927-1931 | 0.66 | 0.44 | 0.88 | 0.000 | 0.76 | 0.58 | 0.94 | 0.000 | 1.03 | 0.76 | 1.30 | 0.000 | 1.14 | 0.90 | 1.38 | 0.000 |
| 1932-1936 | 0.69 | 0.49 | 0.89 | 0.000 | 0.76 | 0.59 | 0.92 | 0.000 | 0.95 | 0.71 | 1.20 | 0.000 | 1.01 | 0.80 | 1.23 | 0.000 |
| 1937-1941 | 0.66 | 0.47 | 0.86 | 0.000 | 0.70 | 0.54 | 0.86 | 0.000 | 0.84 | 0.60 | 1.07 | 0.000 | 0.84 | 0.63 | 1.05 | 0.000 |
| 1942-1946 | 0.54 | 0.34 | 0.74 | 0.000 | 0.55 | 0.39 | 0.72 | 0.000 | 0.67 | 0.43 | 0.91 | 0.000 | 0.64 | 0.43 | 0.86 | 0.000 |
| 1947-1951 | 0.49 | 0.26 | 0.71 | 0.000 | 0.53 | 0.35 | 0.72 | 0.000 | 0.47 | 0.20 | 0.74 | 0.001 | 0.44 | 0.19 | 0.68 | 0.000 |
| 1952-1956 | 0.53 | 0.27 | 0.78 | 0.000 | 0.61 | 0.40 | 0.81 | 0.000 | 0.23 | -0.09 | 0.54 | 0.161 | 0.21 | -0.07 | 0.50 | 0.137 |
| 1957-1961 | 0.37 | 0.07 | 0.67 | 0.014 | 0.46 | 0.23 | 0.70 | 0.000 | 0.08 | -0.29 | 0.44 | 0.688 | 0.05 | -0.28 | 0.38 | 0.768 |
| 1962-1966 | 0.10 | -0.25 | 0.45 | 0.566 | 0.14 | -0.13 | 0.42 | 0.311 | -0.03 | -0.45 | 0.40 | 0.895 | -0.14 | -0.52 | 0.25 | 0.482 |
| 1967-1971 | 0.07 | -0.32 | 0.46 | 0.719 | 0.13 | -0.18 | 0.44 | 0.411 | -0.25 | -0.74 | 0.24 | 0.312 | -0.43 | -0.88 | 0.02 | 0.062 |
| 1972-1976 | -0.21 | -0.66 | 0.24 | 0.369 | -0.22 | -0.58 | 0.14 | 0.233 | -0.59 | -1.16 | -0.02 | 0.044 | -0.78 | -1.32 | -0.24 | 0.004 |
| 1977-1981 | -0.54 | -1.10 | 0.03 | 0.062 | -0.68 | -1.15 | -0.22 | 0.004 | -0.86 | -1.56 | -0.16 | 0.016 | -0.99 | -1.66 | -0.32 | 0.004 |
| 1982-1986 | -0.79 | -1.50 | -0.07 | 0.031 | -0.93 | -1.52 | -0.34 | 0.002 | -1.01 | -1.90 | -0.12 | 0.027 | -0.99 | -1.84 | -0.15 | 0.021 |
| 1987-1991 | -0.95 | -1.83 | -0.06 | 0.037 | -1.08 | -1.81 | -0.35 | 0.004 | -1.07 | -2.29 | 0.14 | 0.083 | -1.03 | -2.17 | 0.11 | 0.077 |
| 1992-1996 | -1.18 | -2.48 | 0.12 | 0.075 | -1.27 | -2.33 | -0.21 | 0.018 | -1.20 | -3.12 | 0.71 | 0.217 | -1.12 | -2.81 | 0.57 | 0.192 |
| 1997-2001 | -1.58 | -4.60 | 1.45 | 0.307 | -1.78 | -4.41 | 0.85 | 0.184 | -1.35 | -5.42 | 2.71 | 0.514 | -1.37 | -4.94 | 2.21 | 0.454 |
| Constance | 2.68 | 2.47 | 2.90 | 0.000 | 3.36 | 3.17 | 3.54 | 0.000 | 3.04 | 2.75 | 3.33 | 0.000 | 3.35 | 3.09 | 3.60 | 0.000 |
APC model, Age-Period-Cohort model; Coef: coefficient; CI: confidence interval; LL: Lower limit; UL: Upper limit.
Table 3.
APC model analysis of TBL cancer mortality females and males in both countries
| Mortality | China | The United States | ||||||||||||||
|---|---|---|---|---|---|---|---|---|---|---|---|---|---|---|---|---|
|
|
|
|||||||||||||||
| Female | Male | Female | Male | |||||||||||||
|
|
|
|
|
|||||||||||||
| Coef.† | 95% CI† | p-value | Coef. | 95% CI | p-value | Coef. | 95% CI | p-value | Coef. | 95% CI | p-value | |||||
|
|
|
|
|
|||||||||||||
| LL† | UL† | LL | UL | LL | UL | LL | UL | |||||||||
| Age (years) | ||||||||||||||||
| 20-24 | -2.51 | -3.67 | -1.35 | 0.000 | -2.74 | -3.72 | -1.76 | 0.000 | -3.58 | -5.71 | -1.45 | 0.001 | -3.55 | -5.28 | -1.82 | 0.000 |
| 25-29 | -1.92 | -2.68 | -1.17 | 0.000 | -2.12 | -2.73 | -1.51 | 0.000 | -2.96 | -4.34 | -1.59 | 0.000 | -3.04 | -4.24 | -1.84 | 0.000 |
| 30-34 | -1.33 | -1.90 | -0.77 | 0.000 | -1.52 | -1.97 | -1.07 | 0.000 | -1.99 | -2.88 | -1.10 | 0.000 | -2.22 | -3.03 | -1.40 | 0.000 |
| 35-39 | -1.01 | -1.48 | -0.55 | 0.000 | -1.19 | -1.56 | -0.83 | 0.000 | -1.10 | -1.74 | -0.46 | 0.001 | -1.32 | -1.90 | -0.75 | 0.000 |
| 40-44 | -0.44 | -0.80 | -0.09 | 0.013 | -0.55 | -0.82 | -0.28 | 0.000 | -0.29 | -0.78 | 0.20 | 0.242 | -0.44 | -0.87 | -0.01 | 0.045 |
| 45-49 | -0.02 | -0.30 | 0.26 | 0.869 | -0.08 | -0.29 | 0.13 | 0.456 | 0.34 | -0.04 | 0.72 | 0.077 | 0.31 | -0.02 | 0.64 | 0.064 |
| 50-54 | 0.32 | 0.09 | 0.54 | 0.006 | 0.41 | 0.24 | 0.58 | 0.000 | 0.86 | 0.56 | 1.15 | 0.000 | 0.91 | 0.66 | 1.17 | 0.000 |
| 55-59 | 0.63 | 0.44 | 0.81 | 0.000 | 0.80 | 0.66 | 0.93 | 0.000 | 1.26 | 1.02 | 1.49 | 0.000 | 1.38 | 1.18 | 1.58 | 0.000 |
| 60-64 | 1.08 | 0.92 | 1.24 | 0.000 | 1.28 | 1.16 | 1.39 | 0.000 | 1.58 | 1.38 | 1.79 | 0.000 | 1.72 | 1.55 | 1.90 | 0.000 |
| 65-69 | 1.44 | 1.28 | 1.61 | 0.000 | 1.64 | 1.51 | 1.76 | 0.000 | 1.83 | 1.61 | 2.06 | 0.000 | 1.96 | 1.78 | 2.15 | 0.000 |
| 70-74 | 1.77 | 1.58 | 1.96 | 0.000 | 1.96 | 1.81 | 2.11 | 0.000 | 2.00 | 1.72 | 2.27 | 0.000 | 2.11 | 1.88 | 2.35 | 0.000 |
| 75-79 | 2.01 | 1.77 | 2.25 | 0.000 | 2.13 | 1.94 | 2.31 | 0.000 | 2.06 | 1.70 | 2.41 | 0.000 | 2.17 | 1.87 | 2.47 | 0.000 |
| Period (year) | ||||||||||||||||
| 1992 | -0.18 | -0.35 | 0.00 | 0.044 | -0.24 | -0.38 | -0.11 | 0.000 | -0.29 | -0.54 | -0.04 | 0.021 | -0.16 | -0.37 | 0.06 | 0.154 |
| 1997 | -0.13 | -0.26 | -0.01 | 0.031 | -0.20 | -0.29 | -0.11 | 0.000 | -0.15 | -0.30 | 0.01 | 0.059 | -0.09 | -0.22 | 0.04 | 0.176 |
| 2002 | -0.07 | -0.16 | 0.01 | 0.097 | -0.07 | -0.12 | -0.01 | 0.021 | -0.03 | -0.10 | 0.05 | 0.455 | -0.03 | -0.09 | 0.04 | 0.415 |
| 2007 | -0.03 | -0.11 | 0.06 | 0.545 | 0.00 | -0.06 | 0.06 | 0.946 | 0.06 | -0.02 | 0.13 | 0.156 | 0.00 | -0.06 | 0.06 | 0.986 |
| 2012 | 0.12 | 0.00 | 0.24 | 0.054 | 0.18 | 0.09 | 0.27 | 0.000 | 0.12 | -0.03 | 0.28 | 0.126 | 0.04 | -0.09 | 0.18 | 0.553 |
| 2017 | 0.30 | 0.13 | 0.46 | 0.000 | 0.32 | 0.19 | 0.45 | 0.000 | 0.29 | 0.05 | 0.54 | 0.020 | 0.23 | 0.02 | 0.44 | 0.033 |
| Cohort (year) | ||||||||||||||||
| 1917-1921 | 0.63 | 0.26 | 1.00 | 0.001 | 0.74 | 0.45 | 1.03 | 0.000 | 1.14 | 0.62 | 1.66 | 0.000 | 1.39 | 0.95 | 1.83 | 0.000 |
| 1922-1926 | 0.68 | 0.37 | 0.99 | 0.000 | 0.79 | 0.54 | 1.04 | 0.000 | 1.14 | 0.70 | 1.59 | 0.000 | 1.30 | 0.92 | 1.67 | 0.000 |
| 1927-1931 | 0.74 | 0.46 | 1.01 | 0.000 | 0.84 | 0.62 | 1.07 | 0.000 | 1.11 | 0.72 | 1.49 | 0.000 | 1.21 | 0.89 | 1.53 | 0.000 |
| 1932-1936 | 0.75 | 0.50 | 1.01 | 0.000 | 0.82 | 0.62 | 1.03 | 0.000 | 1.03 | 0.68 | 1.38 | 0.000 | 1.07 | 0.79 | 1.36 | 0.000 |
| 1937-1941 | 0.71 | 0.46 | 0.96 | 0.000 | 0.75 | 0.54 | 0.95 | 0.000 | 0.90 | 0.57 | 1.23 | 0.000 | 0.89 | 0.61 | 1.16 | 0.000 |
| 1942-1946 | 0.59 | 0.33 | 0.84 | 0.000 | 0.58 | 0.37 | 0.79 | 0.000 | 0.72 | 0.37 | 1.06 | 0.000 | 0.67 | 0.39 | 0.96 | 0.000 |
| 1947-1951 | 0.52 | 0.23 | 0.80 | 0.000 | 0.54 | 0.31 | 0.77 | 0.000 | 0.51 | 0.12 | 0.89 | 0.010 | 0.45 | 0.13 | 0.77 | 0.006 |
| 1952-1956 | 0.54 | 0.22 | 0.86 | 0.001 | 0.59 | 0.33 | 0.85 | 0.000 | 0.24 | -0.20 | 0.69 | 0.284 | 0.21 | -0.16 | 0.59 | 0.260 |
| 1957-1961 | 0.37 | 0.00 | 0.75 | 0.049 | 0.44 | 0.14 | 0.74 | 0.004 | 0.07 | -0.44 | 0.59 | 0.779 | 0.04 | -0.39 | 0.48 | 0.848 |
| 1962-1966 | 0.09 | -0.35 | 0.52 | 0.687 | 0.12 | -0.22 | 0.47 | 0.489 | -0.05 | -0.64 | 0.55 | 0.881 | -0.16 | -0.67 | 0.35 | 0.549 |
| 1967-1971 | 0.06 | -0.43 | 0.54 | 0.824 | 0.12 | -0.27 | 0.51 | 0.546 | -0.28 | -0.98 | 0.41 | 0.419 | -0.46 | -1.05 | 0.14 | 0.133 |
| 1972-1976 | -0.23 | -0.79 | 0.34 | 0.430 | -0.24 | -0.69 | 0.21 | 0.301 | -0.63 | -1.44 | 0.17 | 0.125 | -0.81 | -1.52 | -0.11 | 0.024 |
| 1977-1981 | -0.58 | -1.28 | 0.13 | 0.109 | -0.71 | -1.28 | -0.13 | 0.016 | -0.91 | -1.90 | 0.07 | 0.068 | -1.03 | -1.91 | -0.15 | 0.021 |
| 1982-1986 | -0.83 | -1.73 | 0.08 | 0.073 | -0.98 | -1.73 | -0.23 | 0.010 | -1.08 | -2.35 | 0.19 | 0.096 | -1.05 | -2.18 | 0.08 | 0.067 |
| 1987-1991 | -1.03 | -2.21 | 0.15 | 0.087 | -1.16 | -2.13 | -0.19 | 0.019 | -1.15 | -2.93 | 0.63 | 0.205 | -1.09 | -2.66 | 0.47 | 0.172 |
| 1992-1996 | -1.29 | -3.06 | 0.49 | 0.155 | -1.38 | -2.81 | 0.06 | 0.060 | -1.29 | -4.16 | 1.57 | 0.376 | -1.20 | -3.57 | 1.17 | 0.322 |
| 1997-2001 | -1.72 | -5.71 | 2.27 | 0.398 | -1.88 | -5.28 | 1.51 | 0.277 | -1.46 | -7.25 | 4.34 | 0.622 | -1.44 | -6.21 | 3.32 | 0.553 |
| Constance | 2.46 | 2.17 | 2.75 | 0.000 | 3.15 | 2.91 | 3.39 | 0.000 | 2.58 | 2.16 | 3.00 | 0.000 | 2.98 | 2.63 | 3.33 | 0.000 |
APC model, Age-Period-Cohort model; Coef: coefficient; CI: confidence interval; LL: Lower limit; UL: Upper limit.
The coefficient of age effect in USA was lower than that in China before the age of 40-44 years, but thereafter it reversed. The coefficients of morbidity approached gradually for males and females, while the coefficients of mortality had intersection at age of 75-79 (Figures 9A and 10A).
Figure 9.
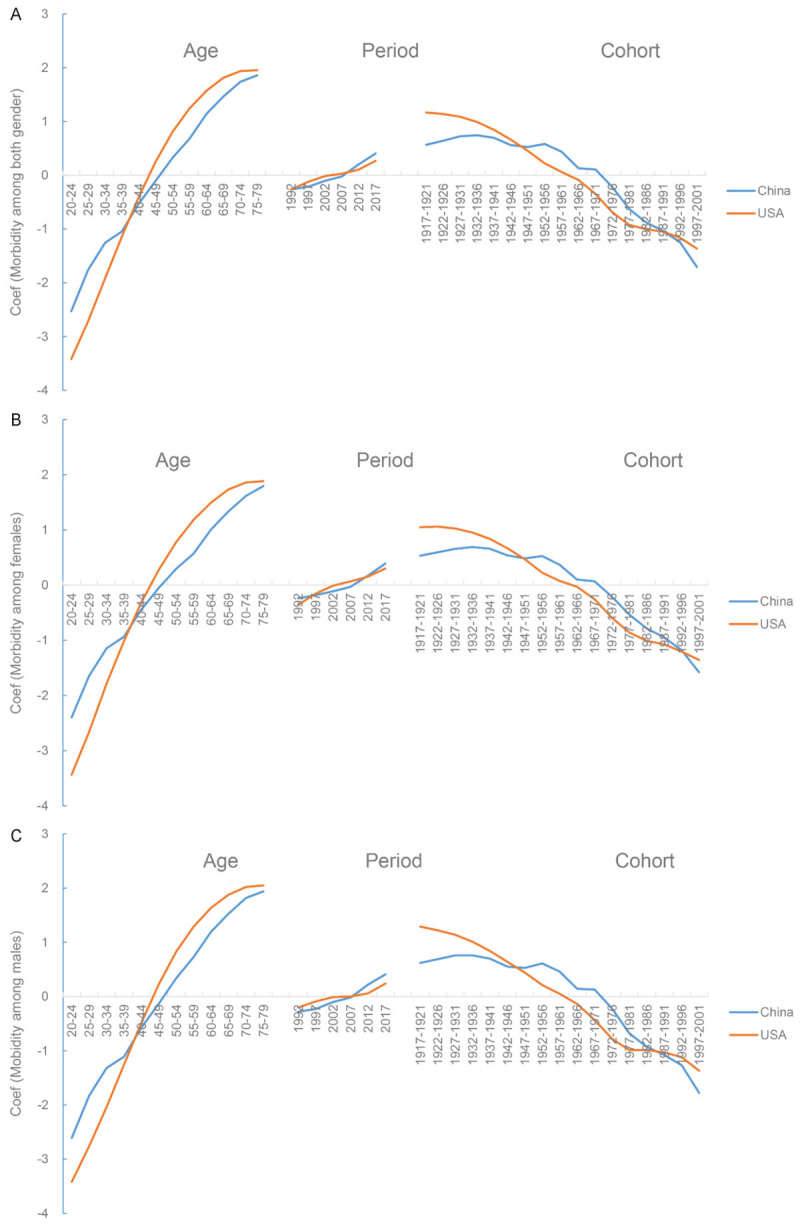
Comparison of APC model analysis on TBL cancer morbidity risk between China and USA. A. Both gender; B. Females; C. Males. APC model, Age-Period-Cohort Model.
Figure 10.
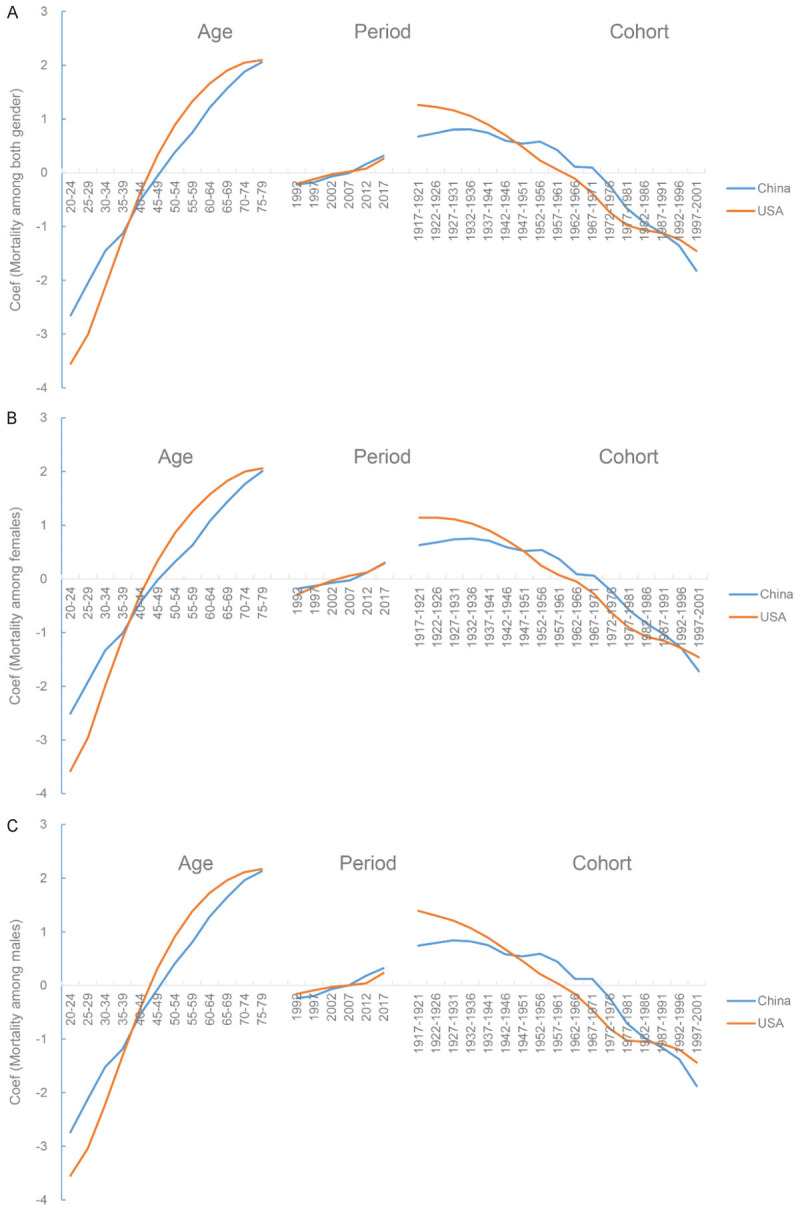
Comparison of APC model analysis on TBL cancer mortality risk between China and USA. A. Both gender; B. Females; C. Males. APC model, Age-Period-Cohort Model.
The coefficient of period effect had two cross points for morbidity in 1992 and 2007, two cross points for mortality in 1997 and 2012 among females (Figures 9B and 10B), and one cross point for both measures in 2007 among males (Figures 9C and 10C). Additionally, two intersections for males (cohort 1947-1951 and 1987-1991) and two intersections for females (cohort 1947-1951 and 1992-1996) were observed. The coefficient of cohort effect was lower in USA than that in China; but the trends were reversed before 1947-1951 and after 1987-1991 (Figures 9 and 10).
The coefficient of age effect (positive) was higher for males than females in both countries (Figure 11). After 2002, the coefficient of period effect was higher for men than women in China, but it reversed in USA. There were two cross points in the cohort 1937-1941 and 1982-1986 in USA. In China, the coefficient of cohort effect was higher in men than women before cohort of 1972-1976, but thereafter the trend reversed.
Figure 11.
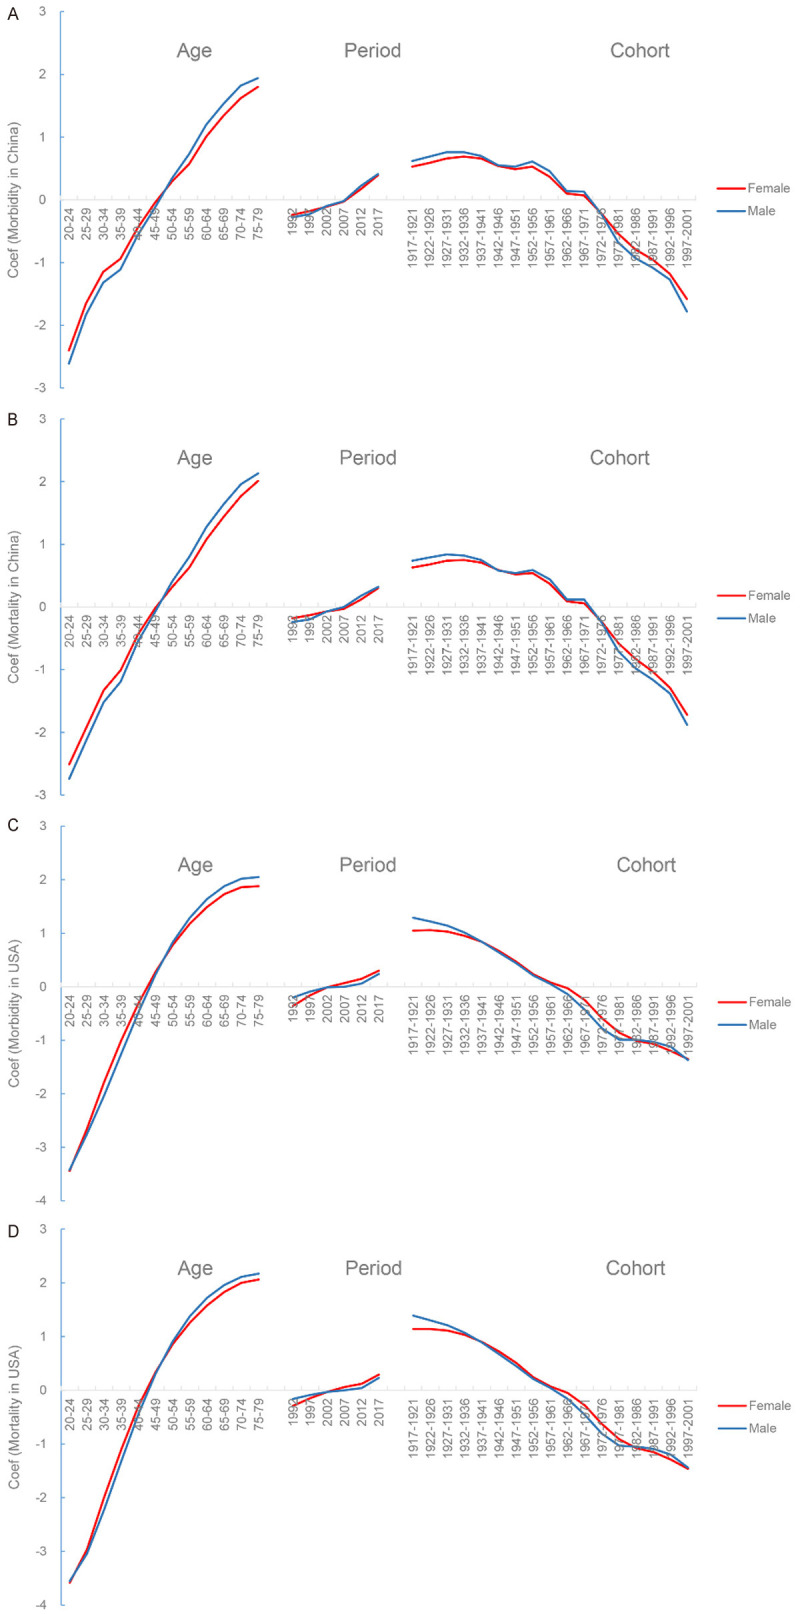
Comparison of APC model analysis on TBL cancer morbidity and mortality risk between females and males. A. Morbidity in China; B. Mortality in China; C. Morbidity in USA; D. Mortality in USA. APC model, Age-Period-Cohort Model.
Discussion
This study estimated the TBL cancer burden disparities between China and USA. Based on GBD 2017 data, the burden of TBL cancer in both countries increased over time, but increments varied widely. The growth rate of incident cases, deaths, and DALYs in China ranged from 140% to 240%, whereas they ranged from 12% to 42% in USA, which might result from the improved diagnostic techniques, aging population and the development of treatments. As for the difference between the genders, TBL cancer burden differed slightly in China, whereas it was much heavier for females in American than males over past 28 years. However, males contributed the majority of TBL cancer burden in all age groups, which is contrary to previous study [20].
After subgroup analysis of age, only in age group of 70+ years, incident cases in USA increased, whereas DALYs and deaths increased mainly in people aged 50+ years. In China, the TBL cancer burden increased in all age groups except for incident cases of 15-49 years. This might result from growth patterns and demographic differences between the two countries and improvement of medical care in China. Generally, the morbidity, mortality, and DALY rate of TBL cancer in China increased over 28 years, but they decreased in USA. The gender variation of ASIR and ASDR in USA is larger than that in China, whereas the variation of age-standardized DALY Rate was significant in China, mirroring the gap between the two countries in the treatment and management of cancer patients. In USA and China, there existed large rural-urban differences in cancer burden all the time. In rural areas, residents lived in poverty are more likely to smoking and lack the opportunity to be screened for cancer [21,22].
All risk factors related ASDR and DALY rates increased with age. In our analysis, tobacco remained the leading risk factor of TBL cancer deaths and DALYs in two countries. However, the variation trend of tobacco-related cancer burden in two countries was different: it kept growing in China but remained decreasing in USA, which reminds us that tobacco control policies and punishment management in China should be further strengthened. Besides, efforts should be intensified to advocate the harm of tobacco and smoking cessation, especially in active smoking. In China, one million a year of premature deaths were linked to direct exposure to tobacco [23]. More than 80 percent of lung cancer morbidity in USA was linked to smoking, but the causes were various, including a range of cultural, environmental, educational, economic, health and lifestyle variables [24]. Compared with other risk factors, smoking exerted a significant cumulative effect on death and DALY rates in American females. Therefore, it is necessary to stick to current tobacco control policies in USA, and pay more attention to female smoking.
Air pollution plays a key role in TBL cancer burden of Chinese women, followed by a low diet in fruits. The age-standardized death and DALY rates of TBL cancer attributed to air pollution gradually decreased in China, heavier in women than men. Therefore, control of air pollution in China needs to be strengthened, especially for ambient particulate matter pollution. Level of air pollution in USA and Europe is much lower than in China [25]. Although urbanization provided more medical opportunities for Chinese, a host of health risk factors followed, including ambient air pollution, occupational hazards, and poor diet [26]. Outdoor air pollution has become the fourth leading death risk factor in China, resulting in 1.2 million premature deaths [27]. Meanwhile, in rural China, many households still use solid fuels for cooking and heating, which further aggravates air pollution [23]. PM2.5 could enter lung tissues and the blood, making ambient air pollution a risk factor for diseases [28,29], which suggests that the government should improve the population’s health knowledge, and adopt compulsory tobacco control policies. The shortage of human resources is the main obstacle which China faced with in strengthening primary health care. Despite health reforms in 2009, China’s rapid economic growth did not bring about the health improvements as it deserved. China’s traditional economy relies on coal and heavy industries, and pollution might be improved with the economy transitions in the future [30-32].
The prominent effect of occupational carcinogens on death and DALYs reminds us that the quality of the occupational environment for American men needs to be improved. Meanwhile, fasting glucose is also a risk factor for death and DALYs. And its impact on TBL cancer death and DALYs began to increase since 2000. High fasting plasma glucose caused a higher age-standardized death and DALY rate in USA than that in China, which is consistent with the previous studies [33]. Both two countries have to strengthen diabetes screening and blood sugar management. Reducing the effects of poor diet, smoking, and fasting blood glucose on the population, as well as controlling environmental and household air pollution, would be public policy priorities for TBL cancer prevention and treatment in China.
The APC analysis indicated that the tendency of morbidity and mortality of TBL cancer increased with age in both countries. As for period trends, the morbidity and mortality of people aged 60+ years increased with time in China, whereas that of people for all age groups in USA decreased since 1998, which was similar to cohort trends. The younger the population, the less influence of birth cohort and time effect on morbidity and mortality. Age effect played a key role in TBL cancer morbidity and mortality and the risk increased with age. The period effect might derive from screening methods, medical technology applications, and even changes in disease classification criteria. The cohort effect is influenced by factors such as group lifestyle, external environment, and exposure to risk factors. Compared with age and period effect, the cohort effect has more macroscopic significance in public health.
There are some limitations inevitably in our analysis. Data of TBL cancer disease burden cannot be 100% covered in the two countries, thus information bias is inevitable. The estimation of the APC and Joinpoint models selected the node data of period, age, and cohort, which has some deviation from the actual situation. The risk factors of incidence were lacking due to limited data. In addition, specific disease data for each district of the two countries were lacked, so urban and rural data were not separated. This study provides extensive guidance to the prevention and treatment policies of TBL cancer in China and USA, but the data in urban and rural areas need to be further improved.
Conclusion
In conclusion, China and USA accounted for half of the TBL cancer burden worldwide. ASRs of TBL cancer increased in China, but decreased in USA. Tobacco remained the top risk factor of death and DALYs in both countries. The policy should be tilted towards air pollution and a diet low in fruits in China, as well as occupational carcinogens and high fasting plasma glucose in USA. Healthcare reform in both countries should focus on planning how its health system could effectively prevent and manage TBL cancer at low cost.
Acknowledgements
The authors would like to sincerely thank the GBD study for data sharing.
Disclosure of conflict of interest
None.
Abbreviations
- AAPC
Average annual percent change
- APC
Annual percent change
- ASR
age-standardized rate
- ASIR
age standardized incidence rate
- ASDR
age standardized death rate
- APC model
Age-Period-Cohort model
- CI
confidence interval
- Coef
coefficient
- DALY
disability adjusted life-year
- GHDx
Global Health Data Exchange
- LL
Lower limit
- SDI
socio-demographic index
- TBL cancer
Tracheal, bronchus, and lung cancer
- UI
uncertainty interval
- UL
Upper limit
References
- 1.GBD 2017 Disease and Injury Incidence and Prevalence Collaborators. Global, regional, and national incidence, prevalence, and years lived with disability for 354 diseases and injuries for 195 countries and territories, 1990-2017: a systematic analysis for the Global Burden of Disease Study 2017. Lancet. 2018;392:1789–1858. doi: 10.1016/S0140-6736(18)32279-7. [DOI] [PMC free article] [PubMed] [Google Scholar]
- 2.Bray F, Ferlay J, Soerjomataram I, Siegel RL, Torre LA, Jemal A. Global cancer statistics 2018: GLOBOCAN estimates of incidence and mortality worldwide for 36 cancers in 185 countries. CA Cancer J Clin. 2018;68:394–424. doi: 10.3322/caac.21492. [DOI] [PubMed] [Google Scholar]
- 3.Zhou M, Wang H, Zeng X, Yin P, Zhu J, Chen W, Li X, Wang L, Wang L, Liu Y, Liu J, Zhang M, Qi J, Yu S, Afshin A, Gakidou E, Glenn S, Krish VS, Miller-Petrie MK, Mountjoy-Venning WC, Mullany EC, Redford SB, Liu H, Naghavi M, Hay SI, Wang L, Murray CJL, Liang X. Mortality, morbidity, and risk factors in China and its provinces, 1990-2017: a systematic analysis for the Global Burden of Disease Study 2017. Lancet. 2019;394:1145–1158. doi: 10.1016/S0140-6736(19)30427-1. [DOI] [PMC free article] [PubMed] [Google Scholar]
- 4.US Burden of Disease Collaborators. Mokdad AH, Ballestros K, Echko M, Glenn S, Olsen HE, Mullany E, Lee A, Khan AR, Ahmadi A, Ferrari AJ, Kasaeian A, Werdecker A, Carter A, Zipkin B, Sartorius B, Serdar B, Sykes BL, Troeger C, Fitzmaurice C, Rehm CD, Santomauro D, Kim D, Colombara D, Schwebel DC, Tsoi D, Kolte D, Nsoesie E, Nichols E, Oren E, Charlson FJ, Patton GC, Roth GA, Hosgood HD, Whiteford HA, Kyu H, Erskine HE, Huang H, Martopullo I, Singh JA, Nachega JB, Sanabria JR, Abbas K, Ong K, Tabb K, Krohn KJ, Cornaby L, Degenhardt L, Moses M, Farvid M, Griswold M, Criqui M, Bell M, Nguyen M, Wallin M, Mirarefin M, Qorbani M, Younis M, Fullman N, Liu P, Briant P, Gona P, Havmoller R, Leung R, Kimokoti R, Bazargan-Hejazi S, Hay SI, Yadgir S, Biryukov S, Vollset SE, Alam T, Frank T, Farid T, Miller T, Vos T, Bärnighausen T, Gebrehiwot TT, Yano Y, Al-Aly Z, Mehari A, Handal A, Kandel A, Anderson B, Biroscak B, Mozaffarian D, Dorsey ER, Ding EL, Park EK, Wagner G, Hu G, Chen H, Sunshine JE, Khubchandani J, Leasher J, Leung J, Salomon J, Unutzer J, Cahill L, Cooper L, Horino M, Brauer M, Breitborde N, Hotez P, Topor-Madry R, Soneji S, Stranges S, James S, Amrock S, Jayaraman S, Patel T, Akinyemiju T, Skirbekk V, Kinfu Y, Bhutta Z, Jonas JB, Murray CJL. The State of US health, 1990-2016 burden of diseases, injuries, and risk factors among US States. JAMA. 2018;319:1444–1472. doi: 10.1001/jama.2018.0158. [DOI] [PMC free article] [PubMed] [Google Scholar]
- 5.Yang G, Wang Y, Zeng Y, Gao GF, Liang X, Zhou M, Wan X, Yu S, Jiang Y, Naghavi M, Vos T, Wang H, Lopez AD, Murray CJ. Rapid health transition in China, 1990-2010: findings from the Global Burden of Disease Study 2010. Lancet. 2013;381:1987–2015. doi: 10.1016/S0140-6736(13)61097-1. [DOI] [PMC free article] [PubMed] [Google Scholar]
- 6.Kutzin J. Health financing for universal coverage and health system performance: concepts and implications for policy. Bull World Health Organ. 2013;91:602–611. doi: 10.2471/BLT.12.113985. [DOI] [PMC free article] [PubMed] [Google Scholar]
- 7.Deng Y, Zhao P, Zhou L, Xiang D, Hu J, Liu Y, Ruan J, Ye X, Zheng Y, Yao J, Zhai Z, Wang S, Yang S, Wu Y, Li N, Xu P, Zhang D, Kang H, Lyu J, Dai Z. Epidemiological trends of tracheal, bronchus, and lung cancer at the global, regional, and national levels: a population-based study. J Hematol Oncol. 2020;13:98. doi: 10.1186/s13045-020-00915-0. [DOI] [PMC free article] [PubMed] [Google Scholar]
- 8.Wong TJ, King JL, Pomeranz JL. Cultural variation in antismoking video ads between the United States, Taiwan, and China. Health Educ Res. 2016;31:603–613. doi: 10.1093/her/cyw034. [DOI] [PubMed] [Google Scholar]
- 9.Molina JR, Yang P, Cassivi SD, Schild SE, Adjei AA. Non-small cell lung cancer: epidemiology, risk factors, treatment, and survivorship. Mayo Clin Proc. 2008;83:584–594. doi: 10.4065/83.5.584. [DOI] [PMC free article] [PubMed] [Google Scholar]
- 10.Stenberg K, Hanssen O, Edejer TT, Bertram M, Brindley C, Meshreky A, Rosen JE, Stover J, Verboom P, Sanders R, Soucat A. Financing transformative health systems towards achievement of the health sustainable development goals: a model for projected resource needs in 67 low-income and middle-income countries. Lancet Glob Health. 2017;5:e875–e887. doi: 10.1016/S2214-109X(17)30263-2. [DOI] [PMC free article] [PubMed] [Google Scholar]
- 11.Deng Y, Li H, Wang M, Li N, Tian T, Wu Y, Xu P, Yang S, Zhai Z, Zhou L, Hao Q, Song D, Jin T, Lyu J, Dai Z. Global burden of thyroid cancer from 1990 to 2017. JAMA Netw Open. 2020;3:e208759. doi: 10.1001/jamanetworkopen.2020.8759. [DOI] [PMC free article] [PubMed] [Google Scholar]
- 12.Li N, Deng Y, Zhou L, Tian T, Yang S, Wu Y, Zheng Y, Zhai Z, Hao Q, Song D, Zhang D, Kang H, Dai Z. Global burden of breast cancer and attributable risk factors in 195 countries and territories, from 1990 to 2017: results from the Global Burden of Disease Study 2017. J Hematol Oncol. 2019;12:140. doi: 10.1186/s13045-019-0828-0. [DOI] [PMC free article] [PubMed] [Google Scholar]
- 13.Zhai Z, Zheng Y, Li N, Deng Y, Zhou L, Tian T, Yang S, Hao Q, Song D, Wu Y, Zhang D, Wang Z, Dai Z. Incidence and disease burden of prostate cancer from 1990 to 2017: results from the Global Burden of Disease Study 2017. Cancer. 2020;126:1969–1978. doi: 10.1002/cncr.32733. [DOI] [PubMed] [Google Scholar]
- 14.Zhou L, Deng Y, Li N, Zheng Y, Tian T, Zhai Z, Yang S, Hao Q, Wu Y, Song D, Zhang D, Lyu J, Dai Z. Global, regional, and national burden of Hodgkin lymphoma from 1990 to 2017: estimates from the 2017 Global Burden of Disease study. J Hematol Oncol. 2019;12:107. doi: 10.1186/s13045-019-0799-1. [DOI] [PMC free article] [PubMed] [Google Scholar]
- 15.Deng Y, Wang M, Zhou L, Zheng Y, Li N, Tian T, Zhai Z, Yang S, Hao Q, Wu Y, Song D, Zhang D, Lyu J, Dai Z. Global burden of larynx cancer, 1990-2017: estimates from the global burden of disease 2017 study. Aging (Albany NY) 2020;12:2545–2583. doi: 10.18632/aging.102762. [DOI] [PMC free article] [PubMed] [Google Scholar]
- 16.Kim HJ, Fay MP, Feuer EJ, Midthune DN. Permutation tests for joinpoint regression with applications to cancer rates. Stat Med. 2000;19:335–51. doi: 10.1002/(sici)1097-0258(20000215)19:3<335::aid-sim336>3.0.co;2-z. [DOI] [PubMed] [Google Scholar]
- 17.Fu WJJ. Ridge estimator in singular design with application to age-period-cohort analysis of disease rates. Commun Stat Theory Methods. 2000;29:263–278. [Google Scholar]
- 18.Yang Y, Schulhofer-Wohl S, Fu WJ, Land KC. The intrinsic estimator for age-period-cohort analysis: what it is and how to use it. Am J Sociol. 2008;113:1697–1736. [Google Scholar]
- 19.Luo LY. Assessing validity and application scope of the intrinsic estimator approach to the age-period-cohort problem. Demography. 2013;50:1945–1967. doi: 10.1007/s13524-013-0243-z. [DOI] [PMC free article] [PubMed] [Google Scholar]
- 20.Jemal A, Miller KD, Ma J, Siegel RL, Fedewa SA, Islami F, Devesa SS, Thun MJ. Higher lung cancer incidence in young women than young men in the United States. N Engl J Med. 2018;378:1999–2009. doi: 10.1056/NEJMoa1715907. [DOI] [PMC free article] [PubMed] [Google Scholar]
- 21.Zahnd WE, James AS, Jenkins WD, Izadi SR, Fogleman AJ, Steward DE, Colditz GA, Brard L. Rural-urban differences in cancer incidence and trends in the United States. Cancer Epidemiol Biomarkers Prev. 2018;27:1265–1274. doi: 10.1158/1055-9965.EPI-17-0430. [DOI] [PMC free article] [PubMed] [Google Scholar]
- 22.Chen W, Zheng R, Baade PD, Zhang S, Zeng H, Bray F, Jemal A, Yu XQ, He J. Cancer statistics in China, 2015. CA Cancer J Clin. 2016;66:115–132. doi: 10.3322/caac.21338. [DOI] [PubMed] [Google Scholar]
- 23.Ouyang Y. The respiratory landscape in China: a focus on air pollution. Lancet Respir Med. 2017;5:16–17. doi: 10.1016/S2213-2600(16)30445-3. [DOI] [PubMed] [Google Scholar]
- 24.Kerry R, Goovaerts P, Ingram B, Tereault C. Spatial analysis of lung cancer mortality in the American West to improve allocation of medical resources. Applied Spatial Analysis and Policy 28 [Google Scholar]
- 25.Bell GA, Brauer M. Divining the future of AIR POLLUTIOn in China: huge gains in health can be achieved, but much work remains. Circulation. 2017;136:1585–1587. doi: 10.1161/CIRCULATIONAHA.117.029380. [DOI] [PubMed] [Google Scholar]
- 26.Gong P, Liang S, Carlton EJ, Jiang Q, Wu J, Wang L, Remais JV. Urbanisation and health in China. Lancet. 2012;379:843–852. doi: 10.1016/S0140-6736(11)61878-3. [DOI] [PMC free article] [PubMed] [Google Scholar]
- 27.Ji JS. Air pollution and China’s ageing society. Lancet Public Health. 2018;3:e457–e458. doi: 10.1016/S2468-2667(18)30179-8. [DOI] [PubMed] [Google Scholar]
- 28.Chen R, Yin P, Meng X, Liu C, Wang L, Xu X, Ross JA, Tse LA, Zhao Z, Kan H, Zhou M. Fine particulate air pollution and daily mortality. A nationwide analysis in 272 Chinese cities. Am J Respir Crit Care Med. 2017;196:73–81. doi: 10.1164/rccm.201609-1862OC. [DOI] [PubMed] [Google Scholar]
- 29.Yu Q, Gao B, Li G, Zhang Y, He Q, Deng W, Huang Z, Ding X, Hu Q, Huang Z, Wang Y, Bi X, Wang X. Attributing risk burden of PM2.5-bound polycyclic aromatic hydrocarbons to major emission sources: case study in Guangzhou, South China. Atmospheric Environment. 2016;142:313–323. [Google Scholar]
- 30.Li X, Lu J, Hu S, Cheng KK, De Maeseneer J, Meng Q, Mossialos E, Xu DR, Yip W, Zhang H, Krumholz HM, Jiang L, Hu S. The primary health-care system in China. Lancet. 2017;390:2584–2594. doi: 10.1016/S0140-6736(17)33109-4. [DOI] [PubMed] [Google Scholar]
- 31.Liu GG, Vortherms SA, Hong X. China’s health reform update. In: Fielding JE, editor. Annu Rev Public Health. 2017. pp. 431–448. [DOI] [PubMed] [Google Scholar]
- 32.Ta YQ, Zhu YS, Fu HQ. Trends in access to health services, financial protection and satisfaction between 2010 and 2016: has China achieved the goals of its health system reform? Soc Sci Med. 2020;245:112715. doi: 10.1016/j.socscimed.2019.112715. [DOI] [PubMed] [Google Scholar]
- 33.Bergamino M, Rullan AJ, Saigi M, Peiro I, Montanya E, Palmero R, Carlos Ruffinelli J, Navarro A, Dolores Arnaiz M, Brao I, Aso S, Padrones S, Cardenal F, Nadal E. Fasting plasma glucose is an independent predictor of survival in patients with locally advanced non-small cell lung cancer treated with concurrent chemoradiotherapy. BMC Cancer. 2019;19:165. doi: 10.1186/s12885-019-5370-5. [DOI] [PMC free article] [PubMed] [Google Scholar]


