

Abstract
The levels of serum IL-6, IL-10, and TNF-α in patients with systemic lupus erythematosus (SLE) and their value in clinical practice were studied. A total of 68 patients with active SLE treated in our hospital between March 2015 and January 2018 were enrolled into the active SLE group, and they were divided into three groups according to the mild, moderate, and heavy active periods, and also divided into two groups according to the positive and negative anti dsDNA. A total of 60 healthy individuals in the same period were included in the control group (con group). The levels of serum IL-6, IL-10, and TNF-α in all participants were detected via an enzyme-linked immunosorbent assay (ELISA), and the correlation of these values with SLE activity was analyzed. The independent prognostic factors were analyzed through multivariate logistic regression. It was found that the levels of serum IL-6, IL-10, and TNF-α in the SLE groups were all higher than those in the control group; the levels of the inflammatory markers in the severe active SLE group were higher than those in the mild and moderate active SLE groups, and the levels in the moderate active SLE group were higher than those in the mild active SLE group. Additionally, the anti dsDNA positive group showed much higher levels of these than the anti dsDNA negative group. Pearson correlation analysis revealed a positive correlation between anti dsDNA antibody and IL-6, IL-10, and TNF-α levels. The multivariate logistic regression results, the mean course of disease and IL-10 were independent prognostic factors of SLE. The abnormal secretion of peripheral blood cytokines in SLE patients can affect the prognosis of the disease. Monitoring serum cytokines is helpful to understand the activity and prognosis of patients with lupus and guide clinical treatment.
Keywords: Systemic lupus erythematosus, IL-6, IL-10, TNF-α, clinical value
Introduction
At present, the incidence of systemic lupus erythematosus (SLE) is rising annually worldwide. SLE is more common in females, and it is concentrated during youth and middle-aged [1,2]. Clinically, the etiology of SLE is not clear, and there is evidence that different environments, genetics and estrogen have different degrees of influence on the disease [3]. SLE is an autoimmune disease with long-term attack. The deposition of antibodies and immune complex, the necrosis of blood vessel walls and a series of inflammatory reactions are caused by the increase of autoantibodies such as anti-nuclear antibody, which eventually leads to damage of important organs in the body [4,5]. SLE is usually treated through hormone drug therapy. After treatment, the condition of SLE patients can be significantly improved. However, due to the long-term use of hormone drugs, many complications occur, and the immune ability of the body is also affected, resulting in infections, renal failure and early-onset vascular sclerosis, and cardiovascular and cerebrovascular damage; leading to poor prognosis and increased mortality of SLE patients [6,7]. Research has found that the pathogenesis and treatment of SLE were closely related to the body’s immune function. The change of immune function in the body greatly controls the disease trends of SLE patients.
Interleukin-6 (IL-6) is a cell factor secreted by monocyte macrophages, which promotes the differentiation of B cells. It can induce B cells to produce immunoglobulins and participate in the development of inflammatory responses [8]. Interleukin-10 (IL-10) is a pleiotropic cytokine with double mechanisms of immune-stimulation and inhibition. With different degrees of expression, it plays different roles in SLE patients, mainly by affecting B cell differentiation, apoptosis and production of autoantibodies. Tumor necrosis factor-α (TNF-α) can stimulate inflammatory factors such as interleukins to secrete by acting on immunocompetent cells. TNF-α can also induce expression of intercellular adhesion molecule-1 (ICAM-1) in vascular endothelial cells to complete adhesion, causing leukocyte aggregation and adhesion to damage vascular endothelial cells [10]. The above three kinds of factors play their respective functions in the body’s immune function and regulate the development of the disease and prognosis of patients with abnormal immune function. Therefore, this study explored the changes in serum level IL-6, IL-10, and TNF-α in SLE patients and their clinical value.
Data and methods
General information
A total of 68 active SLE patients admitted to Hangzhou Jianggan District People’s Hospital from March 2015 to January 2018 were selected as the SLE active group. They were divided into three groups according to mild, moderate, and severe active periods and two groups according to anti dsDNA positive and negative. A total of 60 healthy subjects in the same period were taken as control group (con group). On the basis of the criteria of systemic lupus erythematosus disease activity score (SLEDAI) [11], SLE patients were divided into inactive stage according to ≤ 5 points; SLE patients with ≥ 5 points were divided into active stage according to the criteria. They were then divided into 5 points for mild, 6-7 points for moderate and 8 points for severe. According to the double stranded DNA (DS DNA) antibody, SLE patients were divided into Anti DS DNA antibody positive and anti DS DNA antibody negative groups. The active SLE group consisted of 25 cases in the mild active SLE group, 19 cases in the moderate active SLE group, 24 cases in the severe active SLE group, 32 cases in the anti DS DNA positive group, and 36 cases in the anti DS DNA negative group, including 56 males and 72 females, with a median age of (48.40±10.67) years. No significant difference was seen in age and sex between SLE patients and con group.
Inclusion exclusion criteria
Inclusion criteria: Patients meeting the diagnostic criteria of American College Rheumatology SLE [12]. Exclusion criteria: (1) patients with liver or kidney dysfunction; (2) patients with other connective tissue diseases; (3) patients with coagulation dysfunction; (4) patients with cognitive or communication disorders; and (5) those with poor compliance. All patients and their families signed an informed consent after understanding the study, and the experiment was carried out with approval from the medical ethics committee of Hangzhou Jianggan District People’s Hospital.
Experimental reagents and materials
EDTA anticoagulant tubes were purchased from Guangzhou Bangbiao Medical Equipment Co., Ltd.; serum separator was purchased from Beckman Company in the United States; ELISA kit was purchased from Shanghai Jingkang Bioengineering Co., Ltd.
Test method
Fasting elbow venous blood (3 ml) was sampled from SLE patients and controls in the early morning. After 2 hours of standing at room temperature in EDTA anticoagulation, the upper serum was subjected to 3000 R/min centrifugation for 10 min and saved in a -80°C freezer. Serum IL-6, IL-10 and TNF-α were detected under the instructions of the ELISA kit. The detection of anti DS DNA antibody, lupus erythematosus activity index, as well as other related laboratory tests in SLE patients were completed by the clinical laboratory and the Department of Microbial Immunology of our hospital.
Observation indicators
(1) Comparison of serum cytokine levels in SLE patients of different severities; (2) comparison of the levels in anti DS DNA positive and negative groups; (3) analysis on the correlation between the anti DS DNA antibody levels of SLE patients with anti DS DNA positive and the IL-6, IL-10, and TNF-α levels; (4) based on the best cut-off values of IL-6, IL-10, and TNF-α in SLE patients in each activity group, they were assigned to high and low expression groups. Based on the 3-month prognosis, the patients were assigned to good prognosis and unfavorable prognosis groups. The independent prognostic factors were analyzed by multivariate logistic regression.
Statistical methods
In this experiment, SPSS 19.0 statistical software (net times Technology Co., Ltd., Beijing, China) was employed for analysis on the experimental data, and chi square test was applied for data counting. The quantitative data were represented as the mean ± standard deviation. T test was adopted for inter-group comparison, and repeated measurement analysis was used for multi-group comparison. Multivariate logistic regression was carried out for analysis on the independent prognostic factors of SLE patients. In this experiment, we used Graphpad prism 8 to illustrate figures, and P < 0.05 indicated a significant difference.
Results
Comparison of serum cytokine levels in SLE patients with different severities
SLE patients showed higher levels of serum IL-6, IL-10, and TNF-α levels than the con group (P < 0.05). Patients with severe SLE activity showed higher levels of the cytokines than patients with mild or moderate LSE activity; patients with moderate SLE activity showed higher levels than patients with mild SLE activity (P < 0.05) Table 1 and Figures 1 and 2.
Table 1.
Comparison of serum cytokine levels in SLE patients in different severity
| Groups | Cases/n | IL-6 (ng/L) | IL-10 (ng/L) | TNF-α (ng/L) |
|---|---|---|---|---|
| SLE mild activity group | 25 | 9.34±2.13* | 26.25±5.24* | 14.35±5.38* |
| SLE moderate activity group | 19 | 13.04±2.77*,** | 31.35±6.83*,** | 20.92±5.57*,** |
| SLE severe activity group | 24 | 16.15±3.37*,**,*** | 38.65±7.11*,**,*** | 28.45±6.01*,**,*** |
| SLE activity group | 68 | 13.63±5.74* | 32.53±12.36* | 21.43±11.26* |
| con group | 60 | 5.44±1.48 | 17.39±4.27 | 7.45±3.59 |
indicates P < 0.05 vs. the con group;
indicates P < 0.05 vs. the SLE mild activity group;
represents P < 0.05 vs. the SLE severe activity group.
Figure 1.

Comparison of serum cytokine levels between patients in active SLE group and con group. A. SLE patients presented higher serum IL-6 levels than the con group. B. SLE patients presented higher serum IL-10 levels than the con group. C. SLE patients showed higher serum TNF-α levels than the con group. Note: * represents P < 0.05.
Figure 2.

Comparison of serum cytokine levels in SLE patients of different severity. A. Patients with severe SLE activity showed higher serum IL-6 levels than patients with moderate or mild SLE activity, and patients with moderate SLE activity showed higher serum IL-6 levels than patients with mild SLE activity. B. Patients with severe SLE activity showed higher IL-10 levels than patients with moderate or mild SLE activity, and patients with moderate SLE activity showed higher IL-10 levels than patients with mild SLE activity. C. Patients with severe SLE activity showed higher serum TNF-α levels than patients with moderate or mild SLE activity, and patients with moderate SLE activity showed higher serum TNF-α levels than those with mild SLE activity. Note: * represents P < 0.05.
Comparison of serum cytokines between the positive and negative anti DS DNA groups in SLE patients
The anti DS DNA positive group showed higher IL-6, IL-10 and TNF-α levels than the anti DS DNA negative group (P < 0.05) Table 2 and Figure 3.
Table 2.
Comparison in detection levels of serum cytokines between positive and negative anti DS DNA groups in SLE patients
| Group | Cases/n | IL-6 (ng/L) | IL-10 (ng/L) | TNF-α (ng/L) |
|---|---|---|---|---|
| Anti DS DNA positive group | 32 | 15.48±3.47* | 36.75±6.43* | 27.32±5.94* |
| Anti DS DNA negative group | 36 | 10.36±2.67 | 28.48±5.53 | 15.93±5.35 |
represents P < 0.05 vs. the anti dsDNA negative group.
Figure 3.

Comparison of serum cytokines between positive and negative anti DS DNA groups in SLE patients. A. The anti DS DNA positive group showed higher IL-6 levels than the anti DS DNA negative group. B. The anti DS DNA positive group showed higher IL-10 levels than that the anti DS DNA negative group. C. The anti DS DNA positive group showed higher TNF-α levels than the anti DS DNA negative group. Note: * represents P < 0.05.
Correlation analysis of serum cytokines and anti DS DNA antibody
Pearson correlation analysis revealed that there was a positive relationship between anti DS DNA antibodies and IL-6, IL-10, and TNF-α levels (r = 0.5633, r = 0.5589, r = 0.6379, all P < 0.001) Figure 4.
Figure 4.
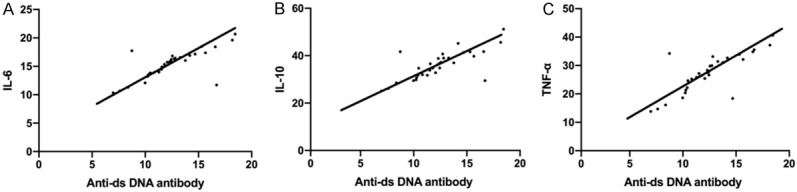
Correlation analysis between serum cytokine level and anti DS DNA antibody. A. Pearson correlation analysis revealed a positive relation between anti DS DNA antibody and IL-6 expression (r = 0.5633, P < 0.001). B. Anti DS DNA antibody and IL-10 expression (r = 0.5589, P < 0.001). C. Anti DS DNA antibody and TNF-α level (r = 0.6379, P < 0.001).
Univariate analysis of patients’ prognosis
According to the prognosis of SLE patients within 3 months, the patients with fever, rash and other clinical signs and symptoms that were improved were divided into good prognosis group (n = 42). The patients with fever, rash and other clinical symptoms and signs without improvement were divided into poor prognosis group (n = 26). The clinical data of SLE patients were gathered and the optimal critical value of each index was selected for single factor analysis. The results showed that there was no difference in sex and smoking and drinking history between the two groups (P > 0.05), but there were remarkable difference in age, BMI, average course of disease, IL-6, IL-10 and TNF-α between them (all P < 0.05) Table 3.
Table 3.
Single factor analysis [n (%)]
| Clinicopathological features | Good prognosis group (n = 42) | Poor prognosis group (n = 26) | X2 value | P value |
|---|---|---|---|---|
| Age | 5.635 | 0.018 | ||
| < 48 | 25 (59.52) | 9 (34.62) | ||
| ≥ 48 | 17 (40.48) | 17 (65.38) | ||
| Gender | 0.027 | 0.869 | ||
| male | 17 (40.48) | 10 (38.46) | ||
| female | 25 (59.52) | 16 (61.54) | ||
| BMI (kg/m2) | 4.317 | 0.038 | ||
| ≤ 23 | 27 (64.29) | 10 (38.46) | ||
| > 23 | 15 (35.71) | 16 (61.54) | ||
| Average duration (month) | 4.484 | 0.034 | ||
| ≤ 42 | 24 (57.14) | 8 (30.77) | ||
| > 42 | 18 (42.86) | 18 (69.23) | ||
| Smoking history (cases) | 0.476 | 0.490 | ||
| Yes | 19 (45.24) | 14 (53.85) | ||
| No | 23 (54.76) | 12 (46.15) | ||
| Drinking history (cases) | 0.183 | 0.669 | ||
| Yes | 22 (52.38) | 15 (57.69) | ||
| No | 20 (47.62) | 11 (42.31) | ||
| IL-6 (ng/L) | 4.741 | 0.030 | ||
| ≤ 13 | 29 (69.05) | 11 (42.31) | ||
| > 13 | 13 (30.95) | 15 (57.69) | ||
| IL-10 (ng/L) | 3.985 | 0.046 | ||
| ≤ 32 | 25 (59.52) | 9 (34.62) | ||
| > 32 | 17 (40.48) | 17 (65.38) | ||
| TNF-α (ng/L) | 5.182 | 0.023 | ||
| ≤ 21 | 28 (66.67) | 10 (38.46) | ||
| > 21 | 14 (33.33) | 16 (61.54) |
Multivariate analysis on survival
We assignmened indexes with differences in univariate analysis (See Table 4 for the assignment), and then proceeded forward to conduct a multivariate logistic regression analysis. It came out that age, BMI, IL-6, TNF-α were not independent prognostic factors of patients, while the average duration (or: 1.349, 95% CI: 1.102~1.654), and IL-10 (or: 1.794, 95% CI: 1.083~3.164) were independent prognostic factors of patients. See Table 5.
Table 4.
Assignment table
| Factor | Assignment |
|---|---|
| Age | < 48 = 1, ≥ 48 = 0 |
| BMI | < 23 = 1, ≥ 23 = 0 |
| Average course of disease | ≤ 42 = 1, > 42 = 0 |
| IL-6 | < 13 = 1, ≥ 13 = 0 |
| IL-10 | < 32 = 1, ≥ 32 = 0 |
| TNF-alpha | < 21 = 1, ≥ 21 = 0 |
| Prognosis | Good prognosis = 1, poor prognosis = 0 |
Table 5.
Multi factor analysis
| Factor | B | Wals | Sig. | Exp (B) | EXP (B) 95% C.I. | |
|---|---|---|---|---|---|---|
|
| ||||||
| lower limit | Upper limit | |||||
| Age | 0.921 | 2.102 | 0.061 | 1.023 | 0.746 | 4.323 |
| BMI | 0.923 | 1.894 | 0.067 | 1.013 | 0.659 | 3.747 |
| Average course of disease | 0.303 | 8.904 | 0.004 | 1.349 | 1.102 | 1.654 |
| IL-6 | 0.623 | 3.672 | 0.055 | 1.879 | 0.992 | 3.542 |
| IL-10 | 0.582 | 5.813 | 0.016 | 1.794 | 1.083 | 3.164 |
| TNF-α | 0.462 | 0.539 | 0.462 | 1.588 | 0.466 | 5.413 |
Note: B: constant term, Se: standard deviation, SIG: P value, exp (b): odds ratio, 95% C.I. of exp (b): 95% confidence interval of odds ratio.
Discussion
Early onset of SLE in patients may result in repeated fever or low fever for a long time, pain and soreness of joints and general tiredness after exertion, and patients with different constitutions have different degrees of digestive system symptoms, and the overall performance is similar to cold symptoms [13,14]. With untimely treatment or improper treatment, patients with aggravation of the disease will have punctate hemorrhaging, ulcers or even erosion of oral mucosa, typical Butterfly erythema on the face, and serious damage to the heart, kidneys and other important organs [15,16]. With a pathogenesis that is related to the immune system, SLE can activate the immune complex and complement system, and combine with antigens to form a complex. They are deposited in glomeruli, joints and other different tissue sites, causing acute or chronic inflammatory changes in the body, thus causing multiple organ functional damage. The process of the disease has great influence on the production of autoantibodies and the amount of interleukin [17,18]. There is no specific plan to cure SLE. People mainly regulate the progress of the disease through conservative treatment, and the main therapeutic effect requires anti-inflammation, relieving acute attacks and improving symptoms [19,20]. In order to study a more suitable treatment plan for SLE patients, we statistically analyzed serum IL-6, IL-10, TNF-α levels in SLE patients, and analyzed the levels in different active stages of SLE patients to determine whether there is prognostic value.
We found that SLE patients showed significantly higher IL-6, IL-10 and TNF-α levels than the con group, and patients with severe SLE activity showed significantly higher levels than those with moderate or mild SLE activity, and patients with moderate SLE activity showed significantly higher levels than those with mild SLE activity. Studies have shown that [21,22], SLE is an autoimmune disease, which is usually mediated by Th2 cytokines; and IL-6, IL-10 are important Th2 cytokines, which can affect the secretion and function of a variety of cells. It has been confirmed that [23], endogenous immune complexes stimulate the activity of plasma like dendritic cells, a large number of dendritic cells promote the secretion and synthesis of TNF-α, and regulate the immune system in vivo leading to SLE. The higher the activity index is, the worse the prognosis is. The results showed that with the increase of the activity index, the expression of serum IL-6, IL-10 and TNF-α elevated. With the aim of further exploring the changes of these three factors in SLE patients, we compared the expression of these three factors in anti DS DNA positive and negative environments, finding that the anti DS DNA positive group presented with significantly higher IL-6, IL-10, and TNF-α levels than the anti DS DNA negative group. Previous studies have revealed that anti dsDNA antibodies are one of the indicators for clinical diagnosis of SLE, which is of great importance for the diagnosis and prognosis evaluation of SLE. From our study, it seems that the level of detection factors in the anti DS DNA positive group is higher, which proves that the severity of SLE is inextricably related to the detection factors in this experiment. The specific observation of Pearson correlation analysis revealed a positive correlation between anti DS DNA antibodies and serum IL-6, IL-10, TNF-α levels in SLE patients (r = 0.5633, r = 0.5589, r = 0.6379, all P < 0.001). It has been reported in the literature [24-26] that by detecting serum IL-6 in SLE patients, it was significantly increased, and was positively related to the SLE activity and the anti DS DNA antibody level in serum. It has also been reported in the literature [27,28] that the IL-10 level in serum and peripheral blood mononuclear cell culture supernatant of SLE patients was generally elevated, and was related to disease activity. It has also been reported that IFN-α can promote the generation of IL-10 by activated CD4+ T cells and monocytes, and there is an interaction between the IL-10 and IFN-α levels. This further explained that the interaction trend of the detection factors and anti dsDNA antibodies in SLE patients is positive, and that positive interaction can predict the development of SLE. At last, the influencing factors of SLE prognosis were further explored. Single factor analysis revealed that there were no differences in sex, smoking history and drinking history between the two groups, but remarkable differences were found in age, BMI, average course of disease, IL-6, IL-10 and TNF-α. The multivariate logistic regression analysis revealed that age, BMI, IL-6, TNF-α were not independent prognostic factors, while the mean course of disease (or: 1.349, 95% CI: 1.102-1.654), and IL-10 (or: 1.794, 95% CI: 1.083-3.164) were independent prognostic factors.
To sum up, the abnormal secretion of IL-6, IL-10 and TNF-α in SLE patients’ peripheral serum can affect the prognosis of the disease. Monitoring serum cytokines can help to understand the activity and prognosis of lupus patients to guide clinical treatment. However, there are still some deficiencies in this study. First, this study only explores the correlation of anti DS DNA antibodies with the detection factors in this experiment, and does not explore the correlation between other autoantibodies that are detected in SLE disease. Secondly, there is little literature about whether detection factors are prognostic factors for SLE, which needs to be further studied in the follow-up experiments.
Disclosure of conflict of interest
None.
References
- 1.Huang YF, Chang YS, Chen WS, Tsao YP, Wang WH, Liao HT, Tsai CY, Lai CC. Incidence and risk factors of osteomyelitis in adult and pediatric systemic lupus erythematosus: a nationwide, population-based cohort study. Lupus. 2019;28:19–26. doi: 10.1177/0961203318811601. [DOI] [PubMed] [Google Scholar]
- 2.Mangus CW, Fatusin O, Ngo TL. Acute-onset chest pain in a 17-year-old female adolescent with systemic lupus erythematosus. Pediatr Emerg Care. 2017;33:346–349. doi: 10.1097/PEC.0000000000001122. [DOI] [PubMed] [Google Scholar]
- 3.Salem TB, Tougorti M, Naceur l. AB0492 mortality in systemic lupus erythematosus: causes and risk factors in a group of tunisian patients. Ann Rheum Dis. 2016;75(Suppl 2):1074.1–1074. [Google Scholar]
- 4.Thanadetsuntorn C, Ngamjanyaporn P, Setthaudom C, Hodge K, Saengpiya N, Pisitkun P. The model of circulating immune complexes and interleukin-6 improves the prediction of disease activity in systemic lupus erythematosus. Sci Rep. 2018;8:2620. doi: 10.1038/s41598-018-20947-4. [DOI] [PMC free article] [PubMed] [Google Scholar]
- 5.Burg N, Swendeman S, Worgall S, Hla T, Salmon JE. Sphingosine 1-phosphate receptor 1 signaling maintains endothelial cell barrier function and protects against immune complex-induced vascular injury. Arthritis Rheumatol. 2018;70:1879–1889. doi: 10.1002/art.40558. [DOI] [PMC free article] [PubMed] [Google Scholar]
- 6.Jguirim M, Jbeli A, Brahim HB, Mhenni A, Youssef M, Touzi M, Zrour S, Bejia I, Bergaoui N. Systemic lupus erythematosus induced by isoniazid: a rare complication to fear. Pan Afr Med J. 2015;20:181. doi: 10.11604/pamj.2015.20.181.5470. [DOI] [PMC free article] [PubMed] [Google Scholar]
- 7.Khattri S, Kushawaha A, Dahal K, Lee M, Mobarakai N. Isoniazid (INH)-induced eosinophilic exudative pleural effusion and lupus erythematosus. A clinical reminder of drug side effects. Bull NYU Hosp Jt Dis. 2011;69:181–184. [PubMed] [Google Scholar]
- 8.Kuret T, Lakota K, Mali P, Cucnik S, Praprotnik S, Tomsic M, Sodin-Semrl S. Naturally occurring antibodies against serum amyloid A reduce IL-6 release from peripheral blood mononuclear cells. PLoS One. 2018;13:e0195346. doi: 10.1371/journal.pone.0195346. [DOI] [PMC free article] [PubMed] [Google Scholar]
- 9.O’Garra A, Barrat FJ. In vitro generation of IL-10-producing regulatory CD4+ T cells is induced by immunosuppressive drugs and inhibited by Th1- and Th2-inducing cytokines. Immunol Lett. 2003;85:135–139. doi: 10.1016/s0165-2478(02)00239-0. [DOI] [PubMed] [Google Scholar]
- 10.Martinesi M, Bruni S, Stio M. 1,25-Dihydroxyvitamin D3 inhibits tumor necrosis factor-β-induced adhesion molecule expression in endothelial cells. Cell Biol Int. 2013;30:365–375. doi: 10.1016/j.cellbi.2006.01.004. [DOI] [PubMed] [Google Scholar]
- 11.Yell JA, Allen J, Wojnarowska F, Kirtschig G, Burge SM. Bullous systemic lupus erythematosus: revised criteria for diagnosis. Br J Dermatol. 1995;132:921–928. doi: 10.1111/j.1365-2133.1995.tb16950.x. [DOI] [PubMed] [Google Scholar]
- 12.Hochberg MC. Updating the American College of Rheumatology revised criteria for the classification of systemic lupus erythematosus. Arthritis Rheum. 1997;40:1725. doi: 10.1002/art.1780400928. [DOI] [PubMed] [Google Scholar]
- 13.Aljohani R, Gladman DD, Su J, Urowitz MB. Disease evolution in late-onset and early-onset systemic lupus erythematosus. Lupus. 2017;26:1190–1196. doi: 10.1177/0961203317696593. [DOI] [PubMed] [Google Scholar]
- 14.Sebastiani GD, Prevete I, Piga M, Iuliano A, Bettio S, Bortoluzzi A, Coladonato L, Tani C, Spinelli FR, Fineschi I, Mathieu A. Early Lupus Project - a multicentre Italian study on systemic lupus erythematosus of recent onset. Lupus. 2015;24:1276–1282. doi: 10.1177/0961203315585817. [DOI] [PubMed] [Google Scholar]
- 15.Khatibi M, Shakoorpour AH, Jahromi ZM, Ahmadzadeh A. The prevalence of oral mucosal lesions and related factors in 188 patients with systemic lupus erythematosus. Lupus. 2012;21:1312–1315. doi: 10.1177/0961203312454589. [DOI] [PubMed] [Google Scholar]
- 16.Levy JL. Intense pulsed light treatment for chronic facial erythema of systemic lupus erythematosus: a case report. J Cutan Laser Ther. 2000;2:195–198. doi: 10.1080/146288300750163772. [DOI] [PubMed] [Google Scholar]
- 17.McCloskey O, Maxwell AP. Diagnosis and management of nephrotic syndrome. Practitioner. 2017;261:11–15. [PubMed] [Google Scholar]
- 18.Hagiwara E, Gourley MF, Lee S, Klinman DK. Disease severity in patients with systemic lupus erythematosus correlates with an increased ratio of interleukin-10: interferon-gamma-secreting cells in the peripheral blood. Arthritis Rheum. 1996;39:379–385. doi: 10.1002/art.1780390305. [DOI] [PubMed] [Google Scholar]
- 19.Mansour HE, Arafa SG, Shehata WA. Systemic lupus erythematosus with inflammatory bowel disease-ulcerative colitis: case report. Lupus. 2018;27:1198–1201. doi: 10.1177/0961203317751857. [DOI] [PubMed] [Google Scholar]
- 20.Welsh RC, Rahbar H, Foerster B, Thurnher M, Sundgren PC. Brain diffusivity in patients with neuropsychiatric systemic lupus erythematosus with new acute neurological symptoms. J Magn Reson Imaging. 2007;26:541–551. doi: 10.1002/jmri.21036. [DOI] [PubMed] [Google Scholar]
- 21.Ankathatti Munegowda M, Xu S, Freywald A, Xiang J. CD4+ Th2 cells function alike effector Tr1 and Th1 cells through the deletion of a single cytokine IL-6 and IL-10 gene. Mol Immunol. 2012;51:143–149. doi: 10.1016/j.molimm.2012.02.120. [DOI] [PubMed] [Google Scholar]
- 22.Sher A, Fiorentino D, Caspar P, Pearce E, Mosmann T. Production of IL-10 by CD4+ T lymphocytes correlates with down-regulation of Th1 cytokine synthesis in helminth infection. J Immunol. 1991;147:2713–2716. [PubMed] [Google Scholar]
- 23.Zhong W, Jiang Z, Wu J, Jiang Y, Zhao L. CCR6(+) Th cell distribution differentiates systemic lupus erythematosus patients based on anti-dsDNA antibody status. PeerJ. 2018;6:e4294. doi: 10.7717/peerj.4294. [DOI] [PMC free article] [PubMed] [Google Scholar]
- 24.Zen M, Bassi N, Nalotto L, Canova M, Bettio S, Gatto M, Ghirardello A, Iaccarino L, Punzi L, Doria A. Disease activity patterns in a monocentric cohort of SLE patients: a seven-year follow-up study. Clin Exp Rheumatol. 2012;30:856–863. [PubMed] [Google Scholar]
- 25.Ripley BJ, Goncalves B, Isenberg DA, Latchman DS, Rahman A. Raised levels of interleukin 6 in systemic lupus erythematosus correlate with anaemia. Ann Rheum Dis. 2005;64:849–853. doi: 10.1136/ard.2004.022681. [DOI] [PMC free article] [PubMed] [Google Scholar]
- 26.Sabry A, Sheashaa H, El-Husseini A, Mahmoud K, Eldahshan KF, George SK, Abdel-Khalek E, El-Shafey EM, Abo-Zenah H. Proinflammatory cytokines (TNF-alpha and IL-6) in Egyptian patients with SLE: its correlation with disease activity. Cytokine. 2006;35:148–153. doi: 10.1016/j.cyto.2006.07.023. [DOI] [PubMed] [Google Scholar]
- 27.Miret C, Font J, Molina R, Garcia-Carrasco M, Filella X, Ramos M, Cervera R, Ballesta A, Ingelmo M. Relationship of oncogenes (sFas, Bcl-2) and cytokines (IL-10, alfa-TNF) with the activity of systemic lupus erythematosus. Anticancer Res. 2001;21:3053–3059. [PubMed] [Google Scholar]
- 28.Aman MJ, Tretter T, Eisenbeis I, Bug G, Decker T, Aulitzky WE, Tilg H, Huber C, Peschel C. Interferon-alpha stimulates production of interleukin-10 in activated CD4+ T cells and monocytes. Blood. 1996;87:4731–4736. [PubMed] [Google Scholar]