

Abstract
Background:
Radiation pneumonitis (RP) is a dose-limiting toxicity in lung cancer radiotherapy (RT). As risk factors in the development of RP, patient and tumor characteristics, dosimetric parameters, and treatment features are intertwined, and it is not always possible to associate RP with a single parameter. This study aimed to determine the algorithm that most accurately predicted RP development with machine learning.
Methods:
Of the 197 cases diagnosed with stage III lung cancer and underwent RT and chemotherapy between 2014 and 2020, 193 were evaluated. The CTCAE 5.0 grading system was used for the RP evaluation. Synthetic minority oversampling technique was used to create a balanced data set. Logistic regression, artificial neural networks, eXtreme Gradient Boosting (XGB), Support Vector Machines, Random Forest, Gaussian Naive Bayes and Light Gradient Boosting Machine algorithms were used. After the correlation analysis, a permutation-based method was utilized for as a variable selection.
Results:
RP was seen in 51 of the 193 cases. Parameters affecting RP were determined as, total(t)V5, ipsilateral lung Dmax, contralateral lung Dmax, total lung Dmax, gross tumor volume, number of chemotherapy cycles before RT, tumor size, lymph node localization and asbestos exposure. LGBM was found to be the algorithm that best predicted RP at 85% accuracy (confidence interval: 0.73-0.96), 97% sensitivity, and 50% specificity.
Conclusion:
When the clinical and dosimetric parameters were evaluated together, the LGBM algorithm had the highest accuracy in predicting RP. However, in order to use this algorithm in clinical practice, it is necessary to increase data diversity and the number of patients by sharing data between centers.
Keywords: lung cancer, machine learning, radiation pneumonitis, prediction, radiotherapy
Introduction
Lung cancer is the most common and mortal thoracic malignancy.1 Thoracic radiotherapy (RT) is a part of treatment in approximately 50% of cases diagnosed with lung cancer.2 Radiation pneumonitis (RP) is a potentially dose-limiting and clinically significant toxicity in thoracic RT.3 RP and more subclinical changes occur at a rate of 15-40% in cases receiving concomitant chemotherapy.4-6 Radiation-induced lung injury can cause symptomatic RP and fibrosis. Symptomatic RP is characterized by dyspnea, cough, and sometimes subfebrile fever, which typically occur a few weeks to months after RT.7
Pulmonary effects caused by radiation may vary and include edema, epithelial degeneration and regeneration, endothelial damage, microvascular system disruption and atelectasis. These effects are the result of the induction of free radicals and accompanying oxidative stress. In some cases, this damage cannot be completely repaired, and the tissue enters a progressive process resulting in RP or fibrosis.5,8
Meta-analyses in the literature reveal that the risk factors for patient-related RP are an advanced age, a history of chronic lung disease and diabetes mellitus (DM), low lung function before RT, and a history of smoking. In addition, concomitant chemotherapy, especially carboplatin/paclitaxel has been reported as a risk factor for RP development.9,10 Studies have shown that various dosimetric parameters, such as lung volume receiving 5 Gy (V5), lung volume receiving 60 Gy (V60), and the mean lung dose (MLD) are associated with the development of RP.11-14
Machine learning (ML) is defined as the ability of a machine to learn and predict future events and outcomes based on large data sets. In healthcare, ML aims to improve the interpretation of medical data, thereby accelerating workflow, reducing errors, eliminating unnecessary expenses, and ultimately improving human health. ML has a major impact on the development of new prediction models and calculation tools for cancer diagnosis to improve patient care, in particular for the purposes of patient stratification, disease rating, prognosis, and treatment toxicities.15
As risk factors in the development of RP, patient characteristics, dosimetric parameters, and treatment characteristics are intertwined, and it is not always possible to associate RP with a single parameter. In clinical practice, lung damage does not similarly occur in all patients receiving the same V5-V60 dose or similar chemotherapy. The prediction of patients that will develop RP can reduce hospitalizations and drug use and increase the patient’s quality of life by reducing the toxicity rates. This can also lower healthcare expenditures. The current study aimed to establish a RP prediction model by evaluating patient-treatment characteristics and dosimetric parameters with ML.
Materials and Methods
Patient Characteristics
A total of 197 cases that underwent RT and chemotherapy at the Radiation Oncology and Chest Diseases Department of University Faculty of Medicine between 2014 and 2020 were included in the study, and the data of 193 cases were used to create a balanced data set for the assessment of ML prediction of RP. The inclusion criteria were having histopathologically confirmed lung cancer, having a Karnofsky Performance Status (KPS) score of ≥60, being aged >18 years, completing planned treatment and regularly attending follow-up, and having stage III non-small cell lung cancer (NSCLC) or small cell lung cancer (SCLC) according to the AJCC Staging Manual, 8th edition.16 Patients with a previous diagnosis of lung cancer who had a history of RT and signs of infection at the beginning of treatment were not included in the study. For staging purposes, thorax-abdominal computed tomography (CT)/positron emission tomography (PET)-CT and brain magnetic resonance imaging (MRI) were performed in each patient. After diagnosis, the cases were evaluated in the Lung/Pleural Cancer Council of the university, and the treatment decision of the cases was taken in a multidisciplinary manner. Our study was approved by Eskişehir Osmangazi University Clinical Research Ethics Committee (approval no. E-25403353-050.99-122145). All patients provided written informed consent prior to enrollment in the study.
Treatment Characteristics
The patients were immobilized in the supine position with the hands on the head using T-bar/ Wingboard. A planning CT was taken with a Somatom Definition AS® device using a 3-5 mm cross-sectional slices. The planned CT scans were fused with the PET-CT/thoracic CT obtained at the time of diagnosis and the current thoracic CT performed after chemotherapy if applied before RT. The gross tumor volume (GTV) was determined after fusion. In cases receiving chemotherapy before RT, GTVtumor was determined after chemotherapy and GTVlymph node before chemotherapy. The clinical target volume (CTV) margin was determined according to tumor histopathology, and CTVtumor was recorded as 0.8 cm for adenocarcinoma, 0.6 cm for squamous cell carcinoma, and 0.5 cm for other histologies. CTVlymph node was determined as 0.5 cm. Elective nodal irradiation was not performed. For the planning target volume (PTV), a margin of 0.5 cm was used for CTVtumor and CTVlymph node, and the patients were treated with image-guided radiation therapy. RT was applied at 1.8-2.5 Gy fraction/day (total dose, 45-68 Gy) accompanied by 3-dimensional conformal radiotherapy (3DCRT)/intensity modulated radiation therapy (IMRT)/volumetric modulated arc therapy (VMAT) using the Varian Trilogy®/ TrueBeam® device. Prophylactic cranial RT at 25 Gy (2.5 Gy/day × 10 fractions) was administered to cases with SCLC if they had complete response to treatment.
Taking patient characteristics (age, KPS score, comorbidities, etc.) into account, concomitant chemotherapy was applied to appropriate cases. In NSCLC, cisplatin (40 mg/m2) or paclitaxel (45-50 mg/m2) + carboplatin [area under the curve (AUC): 2] was used on a weekly basis. In SCLC, cisplatin (40 mg/m2) was applied weekly or cisplatin (75 mg/m2) + etoposide (100 mg/m2) once every 21 days. The patients attended the outpatient clinic once a week.
Gemcitabine, paclitaxel or vinorelbine alone or combined with platinum were used in first- and second-line chemotherapy in SCLC. The first-line chemotherapy of adenocarcinoma was undertaken with the same agents mentioned above but pemetrexed was used in second-line chemotherapy. In cases with the epidermal growth factor receptor, anaplastic lymphoma receptor tyrosine kinase gene translocation or ROS proto-oncogene 1 receptor tyrosine kinase gene rearrangement, the first-line chemotherapy was the same as given above while the second-line therapy was performed with a targeted therapeutic agent specific to the genetic modification. In patients with relapse/progressive disease, considering the KPS score and comorbidities, a chemotherapy regimen that had not previously been used was applied, and the decision to continue this therapy was based on patient response. In the treatment of SCLC, etoposide combined with platinum was used as the first-line chemotherapy regimen, and irinotecan or vincristine + cyclophosphamide + adriablastina combination as the second-line regimen in cases that did not respond to treatment or relapsed. No patient received immunotherapy in this study.
Selected Variables
A total of 77 variables were evaluated to assess RP: age, gender, KPS, smoking history, presence of chronic obstructive pulmonary disease, presence of a diabetes mellitus (DM) diagnosis, asbestos exposure, emphysema/interstitial changes before RT, histopathology, tumor location (right upper/middle/lower lobe, left upper and lower lobe), tumor size, central/peripheral localization of the tumor, lymph node localization (mediastinal/hilar/supraclavicular), lymph node involvement (multilevel/single level), T stage, N stage, TNM stage, history of surgery, presence of concomitant chemotherapy, concomitant chemotherapy protocol, number of chemotherapy cycles before RT, GTV, PTV, total RT dose, fraction dose, RT technique, pretreatment serum albumin and hemoglobin values, pretreatment neutrophil/lymphocyte ratio, total lung (t) V5-10-15-20-25-30-35-40-45-50-55-60, t minimum dose (Dmin), t maximum dose (Dmax), mean lung dose (tMLD), ipsilateral lung (i) V5-10-15-20-25-30-35-40-45-50-55-60, iDmin, iDmax, iMLD, contralateral (c) V5-10-15-20-25-30-35-40-45-50-55-60, cDmin, cDmax, cMLD, total lung volume, ipsilateral lung volume, and contralateral lung volume. These variables were identified from those reported as risk factors in RP studies in the literature.9-14 Out of 77 variables, 9 variables affecting RP were selected using the permutation feature importance method. Permutation Feature Importance technique is based on evaluating the importance of each feature individually. Permutation Feature Importance measures the change in prediction quality (measured by the coefficient of determination score decrease) after processing on a single feature vector. The rate of reduction in the coefficient of determination indicates how important the feature is.15 Permutation Feature Importance Plot is given in Figure 1.
Figure 1.

Permutation feature importance plot.
Follow-Up After RT
In the first month after the end of treatment, anamnesis, physical examination, and patient response were evaluated with thoracic CT. The first 3 years, the same evaluation was undertaken every 3 to 6 months, followed by every 6 months in the fourth and fifth years, and once a year thereafter. During routine follow-up, the cases were evaluated in terms of RP based on their complaints, physical examination, and thoracic CT findings. According to the general condition of the patients, their complaints and test results, additional tests (erythrocyte sedimentation rate, C-reactive protein, respiratory function test, etc.) were performed, and the follow-up frequency was increased when necessary.
Evaluation of RP
Various grading systems have been used to evaluate RP.17–19 These grading systems consist of a combination of clinical, functional and radiographic changes that may occur after RT. The most widely used rating system is the Common Terminology Criteria for Adverse Events (CTCAE), version 5.0 published by the National Cancer Institute (Supplementary Table 1).16 Since the current study aimed to evaluate acute RP, the cases with thoracic CT findings and/or symptoms up to the first 3 months after the end of RT were considered to have RP. The patients diagnosed with ≥ grade 2 RP were administered 60-100 mg/day steroids for 2 weeks, with the dose being gradually decreased within 3 to 12 weeks, and they were closely followed up clinically and radiologically. In the presence of CT/lung radiography findings supporting a concurrent infection, broad-spectrum antibiotics were started.
Application of ML and Statistical Analysis
Patients with missing data were excluded from the study. In ML, when the sample sizes of the subgroups of the dependent variable to be predicted are not equal, this results in biased predictions as a result of overfitting. In order to avoid this situation, it is necessary to create a balanced data set.20
The synthetic minority oversampling technique (SMOTE) was used to create a balanced data set. The unbalanced data set problem is that there is no uniform distribution in the label of the target variable. This situation creates difficulties in estimating a grade. Different methods are used to solve this problem. SMOTE is the most preferred method. In SMOTE, each minority class sample is taken and synthetic samples are created by looking at any or all of the k neighbors of this sample. For the attribute to be sampled from the minority class, a sample from the data set according to its closest neighbors and a vector between this sample and one of its closest neighbors is taken. This vector is added to the current data point by multiplying it by a random number between 0 and 1. Thus, an artificial data derived from its close neighbors is provided.21 By applying the SMOTE method, the number of data with RP, which is a minority group, was approximately equal to the number of data without RP. Thus, the number of data was increased and the imbalance was eliminated. There are 154 cases (41 with RP, 113 without RP) in the training data set, and 39 cases (with 10 with RP, 29 without RP) in the test data set. After the SMOTE process, 226 training data (113 RP, 113 RP) were obtained. Results were obtained by applying cross validation (k = 5) to the complete model. The average of 5 success rates and confidence intervals obtained with each algorithm were calculated. With correlation analysis, excessively correlated variables were detected and false high results were prevented.
Independent variables that significantly affect the RP dependent variable were selected by the permutation feature importance method, which is based on a decrease in the model score when a single variable value is randomly shuffled. This process breaks the relationship between the variable and the target; thus, a decrease in the model score indicates the dependence of the model on the feature. This technique can be applied multiple times with different permutations of the variables in the model. Depending on whether the extracted variable affects success, it is removed from the model or remains in the model. When a variable in the model is removed, the success rate is calculated by testing it with all algorithms. This process is repeated (2n-1) times for all subsets except the empty set. Models with the highest results of all algorithms are recorded.15 In the current study, the data set was divided into 2 at a ratio of 80-20 for training and testing. For the training purpose, prediction models were created using the logistic regression (LR), artificial neural networks (ANN)s, eXtreme Gradient Boosting (XGB), support vector machines (SVM), random forest (RF), Gaussian Naive Bayes (GNB), and light gradient boosting machine (LGBM) methods.
LR focuses on predicting the probability of an event based on previous data provided. It is used to close a binary dependent variable. ANNs consist of units arranged in a series of layers, each connected to the layers on the other side. ANNs are inspired by biological systems, such as the brain and how information is processed, and they basically refer to a large number of interconnected process elements that work together to solve specific problems. XGB is an efficient and scalable implementation of the gradient enhancement framework prepared by Friedman. This algorithm includes an efficient linear model solver and a tree learning algorithm.22 XGB supports various objective functions, including regression, classification, and sorting.23 SVM algorithms are controlled learning types that examine information used for categorization and response analysis. RF is a learning method that combines multiple algorithms to produce better results for classification, regression, and other tasks. Decision trees are familiar tools used for medical decision making and resemble a flowchart that guides a reader toward classifying a person as either higher risk or lower risk for an outcome. The 2 most common methods for overcoming the capacity for trees to overfit are gradient boosting machines (GBM) and RF.24 The GNB classifier is based on Bayes’ theorem and classifies each value independently of other values. It allows predicting a category using probability and based on a particular set of properties.25 LGBM is a gradient enhancement framework based on decision trees to increase the efficiency of the model and reduce memory usage.26
In the tests conducted with these models, the model success rates were determined based on the accuracy, sensitivity and specificity values; i.e. confusion matrix metrics, as well as the area under curve (AUC) graph in the receiver operating characteristic (ROC) curve analysis.22 In statistics, the ROC curve is a graphical plot showing the diagnostic ability of a dual classification system, and AUC indicates the classification performance of the constructed model and takes a value between 0 and 1. An AUC value close to 1 means that the classification performance of the model is high.25 In our study, we used the accuracy ratio (Acc), which is a widely adopted success assessment method based on the proportion of true positive and true negative results in the whole number of samples. Error rate refers to the proportion of the miscalculated number of samples (false positive and false negative) in all evaluated samples.27
Statistical analysis and ML algorithm tests were performed using Python software (Python Software Foundation. Python Language Reference, version 3.5. Available at http://www.python.org) and Scikit Learn library.28 All analyses and processes were undertaken using a computer running 64 bit Windows 10 operating system, with technical specifications of Intel Core i7-9750 CPU, 2.6 GHz 12 MB cache and 16 GB 2666 MHz DDR4 RAM.
Results
Patient, Tumor and Treatment Characteristics
The median age was 63 (min: 37-max: 85) years, and the female/male ratio was 11/182. The number of Stage IIIA/IIIB/IIIC cases was 41 (21.2%), 117 (60.6%) and 35 (18.1%), respectively. The median tumor size was 57 (min: 16, max: 125) mm. Patient and tumor characteristics are summarized in Table 1.
Table 1.
Patient and Tumor Characteristics.
| Variable | N (%)/median (max/min) |
|---|---|
| Age, years | 63 (37-85) |
| Gender | |
| Female | 11 (5.6%) |
| Male | 182 (94.3%) |
| KPS score | 80 (60-100) |
| Smoking history | |
| Present | 174 (90.1%) |
| Absent | 19 (9.8%) |
| COPD history | |
| Present | 30 (15.5%) |
| Absent | 163 (84.4%) |
| DM history | |
| Present | 21 (10.8%) |
| Absent | 172 (89.1%) |
| Asbestos exposure | |
| Present | 18 (9.3%) |
| Absent | 175 (90.6%) |
| Emphysema/interstitial changes before RT |
|
| Present | 76 (39.3%) |
| Absent | 117 (60.6%) |
| Histopathology | |
| SCC | 119 (61.6%) |
| Adenocarcinoma | 42 (21.7%) |
| Small cell | 28 (14.5%) |
| NET Sarcomatoid carcinoma |
3 (1.5%) 1 (0.5%) |
| Tumor localization | |
| Right upper | 48 (24.8%) |
| Right middle | 27 (13.9%) |
| Right lower | 35 (18.1%) |
| Left upper | 58 (30.0%) |
| Left lower | 25 (12.9%) |
| Tumor position | |
| Central | 127 (65.8%) |
| Peripheral | 66 (34.1%) |
| Tumor size (mm) | 57 (16-125) |
| Lymph node localization | |
| Mediastinal | 57 (29.5%) |
| Hilar | 18 (9.3%) |
| Mediastinal + hilar | 100 (51.8%) |
| Mediastinal + supraclavicular | 2 (1.0%) |
| Mediastinal + hilar+supraclavicular | 8 (4.1%) |
| Lymph node involvement level | |
| Multilevel | 139 (72%) |
| Single level | 46 (23.8%) |
| T stage | |
| T1 | 4 (2.0%) |
| T2 | 11 (5.6%) |
| T3 | 51 (26.4%) |
| T4 | 127 (65.8%) |
| N stage | |
| N0 | 12 (6.2%) |
| N1 | 16 (8.2%) |
| N2 | 127 (65.8%) |
| N3 | 38 (19.6%) |
| TNM stage | |
| IIIA | 41 (21.2%) |
| IIIB | 117 (60.6%) |
| IIIC | 35 (18.1%) |
| NLR before treatment | 3.0 (0.5-30.8) |
Abbreviations: KPS, Karnofsky Performance Status; COPD, chronic obstructive pulmonary disease; DM, diabetes mellitus; RT, radiotherapy; SCC, squamous cell carcinoma; NET, neuroendocrine tumor, NLR, neutrophil-to-lymphocyte ratio.
The median RT dose was 60 (min: 45, max: 68) Gy, and 117 patients received concomitant chemotherapy. The median GTV was 90 cc (min: 0, max: 540), and the median PTV was 314 cc (min: 72, max: 829). Treatment characteristics are summarized in Table 2.
Table 2.
Treatment Characteristics.
| Variable | N (%) / median (max/min) |
|---|---|
| Surgical history | |
| Present | 16 (8.2%) |
| Absent | 177 (91.7%) |
| RT technique | |
| 3DCRT | 21 (10.8%) |
| IMRT | 42 (21.7%) |
| VMAT | 130 (67.3%) |
| RT dose (Gy) | 60 (45-68) |
| RT fraction dose (Gy) | 2 (1.8- 4) |
| GTV (cc) | 90 (0-540) |
| PTV (cc) | 314 (72-829) |
| Concomitant chemotherapy | |
| Present | 117 (60.6%) |
| Absent | 76 (39.3%) |
| Concomitant chemotherapy protocol | |
| Cisplatin Cisplatin + etoposide |
89 (46.1%) 12 (6.2%) |
| Carboplatin + paclitaxel | 15 (7.7%) |
| Carboplatin + etoposide | 1 (0.5%) |
| Number of chemotherapy cycles before RT | 3 (0-6) |
Abbreviations: 3DCRT, three-dimensional conformal radiotherapy; IMRT; intensity-modulated radiation therapy; VMAT, volumetric modulated arc therapy; RT, radiotherapy; GTV: gross tumor volume; PTV, Planning target volume
The median tMLD was 11.3 (min: 2.8-20.7) Gy, the median tV5 was 45% (min: 8, max: 66), and the median tV20 was 19% (3-36). RT dosimetric properties are summarized in Table 3.
Table 3.
Dosimetric Characteristics.
| Variable | Median (%) (max/min) |
|---|---|
| tV5 | 45 (8-66) |
| tV10 | 29 (5-55) |
| tV15 | 23 (4-43) |
| tV20 | 19 (3-36) |
| tV25 | 15 (3-32) |
| tV30 | 12 (1-30) |
| tV35 | 9 (1-27) |
| tV40 | 7 (0.1-24) |
| tV45 | 5 (0.1- 21) |
| tV50 | 3 (0-17) |
| tV55 | 2 (0-13) |
| tV60 | 0.9 (0-8) |
| iV5 | 61 (18-99) |
| iV10 iV15 |
51 (14-95) 44 (13-83) |
| iV20 | 38 (12-69) |
| iV25 | 32 (9-64) |
| iV30 | 25 (4-63) |
| iV35 | 19 (3-60) |
| iV40 | 15 (1-59) |
| iV45 | 10 (0-56) |
| iV50 | 8 (0-53) |
| iV55 | 5 (0-34) |
| iV60 | 2 (0-23) |
| cV5 | 33 (0.5-60) |
| cV10 | 9 (0-39) |
| cV15 | 3 (0-34) |
| cV20 | 1.5 (0-33) |
| cV25 | 0.4 (0- 33) |
| cV30 | 0 (0-32) |
| cV35 | 0 (0-29) |
| cV40 | 0 (0-29) |
| cV45 | 0 (0-16) |
| cV50 | 0 (0-9) |
| cV55 | 0 (0-5) |
| cV60 | 0 (0-3) |
| MLD (Gy) | |
| tMLD | 11.3 (2.8-20.7) |
| iMLD | 18.2 (4.7-38) |
| cMLD | 4.6 (1.2-16.3) |
| Maximum lung dose (Gy) | |
| Total | 63.1 (46.9-70.6) |
| Ipsilateral | 63.0 (46.9-70.6) |
| Contralateral | 42.2 (10.7-66.2) |
| Minimum lung dose (Gy) | |
| Total | 0.16 (0 -1.0) |
| Ipsilateral | 0.35 (0-2.8) |
| Contralateral | 0.19 (0-0.72) |
| Lung volume (cc) | |
| Total | 3935 (1487-7256) |
| Ipsilateral | 1778 (852-3871) |
| Contralateral | 2001 (486-3985) |
Abbreviations: t, total; i, ipsilateral; c, contralateral, MLD: mean lung dose.
RP
RP was observed in 51 (26.4%) of the 193 cases included in the study. The number of cases with grade 1, 2 and 3 RP was 28 (14.5%), 22 (11.3%) and 1 (0.5%), respectively. Grade ≥4 RP was not observed.
Prediction of RP With ML
The study started with 197 cases (RP = 51, non-RP = 146), and 4 cases were excluded due to missing data. Of the 77 parameters initially evaluated, the following 9 were determined as important variables: total(t)V5, ipsilateral lung Dmax, contralateral lung Dmax, total lung Dmax, GTV, number of chemotherapy before RT, tumor size, lymph node localization and asbestos exposure.
The data set was divided into 2 as training and test sets at a ratio of 80-20. Prediction models were created using the LR, ANN, XGB, SVM, RF, GNB and LGBM methods on the training set, and the LGBM algorithm was determined to have the best prediction ability with 85% accuracy [confidence interval (CI): 0.73-0.96], 97% sensitivity, and 50% specificity. The LGBM algorithm accurately predicted 5 out of 6 RP cases and 28 out of 33 non-RP cases in the test data set. The confusion matrix is presented in Table 4 and the accuracy rates of the algorithms are given in Table 5. The ROC-AUC graph of the algorithms is shown in Figure 2.
Table 4.
Extreme Gradient Boosting Classifier Confusion Matrix.
| Actual | |||
|---|---|---|---|
| RP − | RP+ | ||
| Predicted | RP− | 28 | 5 |
| RP+ | 1 | 5 | |
Abbreviation: RP, radiaton pneumonitis.
Table 5.
Results of Algorithms.
| Algorithm | LR | ANN | XGB | SVM | RF | GNB | LGBM |
|---|---|---|---|---|---|---|---|
| Accuracy | 0.51 | 0.51 | 0.79 | 0.54 | 0.77 | 0.46 | 0.85 |
| ROC AUC | 0.47 | 0.53 | 0.62 | 0.50 | 0.67 | 0.54 | 0.73 |
| Positive predictive value (Precision) | 0.75 | 0.73 | 0.84 | 0.76 | 0.81 | 0.90 | 0.85 |
| Sensitivity (Recall) | 0.52 | 0.55 | 0.90 | 0.55 | 0.90 | 0.31 | 0.97 |
| Specificity | 0.50 | 0.40 | 0.50 | 0.50 | 0.40 | 0.90 | 0.50 |
| Confidence interval | 0.36-0.67 | 0.36-0.67 | 0.67-0.92 | 0.38-0.70 | 0.64-0.90 | 0.31-0.62 | 0.73-0.96 |
Abbreviations: LR, logistic regression; ANNs, artificial neural networks; XGB, eXtreme Gradient Boosting; SVM, support vector machines; RF, random forest; GNB, Gaussian Naive Bayes; LGBM, light gradient boosting machine, ROC, receiver operating characteristic, AUC, Area under the Curve.
Figure 2.
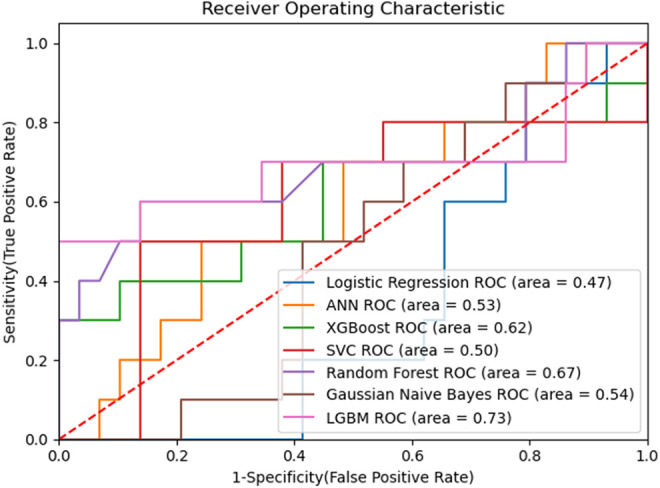
ROC-AUC graph.
Discussion
In the current study, patient and tumor characteristics and dosimetric factors were evaluated together, and significant variables affecting RP were determined to be total(t)V5, ipsilateral lung Dmax, contralateral lung Dmax, total lung Dmax, GTV, number of chemotherapy before RT, tumor size, lymph node localization and asbestos exposure. LGBM algorithm was determined to have the best prediction ability with 85% accuracy [confidence interval (CI): 0.73-0.96], 97% sensitivity, and 50% specificity.
RP is an important toxicity that can result in death in patients undergoing RT due to lung cancer. Predicting the development of RP can lower toxicity rates. In this study, RP was predicted by evaluating dosimetric and clinical factors together.
In lung cancer RT, tMLD and certain dose volume parameters are used during treatment planning to reduce the risk of RP.29–31 Dosimetric factors include dose volume histogram parameters and threshold doses, such as the maximum point dose. Non-dosimetric factors refer to other variables; e.g. age, gender, and histopathology. Normal tissue complication probability and tumor control probability prediction models focus on dosimetric parameters alone.32,33 However, the necessity of also using non-dosimetric parameters was emphasized in the Quantitative Analysis of Normal Tissue Effects in the Clinic (QUANTEC).34
In a study using dosimetric, clinical, and tumor localization parameters in a multivariate LR prediction model, presence of concomitant chemotherapy, equivalent RT dose, tV60, and tumor location were determined as significant variables.35 According to these results, rather than using a single factor to distinguish between high-risk and low-risk patients for RP development, dosimetric, clinical and tumor location factors should be evaluated together. In the present study, these factors were evaluated together.
In a study conducted by Valdes et al, 201 cases who underwent stereotactic body radiotherapy (SBRT) with the diagnosis of stage I lung cancer were evaluated. RP was observed in 4% of the cases, and 61 variables were evaluated. The diffusing capacity of the lungs for carbon monoxide, dose received by 15 cc of the heart, dose received by 4 cc of the trachea/bronchi, and ethnicity were determined as important variables for the development of RP. Decision trees, RF and RUSBoost algorithms were previously evaluated, and it was reported that a data set of at least 800 cases was needed to predict RP with an error rate of less than 10%.36 In another study by Lee et al, a Bayesian network (BN) approach was developed in a cohort of 54 NSCLC patients treated with 3DCRT. Clinical and hematological biomarkers and dose volume histogram variables were assessed, and the AUC was calculated as 0.83 for BN and 0.77 for LR.37 Chen et al conducted a study using the SVM algorithm to predict the development of ≥ grade 2 RP. In that study, 219 cases with lung cancer were evaluated, and RP was seen in 34 of these cases. While both the dosimetric and non-dosimetric variables were evaluated with SVMall, the dosimetric variables were also evaluated with SMVdose. The sensitivity/specificity rates using SVMdose and SVMall were determined as 74%/75% and 68%/68%, respectively, and significant variables for the SVMall algorithm were identified to be MLD and history of chemotherapy before RT.38 In the current study, the highest sensitivity and specificity rates were achieved with the LGBM algorithm at 97% and 50%, respectively.
In a study conducted by Luna et al with 203 patients with stage II-III NSCLC, 32 variables were evaluated, ≥ grade 2 RP was observed in 17.7% of the cases. The algorithm with the highest accuracy rate was determined as RF (AUC: 0.66), and effective variables for the development of RP were reported to be smoking pack/year, MLD, tV20, and maximum esophagus dose.39 These factors were not determined as important variables in the present study, and tV5, one of the dosimetric parameters, was found to be an important variable.
In a metanalysis covering 31 studies, Vogelius et al evaluated clinical factors affecting RP and reported that advanced age (P < 0.0001) and pulmonary comorbidities (P = 0.007) were risk factors for RP development.9 These variables were also evaluated in the present study, but they did not contribute to the development of RP. Lung volume exposed to radiation is one of the important parameters in the possible pathogenesis of RP. There is a large body of literature reporting the correlation between dosimetric parameters and RP. Although tV20 and tMLD are confirmed to be the most frequently associated parameters in most studies, some other dosimetric variables, including tV5, tV13, tV25 and tV30, are also related to RP development.10 In our study, most of the significant variables were dosimetric parameters.
The contribution of RT techniques to the development of RP has also been previously investigated. In lung cancer, IMRT is superior to 3DCRT since it can increase the therapeutic rate by reducing the organ at risk (RAO) doses while providing a better fit for the tumor. Retrospective studies conducted to date show that IMRT decreases the RAO dose.40,41 The RT technique was also evaluated in the present study but it was not observed to be a significant variable.
In a study by Avenzo et al, it was aimed to correlate radiation dose to the risk of severe radiologically-evident radiation-induced lung injury (RRLI) using voxel-by-voxel analysis of the follow-up CT of 32 patients treated for lung cancer with hypofractionated RT. Follow-up CT scans were obtained after 7.4 months average from the end of RT. Follow-up CT scans were registered to pre-treatment CT using deformable image registration. The change in density was calculated for each voxel within the combined lungs minus PTV. The AUC was 0.581 (0.575–0.583) for fractionated and 0.579 (0.577–0.581) for hypofractionated patients. According to this study, this model can improve treatment planning by identifying dose levels likely to cause RRLI, or help distinguish recurrence from benign changes based on knowledge of lung locations at risk of intensity changes after RT.42
With successful ML models, toxicity rates can be reduced, oncological results can be improved, and hospitalization and healthcare expenses due to toxicity can be reduced. There is still no consensus on an optimal algorithm for predicting toxicity. Algorithms to be used are determined according to various factors, such as experience, use in the literature, and data characteristics.
Conclusion
In recent years, the increasing interest in artificial intelligence in all fields of science has led to the development of innovative tools in RT. The development of prediction tools with a wide variety of variables and models limits the comparability of existing studies and the use of standards. Prediction algorithms can be standardized by sharing data between centers, data diversity, and creating big data. In addition, models can be made clinically applicable through updating by entering new data. In the current study, when the clinical and dosimetric parameters were evaluated together, LGBM was determined as the algorithm with the highest accuracy rate to predict RP. However, in order to use this algorithm in clinical practice, it is necessary to increase data diversity and the number of patients by sharing data between centers.
Supplemental Material
Supplemental Material, sj-pdf-1-tct-10.1177_15330338211016373 for Prediction of Radiation Pneumonitis With Machine Learning in Stage III Lung Cancer: A Pilot Study by Melek Yakar, Durmus Etiz, Muzaffer Metintas, Guntulu Ak and Ozer Celik in Technology in Cancer Research & Treatment
Abbreviations
- 3DCRT
three-dimensional conformal radiotherapy
- ANNs
artificial neural networks
- AUC
area under the curve
- CT
computed tomography
- CTV
clinical target volume
- DM
diabetes mellitus
- GNB
Gaussian Naive Bayes
- GTV
gross tumor volume
- IMRT
intensity modulated radiation therapy
- (KPS)
Karnofsky Performance Status
- LGBM
light gradient boosting machine
- LR
logistic regression
- ML
machine learning
- MLD
mean lung dose
- NSCLC
non-small cell lung cancer
- PET
positron emission tomography
- PTV
planned target volume
- RF
random forest
- ROC
receiver operating characteristics
- RP
radiation pneumonitis
- RT
radiotherapy
- SCLC
small cell lung cancer
- SMOTE
synthetic minority oversampling technique
- SVM
support vector machines (SVM)
- XGB
eXtreme Gradient Boosting.
Footnotes
Declaration of Conflicting Interests: The author(s) declared no potential conflicts of interest with respect to the research, authorship, and/or publication of this article.
Funding: The author(s) received no financial support for the research, authorship, and/or publication of this article.
ORCID iD: Melek Yakar, MD  https://orcid.org/0000-0002-9042-9489
References
- 1. Siegel RL, Miller KD, Jemal A. Cancer statistics, 2019. CA Cancer J Clin. 2019;69(1):7–34. [DOI] [PubMed] [Google Scholar]
- 2. El-Naqa I, Bradley J, Blanco A, et al. Multivariable modeling of radiotherapy outcomes, including dose-volume and clinical factors. Int J Radiat Oncol Biol Phys. 2006;64(4):1275–1286. [DOI] [PubMed] [Google Scholar]
- 3. Simone CB II. Thoracic radiation normal tissue injury. Semin Radiat Oncol. 2017;27(4):370–377. [DOI] [PubMed] [Google Scholar]
- 4. Barriger RB, Fakiris AJ, Hanna N, Yu M, Mantravadi P, McGarry RC. Dose volume analysis of radiation pneumonitis in non-small-cell lung cancer patients treated with concurrent cisplatinum and etoposide with or without consolidation docetaxel. Int J Radiat Oncol Biol Phys. 2010;78(5):1381–1386. [DOI] [PubMed] [Google Scholar]
- 5. Graves PR, Siddiqui F, Anscher MS, Movsas B. Radiation pulmonary toxicity: from mechanisms to management. Semin Radiat Oncol. 2010;20(3):201–207. [DOI] [PubMed] [Google Scholar]
- 6. Hernando ML, Marks LB, Bentel GC, et al. Radiation-induced pulmonary toxicity: a dose-volume histogram analysis in 201 patients with lung cancer. Int J Radiat Oncol Biol Phys. 2001;51(3):650–659. [DOI] [PubMed] [Google Scholar]
- 7. Tepper J. Gunderson and Tepper’s Clinical Radiation Oncology. 5th ed. Elsevier; 2020. [Google Scholar]
- 8. Trott KR, Herrmann T, Kasper M. Target cells in radiation pneumopathy. Int. J. Radiat Oncol Biol Phys. 2004;58(2):463–469. [DOI] [PubMed] [Google Scholar]
- 9. Vogelius IR, Bentzen SM. A literature-based meta-analysis of clinical risk factors for development of radiation induced pneumonitis. Acta Oncol. 2012;51(8):975–983. [DOI] [PMC free article] [PubMed] [Google Scholar]
- 10. Palma DA, Senan S, Tsujino K, et al. Predicting radiation pneumonitis after chemoradiation therapy for lung cancer: an international individual patient data meta-analysis. Int J Radiat Oncol Biol Phys. 2013;85(2):444–450. [DOI] [PMC free article] [PubMed] [Google Scholar]
- 11. Graham MV, Purdy JA, Emami B, et al. Clinical dose-volume histogram analysis for pneumonitis after 3D treatment for non–small cell lung cancer (NSCLC). Int J Radiat Oncol Biol Phys. 1999;45(2):323–329. [DOI] [PubMed] [Google Scholar]
- 12. Tucker SL, Mohan R, Liengsawangwong R, Martel MK, Liao Z. Predicting pneumonitis risk: a dosimetric alternative to mean lung dose. Int J Radiat Oncol Biol Phys. 2013;85(2):522–527. [DOI] [PubMed] [Google Scholar]
- 13. Liu F, Yorke ED, Belderbos JS, et al. Using generalized equivalent uniform dose atlases to combine and analyze prospective dosimetric and radiation pneumonitis data from 2 non–small cell lung cancer dose escalation protocols. Int J Radiat Oncol Biol Phys. 2013;85(1):182–189. [DOI] [PMC free article] [PubMed] [Google Scholar]
- 14. Jenkins P, Watts J. An improved model for predicting radiation pneumonitis incorporating clinical and dosimetric variables. Int J Radiat Oncol Biol Phys. 2011;80(4):1023–1029. [DOI] [PubMed] [Google Scholar]
- 15. Galkin F, Aliper A, Putin E, et al. Human microbiome aging clocks based on deep learning and tandem of permutation feature importance and accumulated local effects. BioRxiv, 507780.EBioMedicine. Machine learning in cancer diagnostics. EBioMedicine. 2019;45:1–2.31326086 [Google Scholar]
- 16. Brierley J, Gospodarowicz MK, Wittekind C. TNM Classification of Malignant Tumours. 8th ed. Wiley-Blackwell; 2017. [Google Scholar]
- 17. U.S. Department of Health and Human Services. Common terminology criteria for adverse events (CTCAE); published 2017. Updated 2020. Accessed October 19, 2020. https://ctep.cancer.gov/protocolDevelopment/electronic_applications/docs/CTCAE_v5_Quick_Reference_5x7.pdf
- 18. Cox JD, Stetz J, Pajak TF. Toxicity criteria of the Radiation Therapy Oncology Group (RTOG) and the European Organization for Research and Treatment of Cancer (EORTC). Int J Radiat Oncol Biol Phys. 1995;31(5):1341–1346. [DOI] [PubMed] [Google Scholar]
- 19. Green S, Weiss GR. Southwest oncology group standard response criteria, endpoint definitions and toxicity criteria. Investig New Drugs. 1992;10(4):239–253. [DOI] [PubMed] [Google Scholar]
- 20. Hawkins DM. The problem of overfitting. J Chem Inf Comput Sci. 2004;44(1):1–12. [DOI] [PubMed] [Google Scholar]
- 21. Chawla NV, Bowyer KW, Hall LO, Kegelmeyer WP. SMOTE: synthetic minority over-sampling technique. J Art Intelligen Res. 2002;16:321–357. [Google Scholar]
- 22. Çelik Ö, Osmanoğlu UÖ, Çanakçı B. Sentiment analysis from social media comments. Mühendis Bilim Tasar Derg. 2020;8(2):366–374. [Google Scholar]
- 23. Chen T, He T, Benesty M, Khotilovich V, Tang Y. XGBoost: extreme gradient boosting. R package version 0.4-2, 1–4. [Google Scholar]
- 24. Doupe P, Faghmous J, Basu S. Machine learning for health services researchers. Value Health. 2019;22(7):808–815. PMID: 31277828. doi:10.1016/j.jval.2019.02.012 [DOI] [PubMed] [Google Scholar]
- 25. Celik O, Osmanoglu UO. Comparing to techniques used in customer churn analysis. J Multidiscip Res Dev. 2019;4(1):30–38. [Google Scholar]
- 26. LightGBM (Light Gradient Boosting Machine); published 2020. Updated July 16, 2020. Accessed October 19, 2020. https://www.geeksforgeeks.org/lightgbm-light-gradient-boosting-machine/
- 27. Powers DMW. Evaluation: from precision, recall and F-measure to ROC, informedness, markedness & correlation. J Mach Learn Technol. 2011;2(1):37–63. [Google Scholar]
- 28. Pedregosa F, Varoquaux G, Gramfort A, et al. Scikit-learn: machine learning in python. J Mach Learn Res. 2011;12:2825–2830. [Google Scholar]
- 29. Wang S, Liao Z, Wei Z, et al. Analysis of clinical and dosimetric factors associated with treatment-related pneumonitis (TRP) in patients with non-small-cell lung cancer (NSCLC) treated with concurrent chemotherapy and three-dimensional conformal radiotherapy (3D-CRT). Int J Radiat Oncol Biol Phys. 2006;66(5):1399–1407. [DOI] [PubMed] [Google Scholar]
- 30. Marks LB, Bentzen SM, Deasy JO, et al. Radiation dose-volume effects in the lung. Int J Radiat Oncol Biol Phys. 2010;76(3 Suppl): S70–S76. [DOI] [PMC free article] [PubMed] [Google Scholar]
- 31. Rodrigues G, Lock M, D’Souza D, Yu E, van Dyk J. Prediction of radiation pneumonitis by dose-volume histogram parameters in lung cancer--a systematic review. Radiother Oncol. 2004;71(2):127–138. [DOI] [PubMed] [Google Scholar]
- 32. Burman C, Kutcher GJ, Emami B, Goitein M. Fitting of normal tissue tolerance data to an analytic function. Int J Radiat Oncol Biol Phys. 1991;21(1):123–135. [DOI] [PubMed] [Google Scholar]
- 33. Seppenwoolde Y, Lebesque JV, de Jaeger K, et al. Comparing different NTCP models that predict the incidence of radiation pneumonitis. Normal tissue complication probability. Int J Radiat Oncol Biol Phys. 2003;55(3):724–735. [DOI] [PubMed] [Google Scholar]
- 34. Marks LB, Yorke ED, Jackson A, et al. Use of normal tissue complication probability models in the clinic. Int J Radiat Oncol Biol Phys. 2010;76(3 Suppl): S10–S19. [DOI] [PMC free article] [PubMed] [Google Scholar]
- 35. Hope AJ, El Naqa I, Bradley JD, et al. Radiation pneumonitis/fibrosis risk based on dosimetric, clinical, and location-related factors. Int J Radiat Oncol Biol Phys. 2004;60(1): S204. [Google Scholar]
- 36. Valdes G, Solberg TD, Heskel M, Ungar L, Simone II CB. Using machine learning to predict radiation pneumonitis in patients with stage I non-small cell lung cancer treated with stereotactic body radiation therapy. Phys Med Biol. 2016;61(16):6105–6120. [DOI] [PMC free article] [PubMed] [Google Scholar]
- 37. Lee S, Ybarra N, Jeyaseelan K, et al. Bayesian network ensemble as a multivariate strategy to predict radiation pneumonitis risk. Med Phys. 2015;42(5):2421–2430. [DOI] [PubMed] [Google Scholar]
- 38. Chen S, Zhou S, Yin FF, Marks LB, Das SK. Investigation of the support vector machine algorithm to predict lung radiation-induced pneumonitis. Med Phys. 2007;34(10):3808–3814. [DOI] [PMC free article] [PubMed] [Google Scholar]
- 39. Luna JM, Chao HH, Diffenderfer ES, et al. Predicting radiation pneumonitis in locally advanced stage II-III non-small cell lung cancer using machine learning. Radiother Oncol. 2019;133:106–112. [DOI] [PubMed] [Google Scholar]
- 40. Yom SS, Liao Z, Liu HH, et al. Initial evaluation of treatment-related pneumonitis in advanced-stage non-small-cell lung cancer patients treated with concurrent chemotherapy and intensity-modulated radiotherapy. Int J Radiat Oncol Biol Phys. 2007;68(1):94–102. [DOI] [PubMed] [Google Scholar]
- 41. Wu VWC, Kwong DLW, Sham JST. Target dose conformity in 3-dimensional conformal radiotherapy and intensity modulated radiotherapy. Radiother Oncol. 2004;71(2):201–206. [DOI] [PubMed] [Google Scholar]
- 42. Avanzo M, Barbiero S, Trovo M, et al. Voxel-by-voxel correlation between radiologically radiation induced lung injury and dose after image-guided, intensity modulated radiotherapy for lung tumors. Phys Med. 2017;42:150–156. Epub 2017 Sep 23. PMID: 29173909. doi:10.1016/j.ejmp.2017.09.127 [DOI] [PubMed] [Google Scholar]
Associated Data
This section collects any data citations, data availability statements, or supplementary materials included in this article.
Supplementary Materials
Supplemental Material, sj-pdf-1-tct-10.1177_15330338211016373 for Prediction of Radiation Pneumonitis With Machine Learning in Stage III Lung Cancer: A Pilot Study by Melek Yakar, Durmus Etiz, Muzaffer Metintas, Guntulu Ak and Ozer Celik in Technology in Cancer Research & Treatment