Abstract
Intracortical microstimulation (ICMS), which has shown promise in the visual, auditory and somatosensory systems as a platform for sensory prostheses, typically relies on charged balanced, symmetric, biphasic stimulation. However, neural stimulation models as well as experiments conducted in cochlear implant users have suggested that charge balanced asymmetric pulses could generate lower detection thresholds for stimulation in terms of charge per phase. For this study, rats were chronically implanted with microelectrode arrays unilaterally in their right auditory cortex and then trained to detect ICMS delivered through a single electrode site in order to determine their behavioral threshold. This model was used in two experiments. The first experiment addressed the effect of lead phase direction, asymmetry, and phase duration on detection threshold. The second experiment fixed the cathode phase duration at 123 μs and varied only the phase asymmetry and lead phase direction. Taken together, the results of these experiments suggest that, for ICMS, the primary determinant of threshold level is cathode phase duration, and that asymmetry provides no significant advantage when compared to symmetric, cathode leading pulses. However, symmetric anode leading pulses of less than or equal to 205 μs per phase consistently showed higher thresholds when compared to all other pulses of equal cathode phase duration.
Keywords: Animal behavior, detection threshold, interface engineering, neuroprostheses, waveforms
I. Introduction
ALL conscious sensory experience is the result, at some level, of the activity of neurons in the primary sensory cortices. In healthy individuals, that activity is driven by sensory neurons such as those in the skin, the eyes and the ears. However, when the tracts carrying that information to the cortex are severed these senses are lost, leaving individuals numb, blind or deaf. Fortunately, neural activity in these cortical regions can be artificially generated using electrical current flowing through microelectrodes surgically implanted into these cortical structures. This technique is termed “intracortical microstimulation” (ICMS).
It has been shown that ICMS of primary somatosensory regions can produce a tactile sensation [1], [2] and that such sensations can be incorporated as feedback for bidirectional brain machine interfaces (BMIs) [3]–[5]. The visual cortex [6]–[8] and the auditory cortex [9]–[11] also have shown promise as a platform for sensory prostheses.
However, before ICMS can become a clinically viable option for sensory prosthesis it must be shown that it can be used by the patient without damaging the neural tissue. A series of carefully designed studies have demonstrated that the most important factors in causing electrically induced tissue damage are charge per phase and pulse frequency [12]–[14]. Therefore, when designing minimally damaging stimulation waveforms one must minimize the total charge per phase exchanged between the electrode and the brain.
Typically, ICMS employs pulses comprising cathode first, symmetric, biphasic waveforms [15]. The purpose of these pulses is to balance the charge injected in the first phase of the pulse with the charge recovered in the second phase and, thus, to reverse and minimize potentially harmful electrochemical reactions at the site of the electrode [16]–[18]. However, while the charge balanced nature of the pulses is the accepted canonical rule for ICMS waveforms, it has not been demonstrated that such pulses must be symmetric in the sense that the duration of the first phase is the same as the duration of the second phase.
Theoretical models have suggested that waveforms which deviate from the standard symmetrical shape could help to reduce the total charge per phase needed to generate a qualitatively equivalent sensation. One approach involves decreasing the amplitude of the anode phase while increasing its duration in order to maintain charge balance [19], [20]. Pulses in which the broadened anode phase follows the cathode phase are often referred to as “pseudo-monophasic.” It is hypothesized that the effect of the anode phase, which has been shown to raise the threshold for biphasic pulse when compared with cathode monophasic pulses [21], [22], could be minimized by these pseudo-monophasic pulses. An even more intriguing hypothesis is that by leading with the long duration anode phase one might be “conditioning” the inactivation gates of the sodium channels thus lowering their threshold for the cathode phase [20]. This paper presents the results of two experiments intended to address the hypothesis that such asymmetric pulses could be used in ICMS in order to reduce the total charge per phase required to generate a behaviorally detectable sensation.
II. Materials and Methods
A. Experimental Design
In order to explore the effects of waveform asymmetry on the detection threshold of ICMS two experiments were designed. The first experiment, designated “Factorial,” examined the three factors which define a biphasic constant current waveform: lead phase direction, phase asymmetry, and phase duration. The phase direction of the pulse was varied between positive current (anode) and negative current (cathode). Additionally, the duration for the shortest (highest amplitude) phase of the pulse was varied between 82, 205, and 492 μs. Finally, phase asymmetry was described by the “Phase Amplitude Factor” (PAF) (1) which is defined as the ratio of the amplitude current of the first phase (I1) to the amplitude of the second phase (I2) (exemplified in Fig. 1)
| (1) |
Fig. 1.
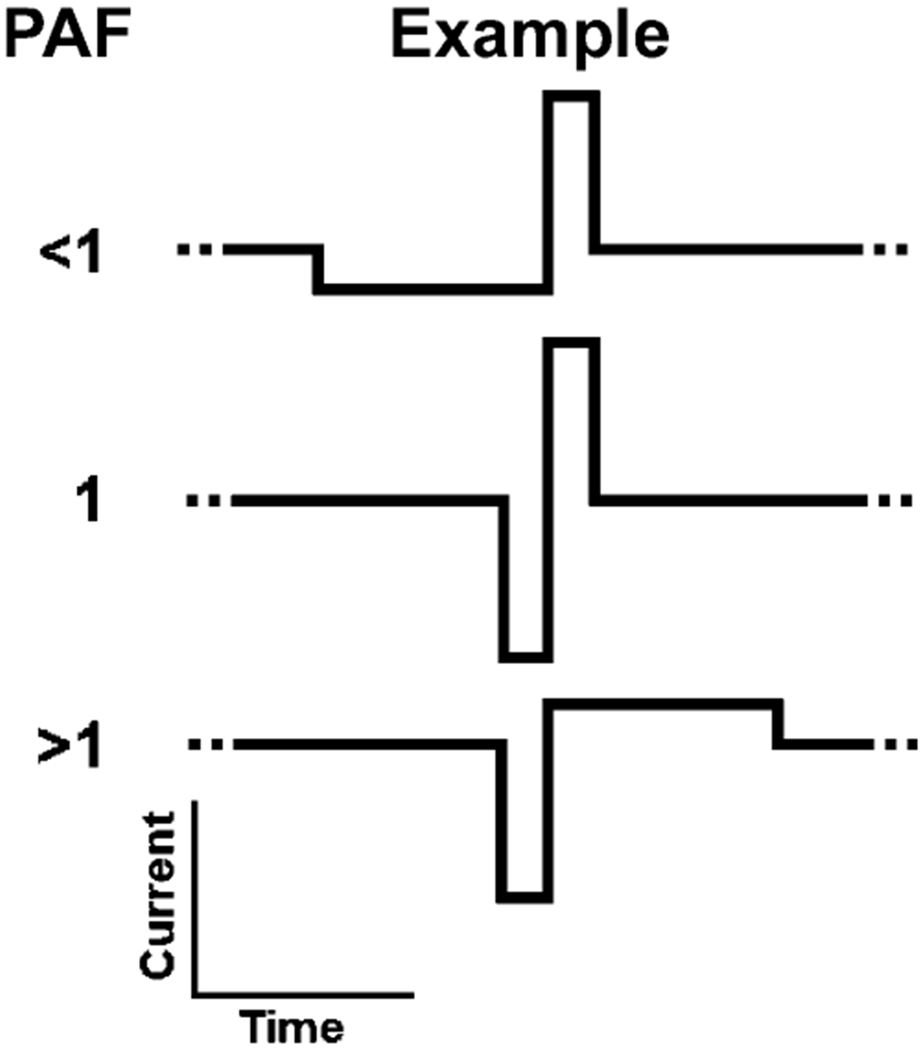
Examples of asymmetric waveforms. PAF was defined as the ratio of the current of the first phase to the current of the second phase. Charge balance was maintained by altering the phase duration of the lowest amplitude phase.
For this experiment, the PAF was set at 0.2, 1, or 5. For asymmetric pulses, charge balance was maintained by proportionately lengthening the phase duration of the lowest amplitude phase. The PAF values of 0.2 and 5 were selected to limit the total pulse to ∼3 ms (492 μs for the narrow phase and 2460 μs for the broad phase). Since stimulation was delivered at a pulse frequency of 150 Hz, the period between the start of each pulse was 6.67 ms. Thus, the pulses did not account for more than 50% of the duty cycle of the overall train stimulus train.
The complete factorial design involved a total of 18 waveforms (2 * 3 * 3 factor levels) and is graphically depicted in Fig. 2(a). This design was selected because, using the behavioral paradigm described below, rats typically could complete 18 trials in a single day’s session. This meant that all 18 waveforms could be randomized, in terms of order of presentation, and their threshold levels found within in a single day, thereby providing a highly effective experimental block. This method of blocking was used to account for any potential variation between individual rat’s detection levels, electrode channel variabilities as well as the animal’s day to day motivational variation. Occasionally rats failed to complete the block; these sessions were included for statistical analysis only if greater than 14 out of the desired 18 trials were completed.
Fig. 2.
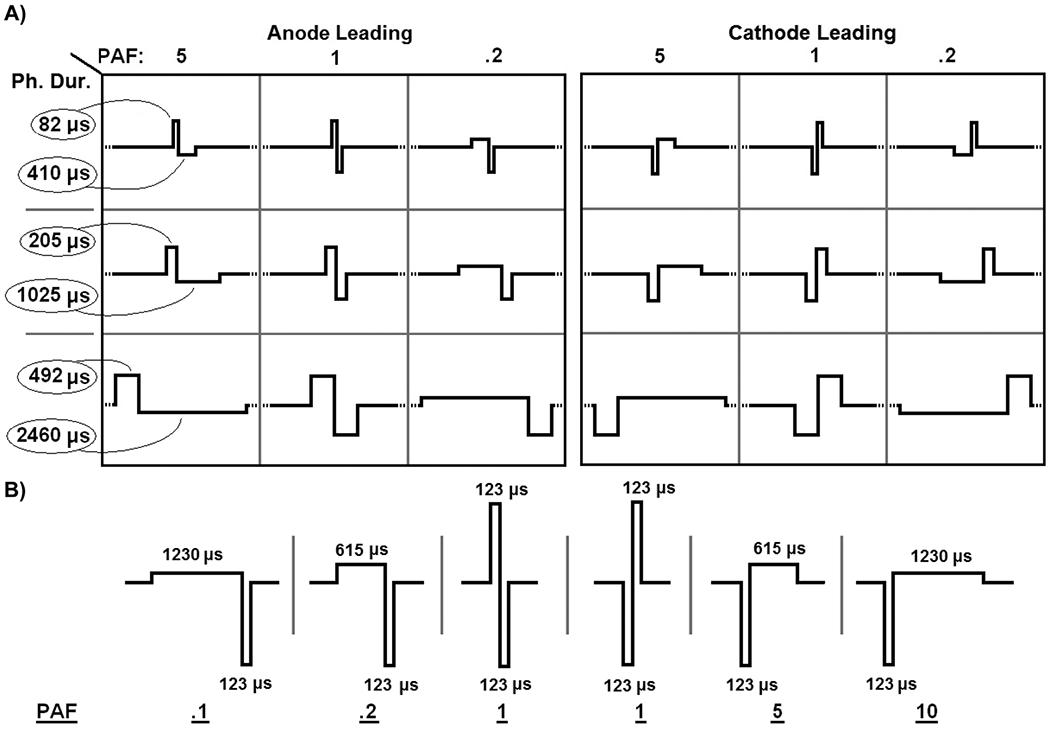
Experimental designs of the factorial and simplified experiments. A) In the factorial experiment, the direction of the leading phase, pulse duration, and phase asymmetry are all varied in a complete factorial design. Rats generated thresholds for the 18 waveforms, which were presented in a randomized order, within a single day’s testing session providing a strong statistical block. B) For the simplified design, the cathode phase duration was fixed while the phase order and asymmetry were varied. After randomization of their order, the six waveforms were presented to the rat as a complete block design.
Based on the results of the Factorial experiment, a second experiment, designated “simplified,” was designed to address the hypothesis that the cathode phase duration was the single determining factor in threshold level, while expanding the degree of phase asymmetry studied and increasing the statistical power. For this experiment, the cathode phase duration was fixed at 123 μs. The PAF was varied between 0.1, 0.2, 1, 5, and 10. For the symmetric pulse (PAF = 1), both anode leading and cathode leading pulses were studied. The resulting waveforms can be seen in Fig. 2(b). Again, the technique of presenting all waveforms in a randomized order within a session was used as the experimental block. Because each block consisted of only six waveforms, it was often repeated during the same day. For this experiment, a randomized complete block design was maintained; therefore, any blocks that were not completed were eliminated from the analysis.
B. Behavioral Paradigm
Rats were trained in a conditioned avoidance paradigm adapted from one used with great success in other auditory behavioral studies involving rats [23], [24] and is described here in brief. Water deprived rats were placed in a cage inside an acoustically isolated chamber (Industrial Acoustic Company, Bronx, NY). Water was then flowed through an electrically active spout using a syringe pump (Harvard Apparatus, Holliston, MA) located outside of the chamber. By licking the spout, the rats completed an electric circuit between the spout and the metal floor of the cage. This circuit was used to detect the rat’s presence on the spout using custom hardware and software written in MATLAB (Natick, MA). The rats were then trained to lick the spout to cause the water to flow and to initiate trials. In order to initiate a trial, the rat had to be in contact with the spout for more than 25% of a 200 ms window.
Trials were designated as “warning” or “safe” and lasted for 650 ms [Fig. 3(a)]. For the warning, an acoustic stimulus was delivered for the duration of the trial (Tucker–Davis Technologies, Alachua, FL). The rat’s contact with the spout was monitored during the last 200 ms of warning. If the rat was in contact with the spout for more than 20% of the time, a mild electrocutaneous shock of 1.6 mA was delivered through the spout as punishment and a “miss” was recorded. All rats would return immediately to the spout following each punishment shock, demonstrating that, while annoying enough to elicit avoidance behavior, the shock did not cause significant fear or distress. If the rat was in contact with the spout for less than 20% of the final 200 ms, a hit was recorded. During safe trials, no sound was played and the rat’s presence on the spout was recorded for the last 200 ms. As in the warning trials, if the rat was in contact with the spout for more than 20% of the final 200 ms “correct rejection” was recorded; if the rat was in contact with the spout for less than 20% of the final 200 ms, a “false alarm” was recorded. The safe trials were used to ensure that the rat was maintaining contact with the spout and only responding to the warning tones. Typically rats’ false alarm rates were less than 10%. However, if the rat’s false alarm rate for a given session was higher than 20% the series was eliminated from analysis. Trials were split into blocks consisting of five trials, one of which was randomly selected as the warning while the other four were designated as safe [Fig. 3(b)]. Signal detection theory was then used to calculate a d′ value for each series [25].
Fig. 3.
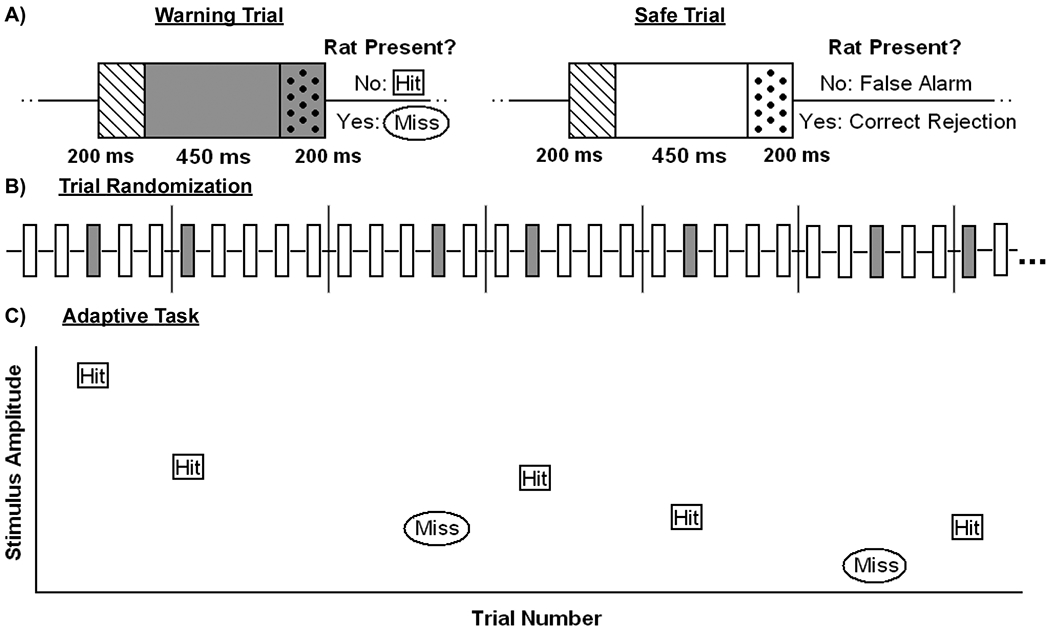
Schematized behavioral task. A) Trials were broken into segments. The first 200 ms, represented by the dashed box, was used to detect the rat’s contact with the spout and to initiate a trial. Trials lasted for 650 ms, the final 200 ms of which, represented by the polka dotted box, were monitored to determine if the rat was still in contact with the spout. For warning trials the acoustic or electric stimulus was delivered for the duration of the trial, while no stimulus was delivered during the safe trial. B) Warning trial randomization was performed by dividing trials into groups of five and randomly selecting one as the warning. C) Adaptive task using decreasing step size was used to estimate threshold levels.
Once rats demonstrated they could detect 8 kHz tones played at 45 dB with a d′ greater than 2 under this paradigm, they were switched to an adaptive up–down task [Fig. 3(c)]. In the adaptive task, the amplitude of the warning stimulus was raised or lowered based on the rat’s performance [26], [27]. If the rat correctly avoided the spout during the warning (a “hit”), the amplitude of the next warning was lowered, while if it missed the warning by not avoiding the spout, the amplitude was raised. For each series the animal was allowed to make seven or nine reversals, a reversal being defined as a behavioral switch from a run of hits to a run of misses or vice versa. The amplitude of the last four reversals was averaged and this average recorded as the estimate of threshold. All thresholds referred to in this paper were collected using this method.
Before rats in this study were selected for electrode array implantation, they first had to demonstrate that they could consistently complete more than seven trials for acoustic tones spaced logarithmically from 0.5 to 32 kHz within a single training session. This was done for three reasons. First, it demonstrated that the animal would be motivated enough to perform the task. Second, it ensured that the rat performed consistently and thus had minimal day-to-day variability between thresholds, which was typically 2–5 dB. Finally, the audiograms generated in these sessions could be compared with other published accounts, confirming that the rats exhibited “normal” hearing thresholds [24], [28].
After implantation (see Section II-C), a two day recovery period was allowed, following which the rat performed the auditory task again to ensure that the behavior had not been compromised by the surgery. All animals passed this screen. Once the rats had passed the postoperative screen, the warning stimulus was change from a tone to ICMS delivered through one electrode on the implanted array. The stimulation was delivered by an MS16 stimulus isolator with four serial NC48 batteries, enabling a +/−96 V compliance voltage (Tucker–Davis Technologies, Alachua, FL). Different current levels were presented in increasing levels from 20 μA and up until the rat demonstrated detection. The speed at which the rats began performing the new electrical task varied slightly from rat to rat, with Rat B detecting within 30 min of testing, while Rats D, F, and H began performing the task on the second or third day of stimulation. All warning stimuli were delivered at a pulse rate of 150 pulses/s for the 650 ms trial without a bias voltage.
For the waveform experiment, a training session employing trial and error was used to estimate rats’ threshold for the waveforms used in these experiments. The current levels were converted to dB scale, with 0 dB corresponding to 1 mA, and the adaptive series were begun with an initial level 2 dB above the previous day’s threshold estimate for a given waveform. Adaptive step sizes began at 1.5 dB but quickly converged to 0.4 dB by the tenth warning.
C. Surgery
All surgeries and animal experimentation were performed under the guidance of the Institutional Animal Care and Use Committee of Purdue University.
Specifics of the implant procedures are fully described in other publications [29], [30]. Briefly, prior to surgery, an areflexive state was achieved by anesthetic induction through an intraperitoneal injection of a combination of ketamine hydrochloride (80 mg/kg body weight) and xylazine (5 mg/kg). The depth of anesthesia during surgery was monitored by pedal withdrawal movements and anesthesia was supplemented by ketamine hydrochloride (20 mg/kg body weight) if an animal withdrew a limb in response to a toe pinch or if spontaneous movement was noted. Following fur trimming and aseptic surgical preparation of the skin, a midline incision was made and the muscles were reflected. The animal was then placed in a head holder via a bolt mounted anterior to the bregma. The skull over the primary auditory cortex of the right hemisphere was drilled open using a burr. Vascular landmarks and/or stereotaxic coordinates were used to identify the primary auditory cortex [31] and a small dural incision (∼ 200 μm) was made.
A 16-channel, linear, single silicon microelectrode array with 1250 μm2 iridium oxide site area spaced on 100 μm pitch (c1x16-6mm100-1250, NeuroNexus Technologies, Ann Arbor, MI), which had been activated 48 hours prior to surgery [32], was lowered to the surface by hand using microforceps (Fine Science Tools Inc., Foster City, CA) and inserted into the cortical mantle through the pia mater. The intracortical electrodes were inserted with a radial penetration such that the recording sites were positioned 0–1.5 mm below the cortical surface (microscopic visual inspection confirmed that the most superficial electrode site was at the surface of the cortex). Neural recordings from the implants were made (Tucker–Davis Technologies, Alachua, FL) to assess the neurophysiological responses to pure tone or click stimuli to ensure primary auditory cortex placement. The probe assembly was then encased in silicone elastomer (Kwik-Sil, World Precision Instruments, Sarasota, FL). A small wire was attached to an implanted titanium bone screw (size 2–56) to provide an electrical ground point. A final layer of dental acrylic was then applied over the silicone and all remaining visible bone to seal the craniotomy and anchor the implant in place. All electrodes terminated in standard high-density connectors that were embedded in the dental acrylic.
D. Subjects
The following studies were performed on four adult male Sprague-Dawley rats (B, D, F, H) (Harlan, Indianapolis, IN) weighing 500–600 g and aged 6–12 months. It must be noted that these rats were initially implanted for the purpose of a separate ICMS experiment. As such, not all electrode sites were still active at the time the experiments described were performed. Nevertheless, for this experiment the site with the lowest detection threshold was selected on which to perform the experiment. This meant that the site depth between rats varied from ∼ 500 – 1500 μm below the surface. Also, because this experiment was completed concurrently with a separate study, the date it was performed after implantation varied between rats (19–101 days postimplant). Table I summarizes the experimental conditions for this study as well as the number of blocks each rat performed for both the factorial and simplified experiments.
TABLE I.
Subject Summary
| Complete Design | Simplified Design | |||||
|---|---|---|---|---|---|---|
| Rats | Site Depth (μm) | Blocks performed | Days post-implant | Site Depth (μm) | Blocks performed | Days post-implant |
| B | 500 | 10 | 63-72 | 700 | 12 | 94-101 |
| D | 1000 | 1 | 29 | NA | 0 | NA |
| F | 1500 | 4 | 19.20,22,23 | NA | 0 | NA |
| H | NA | 0 | NA | 800 | 4 | 68,69 |
Summary of experimental conditions: rats used, electrode location, number of blocks completed and time elapsed since surgical implantation.
E. Statistical Analysis
Statistical analysis was performed in SAS version 9.1 (Cary, NC). For the Factorial experiment, first multivariate analysis of variance (MANOVA) analysis was done to test whether there was a significant interaction effect between the waveform and the individual rats on relative threshold means. After determining that there was not a significant interaction (p = 0.52), the rats’ thresholds were combined for main effects analysis using the blocking described in the Experimental section of the Methods. Pairwise comparisons between waveforms were made using Tukey’s post hoc test (α = 0.05). The important comparisons were made between waveforms of similar geometries but with different orientations. These comparisons will be described further in the results section.
For the Simplified experiment, MANOVA analysis was again performed to determine whether there was a significant interaction effect between the waveform and the individual rats on relative threshold means. After determining that there was not a significant interaction (p = 0.85), the rat’s thresholds were combined for main effects analysis. For this experiment, the mean threshold for the symmetric, cathode leading pulse was designated as the control. Using the block described above, all comparisons were made to it using Dunnett’s test for comparison to the control (α = 0.05).
This method of first testing for interaction and then using the above tests for multiple pairwise comparisons (blocking by rat and day) was essential in minimizing the influence of the rats’ variance, in terms of mean threshold levels, on the analysis of the waveform specific effects on thresholds. Use of this method explains why error bars are relatively small in Figs. 5, 6, and 8 in spite of the large variance between rats as seen in Fig. 4.
Fig. 5.
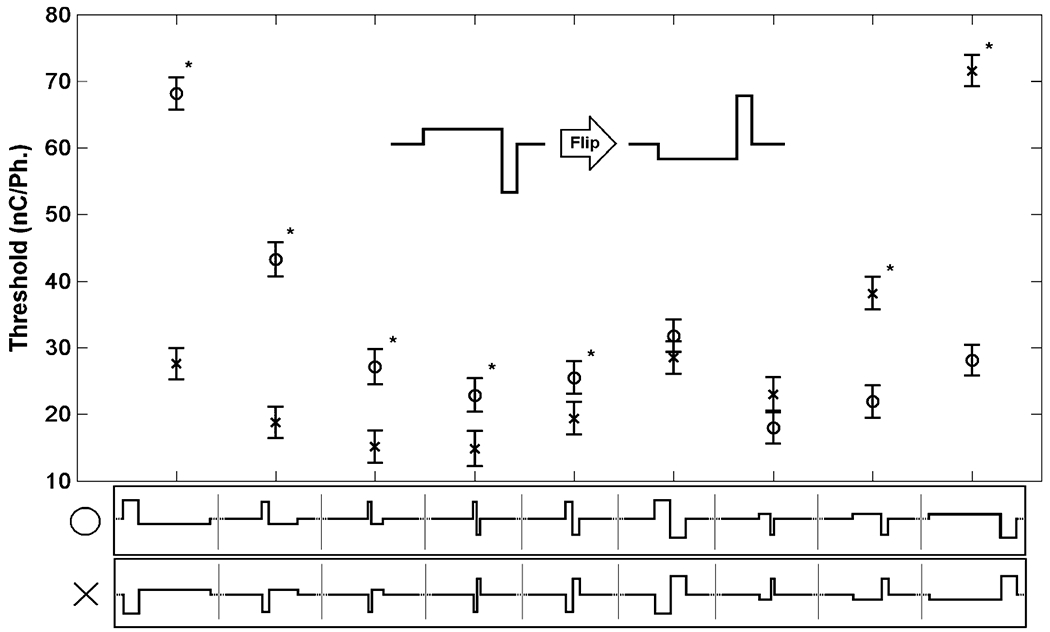
“Flip” comparison of the Factorial experiment. Comparisons were made between waveforms of equal phase duration and PAF but opposite lead phase direction in order to determine the effect of stimulus direction on mean threshold level. Waveforms with an anodal leading phase are represented by “o” while waveforms leading with a cathode phase are represented by “x”. Tukey’s test for multiple comparisons was used (α = 0.05, “*” indicates waveforms that resulted in significantly different behavioral thresholds). Error bars show the 95% confidence interval of the least squares estimate of the mean.
Fig. 6.
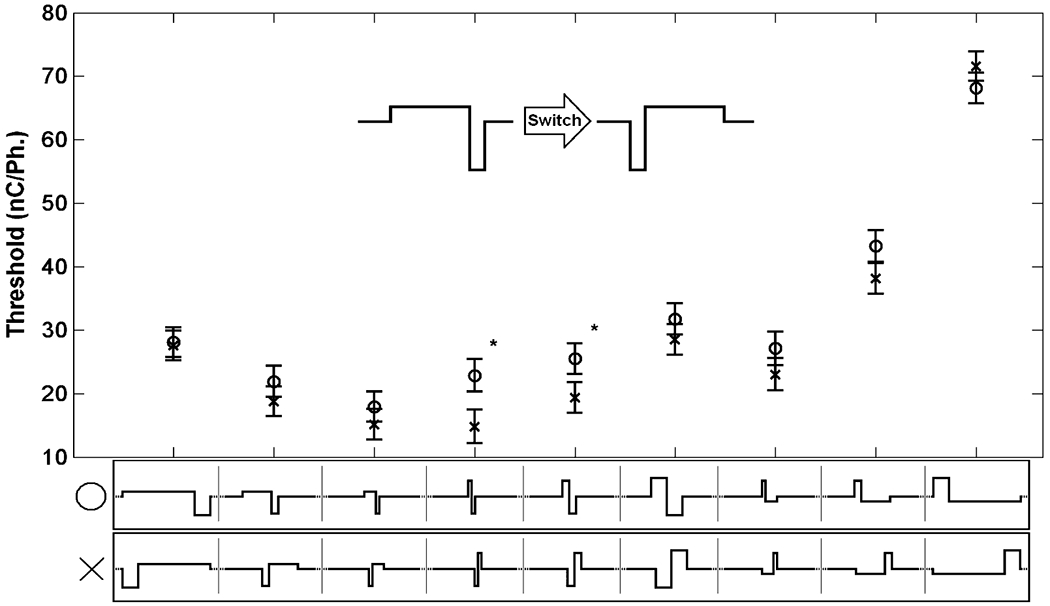
“Switch” comparison of the factorial experiment. Comparisons were made between waveforms of equal phase duration, reciprocal PAF, and opposite lead phase direction in order to determine the effect of phase order on mean threshold level. Waveforms with an anodal leading phase are represented by “o” while waveforms leading with a cathode phase are represented by “x”. Tukey’s test for multiple comparisons was used (α = 0.05 “*” indicates waveforms that resulted in significantly different behavioral thresholds). Error bars show the 95% confidence interval of the least squares estimate of the mean.
Fig. 4.
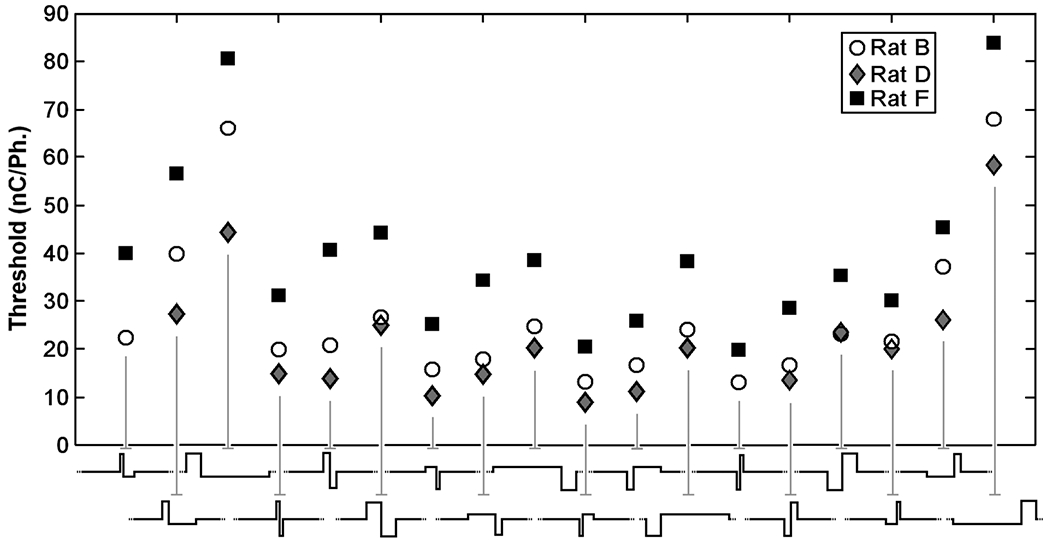
Interaction plot showing mean threshold levels for rats B, D, F for the waveforms in the factorial experiment. Waveforms are grouped by lead phase direction and PAF in ascending order of phase duration. There was no statistical evidence of rat waveform interaction when analyzed under the block-treatment interaction model using rats as the blocking factor (p = 0.52).
III. Results
A. Factorial Experiment
Because the experiment was performed using only three rats that varied both in terms of the electrode depth as well as time post implant, we were confounded from analyzing how depth or time elapsed since implantation may have altered the relative threshold levels of the rats for the pulses. Nonetheless, analyzing the thresholds generated by these rats together in order to evaluate the effect of waveform geometry on threshold level is valid if it can be shown that the same relationship between waveform and threshold existed for all rats. Importantly, analysis showed no significant evidence of interaction (p = 0.52). This is best seen in the form of an interaction plot which shows all three rats’ mean threshold levels for the individual waveforms (Fig. 4). The mean thresholds for all three rats vary for the individual waveforms; however, the overall relationship is the same, i.e., the lines appear to be parallel. This means that the experimental blocking was effective and that the data and, thus, the data were lumped and analyzed for main effects.
Two important comparisons can be made for a threshold of a given waveform. For the purpose of this paper these are referred to as the “flip” and the “switch” comparison. In the flip comparison, the duration and PAF of the waveform are fixed while the direction of the first phase is changed. This comparison demonstrates the role of current direction in determining the threshold of a waveform. Fig. 5 shows the least squares mean estimate of the thresholds for the waveform depicted graphically along the x-axis. The error bars represent the 95% confidence interval for the thresholds. For the flip comparison, there is a significant difference between the mean thresholds for all the waveforms analyzed, with the exception of the symmetric 492 μs per phase waveforms (p = 0.92) and asymmetric waveforms with first phase duration of 410 μs and second phase duration of 82 μs (p = 0.26). However, all other comparison are significant at α = 0.05 confidence level with most having a p value of <0.0001, thus, demonstrating the strong role of waveform direction in determining the threshold for the given waveform geometry.
For the Switch comparison, a given waveform was compared with the waveform of equal phase duration, opposite lead phase direction and reciprocal PAF, which was ultimately equivalent to switching the order of the phases of the pulse. This comparison can be seen in Fig. 6. For all asymmetric waveforms, there was no significant difference between waveforms. For symmetric waveforms the 82 μs per phase pulse and 205 μs per phase pulse did show significant differences (p = 0.003 and p = 0.05, respectively). However, it should be noted that for symmetric pulses the flip and switch comparisons are equivalent; thus, this finding is redundant with the comparison made in the Flip analysis.
A final way to render the data is to ignore the original design and simply plot the thresholds as a function of cathode phase duration regardless of phase order and anodal phase duration. This analysis reveals a strongly linear relation, with all blocks showing an R2 > 0.85. Fig. 7 shows all thresholds for the experiment. Block 1 of Rat B is highlighted as a representative sample. This finding helps to summarize the trends seen in the Flip and Switch comparisons by demonstrating that regardless of waveform geometry, the cathode phase duration is the primary factor in determining a given rat’s behavioral threshold for a given constant current, biphasic waveform.
Fig. 7.
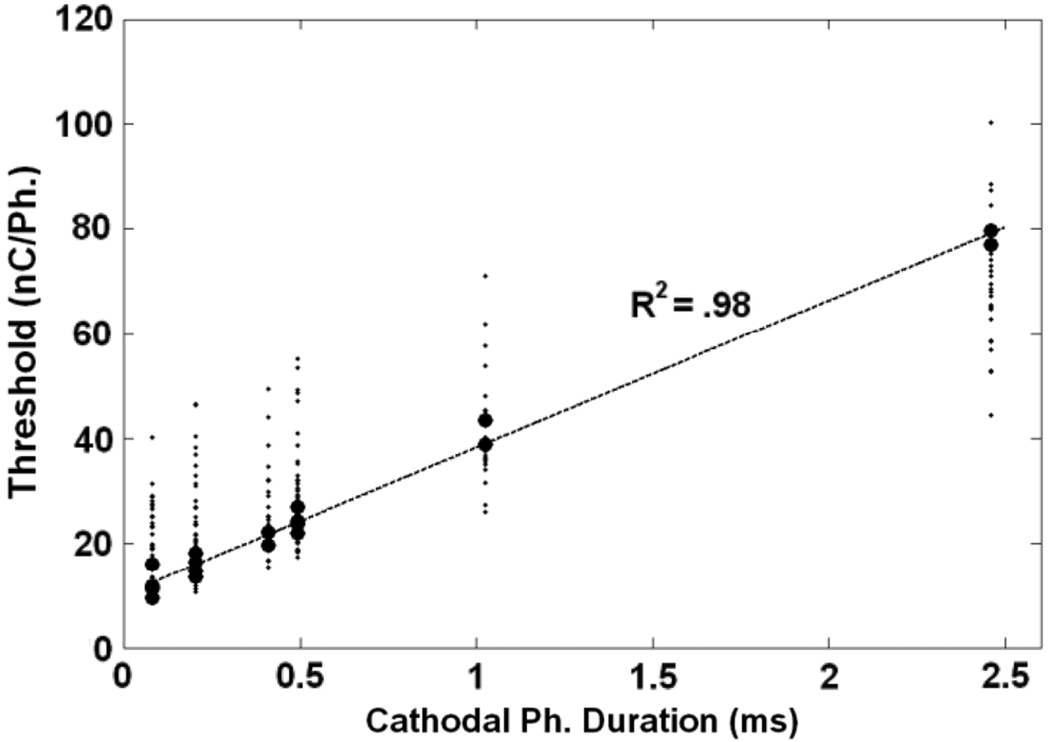
All thresholds generated in the Factorial experiment (n = 250) plotted against their cathode phase duration regardless of anodal asymmetry and order. Block 1 from Rat B is highlighted in order to show the strong linear relationship between threshold and cathode phase duration (R2 = 0.98). All 15 blocks R2 values are above 0.85.
B. Simplified Experiment
While the previous experiment effectively addressed a wide variety of waveforms simultaneously it moderately sacrificed statistical power by adopting a larger block size. Additionally, Tukey’s method for multiple pairwise comparisons provides a relatively conservative estimate for multiple comparisons. A more powerful approach would be to establish a waveform as the designated control and to compare all waveforms with it. Finally, the factorial design was limited in terms of the degree of phase asymmetry. Therefore, we designed the Simplified experiment in order to increase statistical power, to expand on the range of asymmetries studied, and to address the tentative hypothesis that the cathode phase duration was the sole determining factor in threshold level (as suggested by Fig. 7).
Under this design, the cathode phase duration was fixed at 123 μs and only the asymmetry and order of the anode phase were varied. Because the cathode leading symmetric pulse is the one most typically used in ICMS, it was declared as the “control” and threshold means for all other waveform were compared to it. Two rats were used for this experiment (B and H). Analysis for interaction between rat and waveform in mean threshold level reveals no statistically significant effect (p = 0.85). Therefore, the thresholds for both rats were lumped and Dunnett’s method for multiple pairwise comparisons to control was used.
Fig. 8 represents the least squares estimate of the threshold means for the indicated waveform. The only waveform that showed a significant difference from the symmetric, cathode leading pulse was the symmetric anode leading pulse (p < 0.0001). All asymmetric pulse showed no statistically significant difference from control. Waveforms with PAF = 0.1, 0.2, 5, 10 had significance levels of p = 0.99, 0.99, 0.28, 0.84, respectively.
Fig. 8.
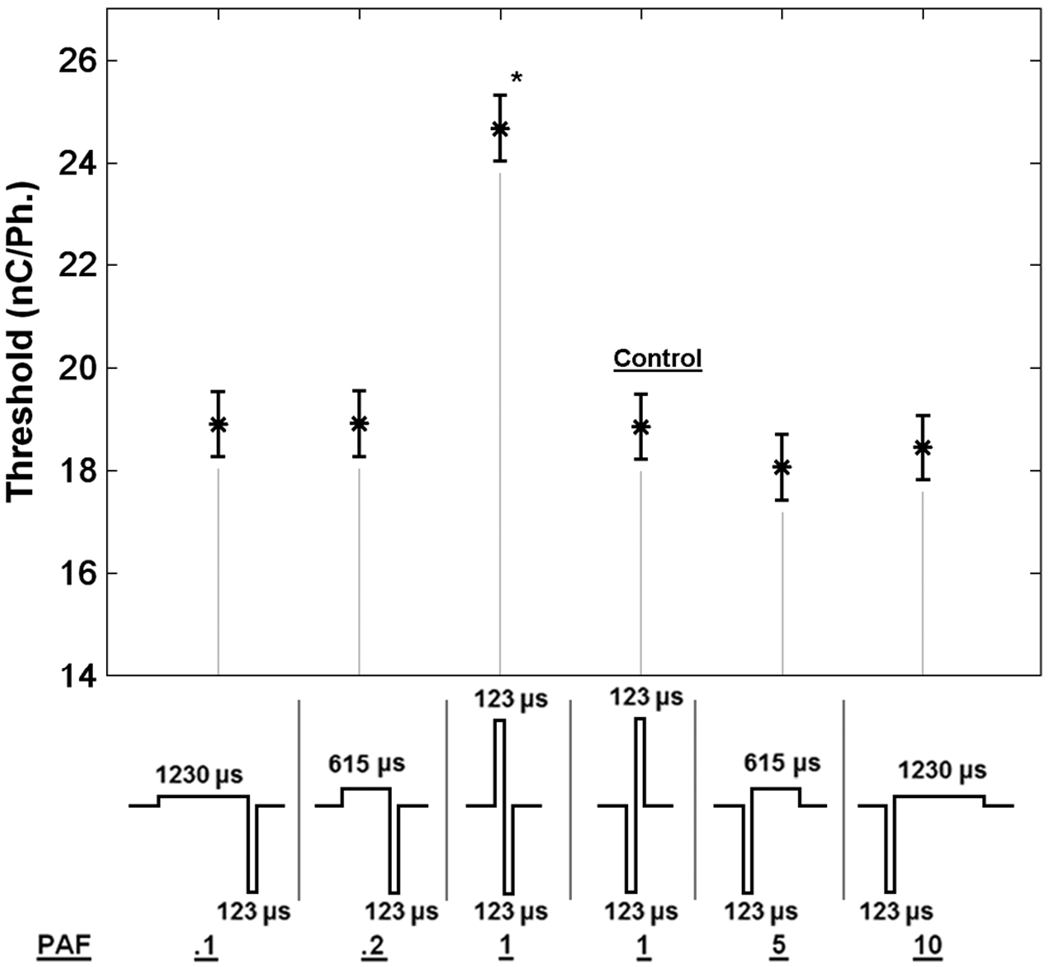
Analysis of simplified design. In order to test the hypothesis that cathode phase duration alone determined threshold levels, the cathode phase was fixed at 123 μs and the asymmetry and phase order were varied. The cathode leading, symmetric pulse was designated as control and Dunnett’s method for multiple comparisons of main effect to control was used (α = 0.05). The symmetric anode leading waveform showed the only significant difference from control (p < 0.0001).
IV. Discussion
The purpose of this study was to evaluate the relative efficacy of alternative forms of the charged balance, biphasic waveform in ICMS for the purpose of generating behaviorally detectable sensation within the subject. This work is partly motivated by a desire to minimize power consumption, but more importantly to minimize damage to the stimulating electrodes [33] as well as to the tissue [14]. This study demonstrated that the primary determinate of threshold level was the cathode phase duration; phase asymmetry did not significantly affect the detection threshold when compared with cathode phase leading pulses of equal phase duration. The only waveforms to significantly deviate from this trend were anode leading pulses with phase duration less than 205 μs.
The least surprising of these findings is that anode leading symmetric pulses had higher detection thresholds than cathode leading pulses of equal phase duration. This has been established previously in the visual cortex of monkeys [34], [35] as well as in humans [36]. Additionally, it is supported by decades of work on the biophysics of electrical stimulation, which has demonstrated the role of current direction in depolarizing axonal membranes [37], [38] and that ICMS predominately stimulates these elements of the neurons [39], [40].
The more surprising finding was that phase asymmetry seemed to provide no benefit when compared with symmetric, cathode phase leading pulses. Nevertheless, modeling work has suggested that such asymmetric pulses could more effectively stimulate axons by minimizing the role of the hyperpolarizing anode phase or by exploiting it to “condition” the inactivation gates of the sodium channels thus lowering their threshold for the cathode phase [19], [20]. Furthermore, these pseudo-monophasic pulses have been shown to significantly reduce the threshold level in cochlear implants [41], [42]. There are many possible explanations for this apparent contradiction.
First, to the authors’ knowledge this is the first behavioral experiment addressing waveform asymmetry in ICMS, while other studies have focused on peripheral structures. Furthermore, the heterogeneity in the tissue surrounding the electrode could result in distorted electric fields with respect to the neuronal geometry. Additionally, it should be noted that stimulation levels, in terms of charge per phase, charge density, and pulse rate were above levels that have shown histological evidence of tissue damage [14] as well as electrode damage [43]. At these levels it is possible that damage to the tissue, electrode or both may have confounded the analysis of waveform effects. However, while we had no way of directly assessing the state of the neural tissue before and after stimulation, impedance spectroscopy was performed before and after stimulation to monitor the electrode integrity throughout the experiment and no signs of electrode damage were apparent.
Additionally, these high threshold levels (> 10 nC/Ph.) suggest that a large and diverse population of neurons is being activated and that this large population is blunting the observable effects of the waveform on specific elements within the population. Finally, the proper combination of cathode phase duration and anode phase asymmetry may not have been within the scope of either experiment reported here. It should be noted that the small number of rats and site depths reduced the power of the analysis to detect significance differences in the detection thresholds of different stimulus waveforms, particularly in the case of asymmetric anode leading pulse, which could have a moderate effect of raising thresholds although to a lesser degree than the symmetric anode leading pulses.
Future work will likely benefit from a more systematic exploration of site depth [35] as well as time post implant. Because these were not well controlled elements of the experimental design the analysis was limited to concluding that for the purpose of this paper these factors did not seem to significantly alter the relative delectability of the various waveforms. However, it is likely that this study was underpowered in thoroughly assessing any more subtle interactions between these effects. Additionally, this study did not evaluate the potential role of a phase delay which has been shown to significantly affect threshold level of cochlear implant users [41], [42] as well as in ICMS in human subjects, decreasing the threshold by 5.4% when a 100 μs delay is added to cathode-leading symmetric 200 μs per phase pulses [36]. Furthermore, these experiments were performed in animals that had been implanted with electrode arrays for at least two and a half weeks (one animal) and often for over two months during which time the reactive tissue response [44] may have significantly altered the cytoarchitecture of the cortical column. Future work will explore the longitudinal effects of ICMS on detection thresholds as well as the effects of other stimulation waveforms and parameters [45].
Acknowledgment
The authors would like to thank the Purdue NeuroProstheses Research lab for helping with the preparation of this manuscript, A. Woolley for help with the figures, J. Dunn for amanuensis, S. Wilks electrode prep, J. Jones, M. Boing, and K. Rupp for development of the electrical hardware, and J. Brenner and O. Regele for helping with rat handling.
This work was supported by the National Institutes of Health (R03DC009339-02 (NIDCD).
Biographies
Andrew S. Koivuniemi received the B.E. degree in engineering (summa cum laude) from Vanderbilt University, Nashville, TN, in 2007, majoring in biomedical engineering and philosophy.
Since 2007 he has been a member of the Indiana University School of Medicine and Purdue University Medical Scientist Training Program. His research interests include neuroprosteses and neuromodulation technologies.

Kevin J. Otto (M’94) received the B.S. degree in chemical engineering from Colorado State University, Fort Collins, in 1997, and the M.S. and Ph.D. degrees in bioengineering from Arizona State University, Tempe, in 2002 and 2003, respectively.
From 2003 to 2006, he was a Post-Doctoral Fellow in the Department of Biomedical Engineering and the Department of Otolaryngology at the University of Michigan, Ann Arbor, where his work focused on cochlear implants. He is currently an Assistant Professor in the Department of Biological Sciences and Biomedical Engineering at Purdue University. His research interests include neuroprostheses, systems neuroscience, and neurotechnologies.

Footnotes
Digital Object Identifier 10.1109/TNSRE.2011.2166563
Contributor Information
Andrew S. Koivuniemi, Weldon School of Biomedical Engineering, Purdue University, West Lafayette, IN 47907 USA
Kevin J. Otto, Department of Biological Sciences and the Weldon School of Biomedical Engineering, Purdue University, West Lafayette, IN 47907 USA.
References
- [1].Romo R et al., “Somatosensory discrimination based on cortical microstimulation,” Nature, vol. 392, pp. 387–390, 1998. [DOI] [PubMed] [Google Scholar]
- [2].Romo R et al., “Sensing without touching: Psychophysical performance based on cortical microstimulation,” Neuron, vol. 26, pp. 273–278, 2000. [DOI] [PubMed] [Google Scholar]
- [3].O’Doherty JE et al., “A brain-machine interface instructed by direct intracortical microstimulation,” Front Integr. Neurosci, vol. 3, p. 20, 2009. [DOI] [PMC free article] [PubMed] [Google Scholar]
- [4].Fitzsimmons NA et al., “Primate reaching cued by multichannel spatiotemporal cortical microstimulation,” J. Neurosci, vol. 27, pp. 5593–5602, May 23, 2007, 2007. [DOI] [PMC free article] [PubMed] [Google Scholar]
- [5].London BM et al., “Electrical stimulation of the proprioceptive cortex (area 3a) used to instruct a behaving monkey,” IEEE Trans. Neural Syst. Rehabil. Eng, vol. 16, no. 2, pp. 32–36, Feb. 2008. [DOI] [PMC free article] [PubMed] [Google Scholar]
- [6].Bak MJ et al., “Visual sensations produced by intracortical microstimulation of the human occipital cortex.,” Med. Biol. Eng. Comput, vol. 28, pp. 257–259, May 1990. [DOI] [PubMed] [Google Scholar]
- [7].Bartlett JR and Doty RW, “An exploration of the ability of macaques to detect microstimulation of striate cortex.,” Acta Neurobiologiae Experimentalis, vol. 40, pp. 713–727, 1980. [PubMed] [Google Scholar]
- [8].Tehovnik EJ et al., “Saccadic eye movements evoked by microstimulation of striate cortex,” Eur. J. Neurosci, vol. 17, pp. 870–878, 2003. [DOI] [PubMed] [Google Scholar]
- [9].Otto KJ et al., “Microstimulation in auditory cortex provides a substrate for detailed behaviors,” Hear. Res, vol. 210, pp. 112–117, 2005. [DOI] [PubMed] [Google Scholar]
- [10].Rousche PJ and Normann RA, “Chronic intracortical microstimulation (ICMS) of cat sensory cortex using the Utah intracortical electrode array,” IEEE Trans. Rehabil. Eng, vol. 7, no. 1, pp. 56–68, Mar. 1999. [DOI] [PubMed] [Google Scholar]
- [11].Scheich H and Breindl A, “An animal model of auditory cortex prostheses,” Audiol. Neurootol, vol. 7, pp. 191–194, May-Jun 2002. [DOI] [PubMed] [Google Scholar]
- [12].McCreery DB et al., “A characterization of the effects on neuronal excitability due to prolonged microstimulation with chronically implanted microelectrodes,” IEEE Trans. Biomed. Eng, vol. 44, no. 10, pp. 931–939, Oct. 1997. [DOI] [PubMed] [Google Scholar]
- [13].McCreery DB et al., “The effects of prolonged intracortical microstimulation on the excitability of pyramidal tract neurons in the cat,” Ann. Biomed. Eng, vol. 30, pp. 107–119, Jan. 2002. [DOI] [PubMed] [Google Scholar]
- [14].McCreery DB et al., “Neuronal loss due to prolonged controlled-current stimulation with chronically implanted microelectrodes in the cat cerebral cortex,” J. Neural Eng, vol. 7, p. 036005, 2010. [DOI] [PMC free article] [PubMed] [Google Scholar]
- [15].Lilly JC et al., “Brief, noninjurious electric waveform for stimulation of the brain,” Science, vol. 121, pp. 468–469, Apr. 1, 1955. [DOI] [PubMed] [Google Scholar]
- [16].Brummer SB and Turner MJ, “Electrical stimulation with Pt electrodes: I-A method for determination of “real” electrode areas,” IEEE Trans. Biomed. Eng, vol. 24, no. 5, pp. 436–439, Sep. 1977. [DOI] [PubMed] [Google Scholar]
- [17].Brummer SB and Turner MJ, “Electrical stimulation with Pt electrodes: II-Estimation of maximum surface redox (theoretical non-gassing) limits,” IEEE Trans. Biomed. Eng, vol. 24, no. 5, pp. 440–443, Sep. 1977. [DOI] [PubMed] [Google Scholar]
- [18].Rose TL and Robblee LS, “Electrical stimulation with Pt electrodes. VIII. Electrochemically safe charge injection limits with 0.2 mspulses,” IEEETrans. Biomed.Eng, vol.37,no. 11,pp. 1118–1120, Nov. 1990. [DOI] [PubMed] [Google Scholar]
- [19].McIntyre C and Grill W, “Selective microstimulation of central nervous system neurons,” Ann. Biomed. Eng, vol. 28, pp. 219–233, 2000. [DOI] [PubMed] [Google Scholar]
- [20].McIntyre CC and Grill WM, “Extracellular stimulation of central neurons: Influence of stimulus waveform and frequency on neuronal output.,” J. Neurophysiol, vol. 88, pp. 1592–1604, Oct. 2002. [DOI] [PubMed] [Google Scholar]
- [21].Miller CA et al., “Auditory nerve responses to monophasic and biphasic electric stimuli,” Hear. Res, vol. 151, pp. 79–94, Jan. 2001. [DOI] [PubMed] [Google Scholar]
- [22].Rubinstein JT et al., “Analysis of monophasic and biphasic electrical stimulation of nerve.,” IEEE Trans. Biomed. Eng, vol. 48, no. 10, pp. 1065–1070, Oct. 2001. [DOI] [PubMed] [Google Scholar]
- [23].Kelly JB et al., “Behavioral limits of auditory temporal resolution in the rat: Amplitude modulation and duration discrimination,” J. Comp. Psychol., vol. 120, pp. 98–105, May 2006. [DOI] [PubMed] [Google Scholar]
- [24].Heffner HE et al., “Audiogram of the hooded Norway rat,” Hear. Res, vol. 73, pp. 244–247, Mar. 1994. [DOI] [PubMed] [Google Scholar]
- [25].Green DM and Swets JA, Signal Detection Theory and Psychophysics. New York: Wiley, 1966. [Google Scholar]
- [26].Levitt H, “Transformed up-down methods in psychoacoustics,” J. Acoust. Soc. Am, vol. 49, p. Suppl 2:467+, Feb. 1971. [PubMed] [Google Scholar]
- [27].Macmillan NA and Creelman CD, Detection Theory: A User’s Guide. Cambridge, U.K.: Cambridge Univ. Press, 1991. [Google Scholar]
- [28].Kelly JB and Masterton B, “Auditory sensitivity of the albino rat.,” J. Comparative Physiol. Psychol, vol. 91, pp. 930–936, Aug. 1977. [DOI] [PubMed] [Google Scholar]
- [29].Kipke DR et al., “Silicon-substrate intracortical microelectrode arrays for long-term recording of neuronal spike activity in cerebral cortex,” IEEE Trans. Neural Syst. Rehabil Eng, vol. 11, no. 2, pp. 151–155, Jun. 2003. [DOI] [PubMed] [Google Scholar]
- [30].Vetter RJ et al., “Chronic neural recording using silicon-substrate microelectrode arrays implanted in cerebral cortex.,” IEEE Trans. Biomed. Eng, vol. 51, no. 6, pp. 896–904, Jun. 2004. [DOI] [PubMed] [Google Scholar]
- [31].Sally SL and Kelly JB, “Organization of auditory cortex in the albino rat: Soundfrequency.,” J. Neurophysiol, vol. 59, pp. 1627–1638, May 1988. [DOI] [PubMed] [Google Scholar]
- [32].Robblee LS et al., “Activated Ir—An electrode suitableforreversible charge injection in saline solution.,” J. Electrochem. Soc, vol. 130, pp. 731–733, 1983. [Google Scholar]
- [33].Cogan SF et al., “Over-pulsing degrades activatediridiumoxide films used for intracortical neural stimulation,” J. Neurosci. Methods, vol. 137, pp. 141–150, 2004. [DOI] [PubMed] [Google Scholar]
- [34].Bartlett JR et al., “Psychophysics of electrical stimulation of striate cortex in macaques,” J. Neurophysiol, vol. 94, pp. 3430–3442, Nov. 2005. [DOI] [PubMed] [Google Scholar]
- [35].Tehovnik EJ and Slocum WM, “Depth-dependent detection of microampere currents delivered to monkey V1,” Eur. J. Neurosci, vol. 29, pp. 1477–1489, Apr. 2009. [DOI] [PMC free article] [PubMed] [Google Scholar]
- [36].Schmidt EM et al., “Feasibility of a visual prosthesis for the blind based on intracortical microstimulation of the visual cortex.,” Brain, vol. 119, pt. 2, pp. 507–522, Apr. 1996. [DOI] [PubMed] [Google Scholar]
- [37].Stoney SD Jr. et al., “Excitation of pyramidal tract cells by intracortical microstimulation: Effective extent of stimulating current,” J. Neurophysiol, vol. 31, pp. 659–669, Sep. 1968. [DOI] [PubMed] [Google Scholar]
- [38].Ranck JJB, “Which elements are excited in electrical stimulation of mammalian central nervous system: A review,” Brain Res, vol. 98, pp. 417–440, 1975. [DOI] [PubMed] [Google Scholar]
- [39].Nowak LG and Bullier J, “Axons, but not cell bodies, are activated by electrical stimulation in cortical gray matter. I. Evidence from chron-axie measurements,” Exp. Brain Res, vol. 118, pp. 477–488,Feb. 1998. [DOI] [PubMed] [Google Scholar]
- [40].Nowak LG and Bullier J, “Axons, but not cell bodies, are activated by electrical stimulation in cortical gray matter. II. Evidence from selective inactivation of cell bodies and axon initial segments,” Exp. Brain Res, vol. 118, pp. 489–500, Feb. 1998. [DOI] [PubMed] [Google Scholar]
- [41].Macherey O et al., “Asymmetric pulses in cochlear implants: Effects of pulse shape, polarity, and rate,” J. Assoc. Res. Otolaryngol, vol. 7, pp. 253–266, 2006. [DOI] [PMC free article] [PubMed] [Google Scholar]
- [42].van Wieringen A et al., “Alternative pulse shapes in electrical hearing,” Hear. Res, vol. 242, pp. 154–163, Aug. 2008. [DOI] [PubMed] [Google Scholar]
- [43].Hu Z et al., “In vitro and in vivo charge capacity of AIROF microelectrodes,” in Proc. IEEEEng. Med. Biol. Soc. Conf, 2006, vol. 1,pp. 886–889. [DOI] [PubMed] [Google Scholar]
- [44].Biran R et al., “Neuronal cell loss accompanies the brain tissue response to chronically implanted silicon microelectrode arrays,” Exp. Neurol, vol. 195, pp. 115–126, Sep. 2005. [DOI] [PubMed] [Google Scholar]
- [45].Freeman DK et al., “Selective activation of neuronal targets with sinusoidal electric stimulation,” J. Neurophysiol, vol. 104, pp. 2778–2791, Nov. 1, 2010, 2010. [DOI] [PMC free article] [PubMed] [Google Scholar]


