Abstract
Objective.
Somatosensation is critical for effective object manipulation, but current upper limb prostheses do not provide such feedback to the user. For individuals who require use of prosthetic limbs, this lack of feedback transforms a mundane task into one that requires extreme concentration and effort. Although vibrotactile motors and sensory substitution devices can be used to convey gross sensations, a direct neural interface is required to provide detailed and intuitive sensory feedback. The viability of intracortical microstimulation (ICMS) as a method to deliver feedback depends in part on the long-term reliability of implanted electrodes used to deliver the stimulation. The objective of the present study is to investigate the effects of chronic ICMS on the electrode–tissue interface.
Approach.
We stimulate the primary somatosensory cortex of three Rhesus macaques through chronically implanted electrodes for 4 h per day over a period of six months, with different electrodes subjected to different regimes of stimulation. We measure the impedance and voltage excursion as a function of time and of ICMS parameters. We also test the sensorimotor consequences of chronic ICMS by having animals grasp and manipulate small treats.
Main results.
We show that impedance and voltage excursion both decay with time but stabilize after 10–12 weeks. The magnitude of this decay is dependent on the amplitude of the ICMS and, to a lesser degree, the duration of individual pulse trains. Furthermore, chronic ICMS does not produce any deficits in fine motor control.
Significance.
The results suggest that chronic ICMS has only a minor effect on the electrode–tissue interface and may thus be a viable means to convey sensory feedback in neuroprosthetics.
Keywords: intracortical microstimulation, electrode–tissue interface, impedance, voltage excursion
Introduction
Somatosensory feedback is critical for dexterous object manipulation. Without it, simple activities of daily living, such as turning a door knob, or tying one’s shoes, are slow, clumsy and effortful [1]. The development of sophisticated robotic prostheses [2], along with powerful algorithms to decode motor intention from neuronal populations in the cortex to control these devices [3–7], has created a demand for the incorporation of detailed and intuitive sensory feedback in upper limb neuroprostheses. Although vibrotactile motors and sensory substitution devices can be used to convey gross sensations [8, 9], a direct neural interface may be required to provide sensory feedback to guide the control of a prosthesis with many degrees of freedom.
One such interface is intracortical microstimulation (ICMS), which consists of directly activating cortical neurons to convey informative sensations about the state of the prosthetic limb or about events impinging upon the limb [10–14]. The viability of this approach requires that the electrodes that deliver the electrical pulses to the brain, and the tissue in their immediate vicinity, remain functional over long periods of time. With this in mind, it is important to ascertain over what range of ICMS electrodes remain operative, and what effect, if any, chronic stimulation has on the electrode–tissue interface.
While platinum electrodes are often used, they have a low charge injection capacity [15]. Alternatively, iridium electrodes allow for electrochemical activation, which leads to the formation of iridium oxide, which in turn leads to a much higher charge injection capacity [16]. More recently, sputtered iridium oxide film (SIROF) coatings have been developed that have similar benefits to their activated iridium oxide counterparts and are more mechanically robust ([17], see [18] for a review).
While SIROF electrodes have been tested in vitro [19, 20], their safety and performance have yet to be extensively tested in vivo. Davis et al [21] demonstrated that SIROF electrodes, implanted chronically in V1 of macaque, could elicit behavioral responses, and that stimulation thresholds tended to increase over time. However, further characterization of the effects of microstimulation through chronically implanted SIROF electrodes is necessary to support their more widespread use in cortical microstimulation.
As one step toward addressing these issues, we subjected chronically implanted electrodes to different regimes of ICMS over a period of six months and systematically measured the electrode impedance and voltage excursions to monitor changes in the electrode–tissue interface. Stimulation regimes were designed to include pulse parameters that have been previously demonstrated to be safe with other electrode technologies as well as parameters where long-term safety has yet to be conclusively established. Behavioral assays of performance, such as measurements of detection threshold, require varying stimulus parameters, which can complicate the interpretation of longitudinal measurements. We demonstrate that impedances (at 1 kHz) on electrodes subject to chronic microstimulation (300 pulses per second, 4 h per day, five days a week for six months) at 2 and 4 nC/phase (10 and 20 μA pulses) are not significantly different than unstimulated control electrodes and that electrodes stimulated at 20 nC/phase (100 μA pulses) stabilized at ~70% of the impedance of unstimulated control electrodes. We believe that these results support further use of chronic microstimulation pulses within this range of stimulation parameters.
Methods
Arrays
ICMS was delivered to the primary somatosensory cortex via Utah electrode arrays (UEAs, Blackrock Microsystems, Salt Lake City, UT) with Cereport connectors. The electrode tips were coated in a SIROF by Blackrock Microsystems using their standard process. SIROF coatings on these arrays have been previously described [19, 20]. Briefly, the electrode tips were first coated with iridium metal then with SIROF [17]. The electrode shaft was insulated with parylene-C along its length, with the exception of the tip, which has a targeted exposure length of 40 μm. Each monkey was implanted with two UEAs: one (array 1) was posterior and medial to the other (array 2).
Subjects
Two male and one female rhesus macaques were each surgically implanted with two UEAs in the somatosensory cortex. Two of the monkeys were research naïve prior to the study, and the third was involved in a study that did not involve the brain. All monkeys were between 6 and 8 years of age at the date of implantation. All procedures were approved by the University of Chicago Institutional Animal Care and Use Committee (IACUC) and complied with the guidelines set by the Association for Assessment and Accreditation of Laboratory Animal Care (AAALAC) International.
Surgical implantation
Subjects were administered atropine (0.04 mg kg−1, IM) preoperatively. Animals were anesthetized with a ketamine hydrochloride (2–3 mg kg−1) and dexmedetomidine mix (75 μg kg−1) administered intravenously, placed in a stereotaxic coordinator, intubated, and maintained with isoflura (1–3%). Animals were maintained with IV fluids and remifentanil (0.1–0.5 μg kg−1 min−1). The scalp was shaved and sterilized, and a sterile field was established. A central incision was made; the skin and muscle were retracted, exposing the skull above the left central sulcus. A craniotomy was made, approximately 2 cm × 2 cm. A dural flap was created, exposing the cortex. The hand representation of primary somatosensory cortex (areas 1 and 2) was identified based on stereotaxic coordinates and anatomical landmarks. Cereport connectors were attached to the skull, and UEAs were implanted with a high-speed pneumatic inserter. Goretex (W L Gore and Associates, Inc., Elkton, MD) was placed over the arrays to protect the dura; the dura was sutured back in place with Nurolon dural sutures (Ethicon, Inc. Somerville, NJ); and the craniotomy was sealed with the original bone flap and secured with titanium straps.
Stimulation protocol
Each animal was subjected to a 4 h block of ICMS, five times a week (at the same time each day), for a period of six months (not including a one-week break during the winter holidays) beginning 9–11 weeks after implantation of the arrays. We report data from the time after onset of stimulation, not the time after array implantation. ICMS trains consisted of anodic-phase first symmetrical pulses [22], with phases lasting 200 μs and separated by 53 μs, delivered at a frequency of 300 Hz using a CereStim R96 (Blackrock Microsystems Inc., Salt Lake City, UT) (figure 1). All stimulation pulses were delivered in a monopolar configuration with the titanium pedestal acting as the return electrode. Each UEA was divided into four non-contiguous quadrants, each receiving a different stimulation regime. Each quadrant consisted of a 4 × 4 grid of 16 electrodes at the corners of the 100-electrode array. Quadrants were separated by rows or columns, two electrodes wide, that received no stimulation (control electrodes) (figure 2(A)). Each quadrant was further divided into two groups of four electrodes and four groups of two electrodes. Stimulation was delivered in six asynchronous sets, each containing one group from each of the four quadrants (figure 2(B)). While electrodes within each quadrant were subjected to pulse trains with the same parameters, the subgroups defined which electrodes would be stimulated synchronously so that a maximum of 12 electrodes per array were simultaneously stimulated at any given time. The goal of this grouping strategy was to control the amount of charge that was instantaneously injected in a localized region of tissue because we found that high levels of current resulted in rhythmic muscle contractions (see Discussion).
Figure 1.
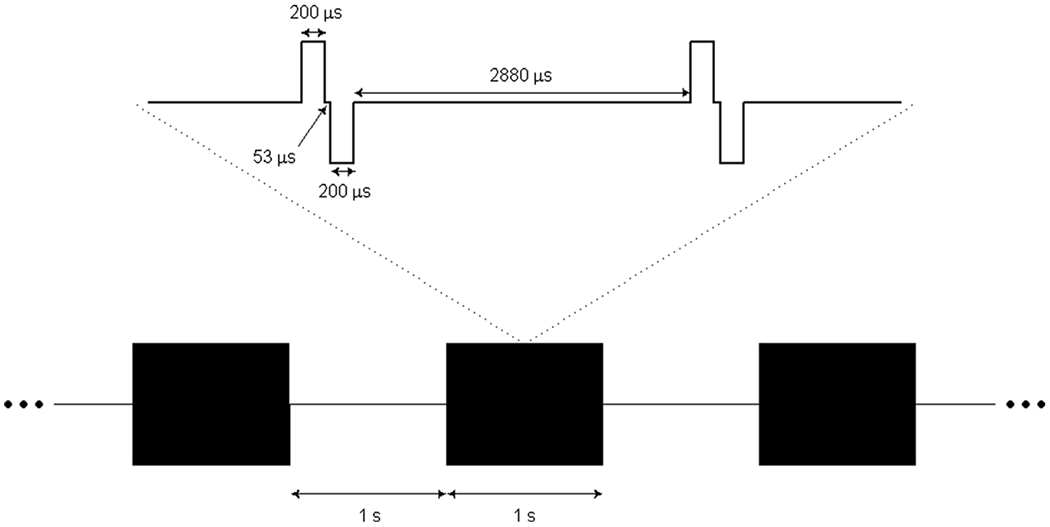
Diagram of charge-balanced stimulation pulse trains at 300 Hz in a 1:1 duty cycle and 1 s interval duration, including a magnified segment of singular pulses with specified phase lengths.
Figure 2.
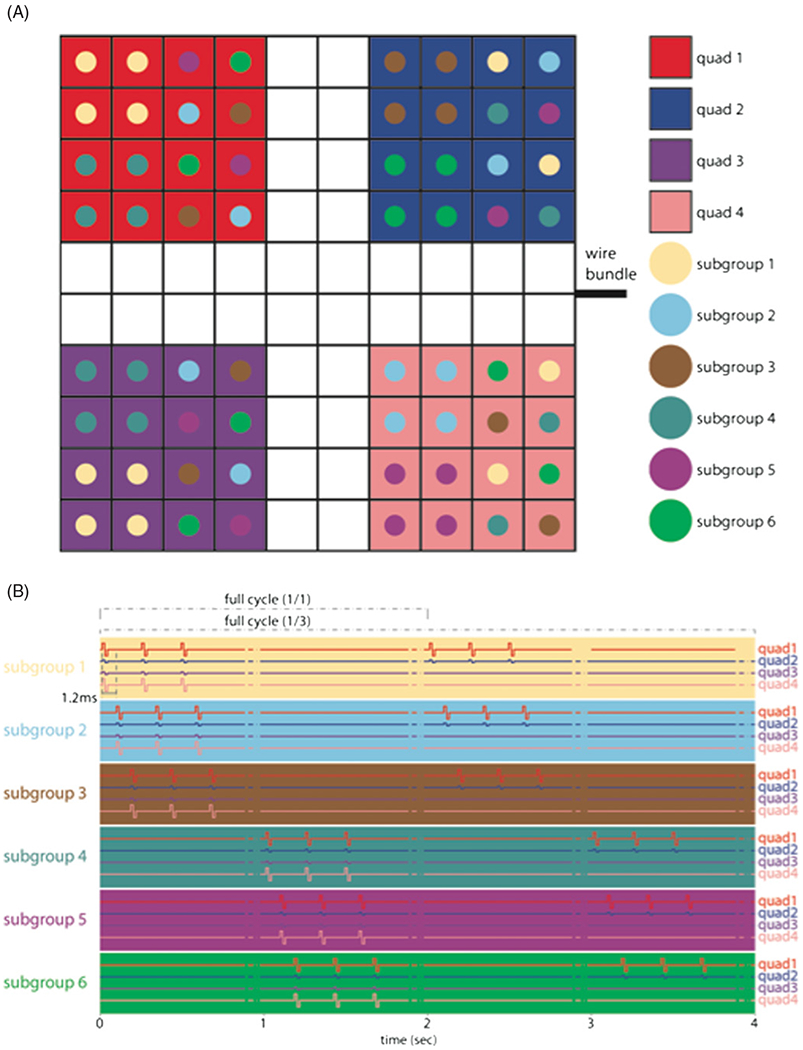
(A) Electrode arrangement in each array. Each quad of electrodes was subjected to a different regime of stimulation (see table 1 for summary). White squares denote control electrodes. (B) Arrays were divided into subgroups designed to control the amount of charge that was simultaneously delivered to the animal. Within a given quadrant, all subgroups were stimulated with the same stimulation parameters.
Three parameters varied across stimulation regimes (table 1 and 2): charge amplitude, duty cycle, and interval duration. Charge amplitudes—20 nC/phase (100 μA), 4 nC/phase (20 μA), and 2 nC/phase (10 μA)—were selected to span a range of amplitudes that have been shown to elicit a wide range of sensations [10, 13] and to test some previously established parameters [23]. Detection thresholds in primates range in amplitude from 4–8 nC/phase [13], but lower thresholds can be achieved by simultaneously stimulating through multiple electrodes [24] (that is, delivering lower currents, down to single digits (μA), through multiple electrodes simultaneously). Thus, 2 nC/phase and 20 nC/phase represented the lower and upper extremes of ICMS respectively and 4 nC/phase served as the lowest threshold for successful sensation. These charge amplitudes correspond to charge densities of 1, 0.5 and 0.1 mC cm−2 assuming the electrodes have an exposed area of ~2000 μm2. Both charge density and charge per phase are important as it has been understood for some time that these parameters play synergistic roles in the behavior of the electrode–tissue interface [25]. While electrode exposure can vary somewhat [20], charge per phase and charge density were below the damage threshold for SIROF electrodes (see figure 14 in [20]). Duty cycle was included as a parameter as it has been shown that different stimulation duty cycles can lead to differential effects in tissue response [23]. The duty cycles were either 1:1 or 1:3, and pulse train durations were either 1 s or 5 s, to span the range of what might occur during object manipulation with a prosthetic hand.
Table 1.
Summary of ICMS charge delivered to each 16-electrode quadrant of each animal. Charge totals are calculated based on one phase of each pulse. Quadrants with the designation ‘variable’ were used as controls for an unrelated experiment and were subjected to variable amounts of stimulation on a daily basis.
| Animal number | Array | Quadrant | Duty cycle | On time (s) | Charge per phase (nC/ph) | Total daily charge (μC) | Total charge (mC) |
|---|---|---|---|---|---|---|---|
| 1191 729 | 1 and 2 | Control | NA | NA | 2, 4, 20 | 2.00 | 0.15 |
| 1191 729 | 1 | 1 | 1/1 | 1 | 20 | 40 202.00 | 5427.15 |
| 1191 729 | 1 | 2 | 1/1 | 1 | 4 | 8042.00 | 1085.55 |
| 1191 729 | 1 | 3 | 1/3 | 1 | 4 | 4022.00 | 542.85 |
| 1191 729 | 1 | 4 | 1/3 | 1 | 20 | 20 102.00 | 2713.65 |
| 1191 729 | 2 | 5 | 1/1 | 5 | 4 | 8042.00 | 1085.55 |
| 1191 729 | 2 | 6 | 1/1 | 5 | 2 | 4022.00 | 542.85 |
| 1191 729 | 2 | 7 | 1/3 | 5 | 4 | 4022.00 | 542.85 |
| 1191 729 | 2 | 8 | Variable | NA | 23.46 | ||
| 1164 560 | 1 and 2 | Control | NA | NA | 2, 4, 20 | 2.00 | 0.16 |
| 1164 560 | 1 | 1 | 1/1 | 1 | 20 | 40 202.00 | 5266.36 |
| 1164 560 | 1 | 2 | 1/1 | 1 | 4 | 8042.00 | 1053.40 |
| 1164 560 | 1 | 3 | 1/3 | 1 | 4 | 4022.00 | 526.78 |
| 1164 560 | 1 | 4 | 1/3 | 1 | 20 | 20 102.00 | 2633.26 |
| 1164 560 | 2 | 5 | 1/1 | 5 | 4 | 8042.00 | 1053.40 |
| 1164 560 | 2 | 6 | 1/1 | 5 | 2 | 4022.00 | 526.78 |
| 1164 560 | 2 | 7 | 1/3 | 5 | 4 | 4022.00 | 526.78 |
| 1164 560 | 2 | 8 | Variable | NA | 125.88 | ||
| 1233 989 | 1 and 2 | Control | NA | NA | 2, 4, 20 | 2.00 | 0.18 |
| 1233 989 | 1 | 1 | 1/1 | 1 | 20 | 40 202.00 | 5266.38 |
| 1233 989 | 1 | 2 | 1/1 | 1 | 4 | 8042.00 | 1053.42 |
| 1233 989 | 1 | 3 | Variable | NA | 92.01 | ||
| 1233 989 | 1 | 4 | 1/3 | 1 | 4 | 4022.00 | 526.80 |
| 1233 989 | 2 | 5 | NA | NA | NA | NA | NA |
| 1233 989 | 2 | 6 | NA | NA | NA | NA | NA |
| 1233 989 | 2 | 7 | 1/1 | 5 | 4 | 8042.00 | 1053.42 |
| 1233 989 | 2 | 8 | 1/3 | 5 | 4 | 4022.00 | 526.80 |
Table 2.
Maximum number of simultaneously stimulated electrodes, and the maximum charge delivered simultaneously.
| Animal | Animal number | Array | Maximum simultaneous electrodes | Maximum simultaneous current (nC) |
|---|---|---|---|---|
| Absinthe/Zig | 1191 729/1164 560 | 1 | 12 | 144 |
| Absinthe/Zig | 1191 729/1164 560 | 2 | 12 | 56 |
| Captain Morgan | 1233 989 | 1 | 12 | 116 |
| Captain Morgan | 1233 989 | 2 | 6 | 24 |
Electrode impedance
Prior to (pre-stim) and after (post-stim) each 4 h stimulation run, we performed an impedance test by delivering a sinusoidal current at 1 kHz, ~10 nA to all electrodes (including control electrodes), simultaneously, using a Cerebus neural signal processor with a patient cable (Blackrock Microsystems Inc., Salt Lake City, UT). Impedance measurements were analyzed offline using custom code in MATLAB (Mathworks, Inc., Natick, MA). Initial impedances (that is, on the first day of stimulation) greater than 800 kΩ were considered out-of-specification (19% of the electrodes, most of which were on one array, which was damaged during sterilization). An additional 2% of the electrodes were excluded due to impedances exceeding 800 kΩ over several measurements later in the study (these eventually recovered to within specification, and so were attributed to transient failure of the impedance measurement apparatus).
Voltage excursion
Prior to (pre-stim) and after (post-stim) each 4 h stimulation block, brief test pulses at 2,4 and 20 nC/phase were delivered in rapid succession to each of the connected electrodes (including control electrodes), and the output anodic and cathodic voltages were recorded for each pulse. The voltage excursion was the magnitude of the difference between these voltage peaks. Voltage excursion measurements constitute an additional metric to assess changes in the electrode–tissue interface over time. The electrode potentials during the inter-phase and inter-pulse intervals were not measured due to limitations in the voltage measurement circuit. Indeed, these measurements were conducted using circuitry contained within the CereStim R96, which was not capable of sampling the entire voltage transient. Data were collected during the last 3.5 months of the study and analyzed offline using MATLAB (Mathworks, Inc., Natick, MA).
Statistics
We performed repeated-measures ANOVAs on impedance and voltage excursion measurements, with charge amplitude, duty cycle, pulse train duration, and time as factors, using MATLAB (Mathworks, Inc., Natick, MA) and SPSS (IBM, Armonk, NY).
Results
Effects of chronic ICMS on electrode impedance
For all stimulation conditions, including the control, electrode impedance measured before each experimental session (pre-stim) dropped rapidly within the first weeks of stimulation (figure 3). Statistical tests revealed a significant effect of chronic ICMS on impedance decay (tables 3(a), (b)), where higher charge per phase generally led to significantly faster decay over time (table 3(a)). Post-hoc tests revealed that only the 20 nC/phase condition differed significantly from the control condition at the end of the study (figure 3(B)). At 4 nC/phase, 5 s pulse trains produced more rapid decay in impedance over time than did the 1 s trains (table 3(a)) but leveled off at the same impedance level. The effect of duty cycle was non-significant across stimulation conditions (table 3(a)).
Figure 3.
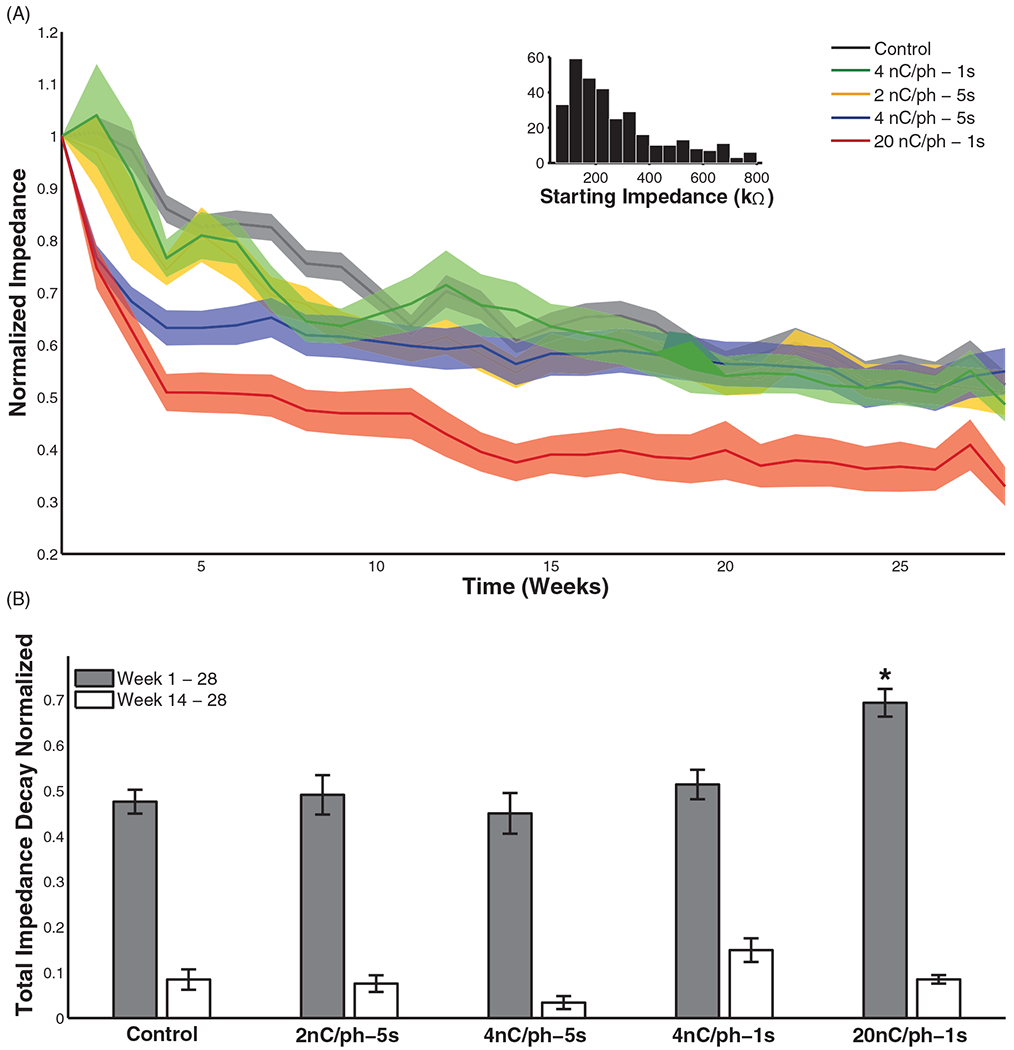
(A) Pre-stim impedance decay over time comparing the effect of stimulation at 2, 4, and 20 nC/phase ICMS as well as 1 and 5 s interval durations, with the 1:1 duty cycle. Values were normalized to the pre-stim impedance on week 1. Shaded region indicates standard error of the mean, reflecting the variability across electrodes subjected to each regime of stimulation at each point in time. (B) Total pre-stim impedance decay from week 1–28 and week 14–28. The only condition that differed significantly from the controls was the 20 nC/phase for week 1–28 (Tukey’s HSD, p < 0.01).
Table 3.
Summary of the statistical tests.
| (a) Pre-stim impedance decay: repeated-measures ANOVA | |
| Weeks | F(26, 10 140) = 101.09, p < 0.01 |
| Weeks × charge per phase | F(52, 10 140) = 1.95, p < 0.01 |
| Weeks × duty cycle | F(26, 10 140) = 0.56, p > 0.05 |
| Weeks × interval duration | F(26, 10 140) = 2.43, p < 0.01 |
| Weeks × interval duration (4 nC/phase only) | F(26, 3198) = 4.28, p < 0.01 |
| (b) Pre-stim impedance total decay: univariate ANOVA | |
| Stimulation condition (week 1–28) | F(4, 290) = 5.16, p < 0.01 |
| Stimulation condition (week 14–28) | F(4, 290) = 1.27, p > 0.05 |
| (c) Impedance drop: repeated-measures ANOVA | |
| Pre- versus post-stim levels | F(1, 302) = 272.38, p < 0.01 |
| (d) Impedance drop: univariate ANOVA | |
| Stimulation condition (week 1) | F(4, 303) = 41.50, p < 0.01 |
| Stimulation condition (week 14) | F(4, 303) = 4.09, p < 0.01 |
| Stimulation condition (week 28) | F(4, 303) = 5.84, p < 0.01 |
| (e) Pre-stim voltage excursion decay: repeated-measures ANOVA | |
| Weeks | F(13, 5070) = 5.58, p < 0.01 |
| Weeks × charge per phase | F(26, 5070) = 1.99, p < 0.01 |
| Weeks × duty cycle | F(13, 5070) = 1.08, p > 0.05 |
| Weeks × interval duration | F(13, 5070) = 2.62, p < 0.01 |
| (f) Pre-stim voltage excursion total decay: univariate ANOVA | |
| Stimulation condition | F(4, 373) = 6.07, p < 0.01 |
| (g) Voltage excursion drop: repeated-measures ANOVA | |
| Pre- versus post-stim levels | F(1, 390) = 98.32, p < 0.01 |
| (h) Voltage excursion drop: univariate ANOVA | |
| Stimulation condition (week 14) | F(4, 360) = 88.36, p < 0.01 |
| Stimulation condition (week 28) | F(4, 374) = 65.95, p < 0.01 |
A significant drop in the impedances of all electrodes was observed between the start and end of each 4 h experimental block (table 3(c)) (figure 4 shows this drop for control electrodes and electrodes stimulated at 20 nC/ph). However, pre-stim impedance levels were consistently restored by the next stimulation day (excluding the progressive decay described above). In the first week of the stimulation, the fractional impedance drop varied significantly between conditions (table 3(d)), where greater drops were seen with high stimulation amplitude and more frequent pulses; at the midpoint of the study, impedance drops varied significantly across conditions, but only the 4 nC/phase-1 s condition differed significantly (post-hoc) from the controls (probably a statistical anomaly); in the last week, the effect of stimulation condition was still significant on impedance drops, but this time only the 20 nC/phase condition differed significantly (post-hoc) from the controls (figure 5). While 20 nC/phase stimulation induced the greatest impedance drop at the onset of ICMS, this stimulation condition had the smallest reversible effect on impedance after chronic impedance levels had leveled off (figure 5). Impedance seemed to have hit a floor and did not drop below this level.
Figure 4.
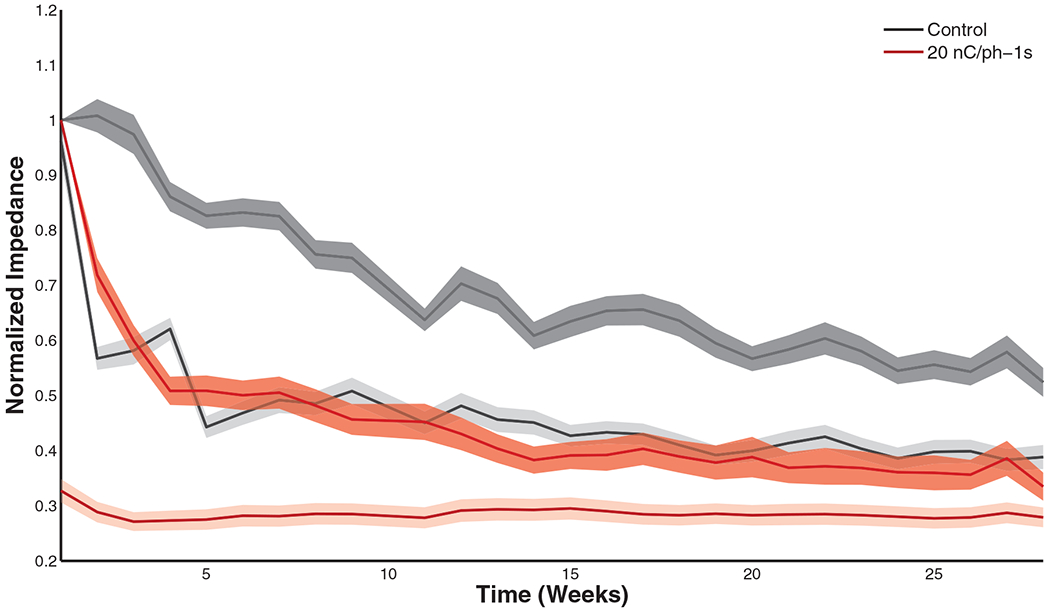
Pre-stim (dark band) and post-stim (light band) impedance decay over time for the control and 20 nC/phase conditions. Shaded region denotes the standard error of the mean. Overall differences between pre- and post-stim were significant (table 3(c)).
Figure 5.
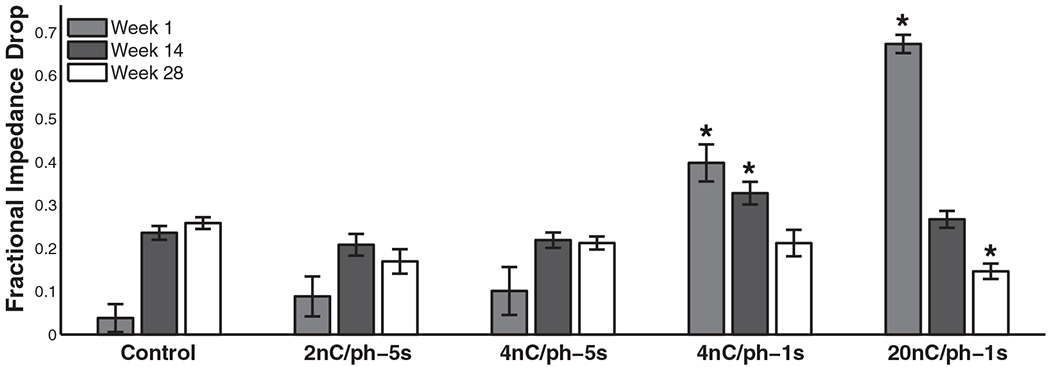
Comparison of the impedance drop as a fraction of pre-stim values after stimulation blocks in the first week (1), midpoint (14), and last week (28) of the study. Post-hoc tests revealed that the 4 nC/phase–1 s and 20 nC/phase condition differed significantly from the controls in the first week; only the 4 nC/phase–1 s condition differed significantly from controls in week 14; and only the 20 nC/phase condition differed significantly from the controls in the last week (Tukey’s HSD, p < 0.01).
Effect of chronic ICMS on voltage excursions
As expected, the relationship between voltage and charge per phase, measured from control electrodes before each stimulation block, was linear over the range tested. Electrodes that delivered higher currents during a stimulation block also yielded smaller voltage excursions in response to a fixed stimulation pulse (20 nC/phase) (figure 6(A)), as expected given the effects of ICMS on impedance documented above. Pre-stim voltage excursions changed significantly over the last 14 weeks of the study when these values were measured (table 3(e)), with a contributing effect of charge per phase as well as pulse train duration. That is, electrodes that delivered greater charge and longer pulse trains exhibited larger decays (figure 6(B)) (table 3(f)). As was the case with impedance, the effects of duty cycle on voltage excursion were non-significant across stimulation conditions (table 3(e)). The decay in voltage excursion over the 14 week period—described in terms of fractional decrement—was comparable to that in impedance over the same time frame for stimulation amplitudes of 4 nC/phase–1 s and 20 nC/phase. In the control and 2 nC/phase condition, the decay in voltage excursion was 8–10% less than that in impedance.
Figure 6.
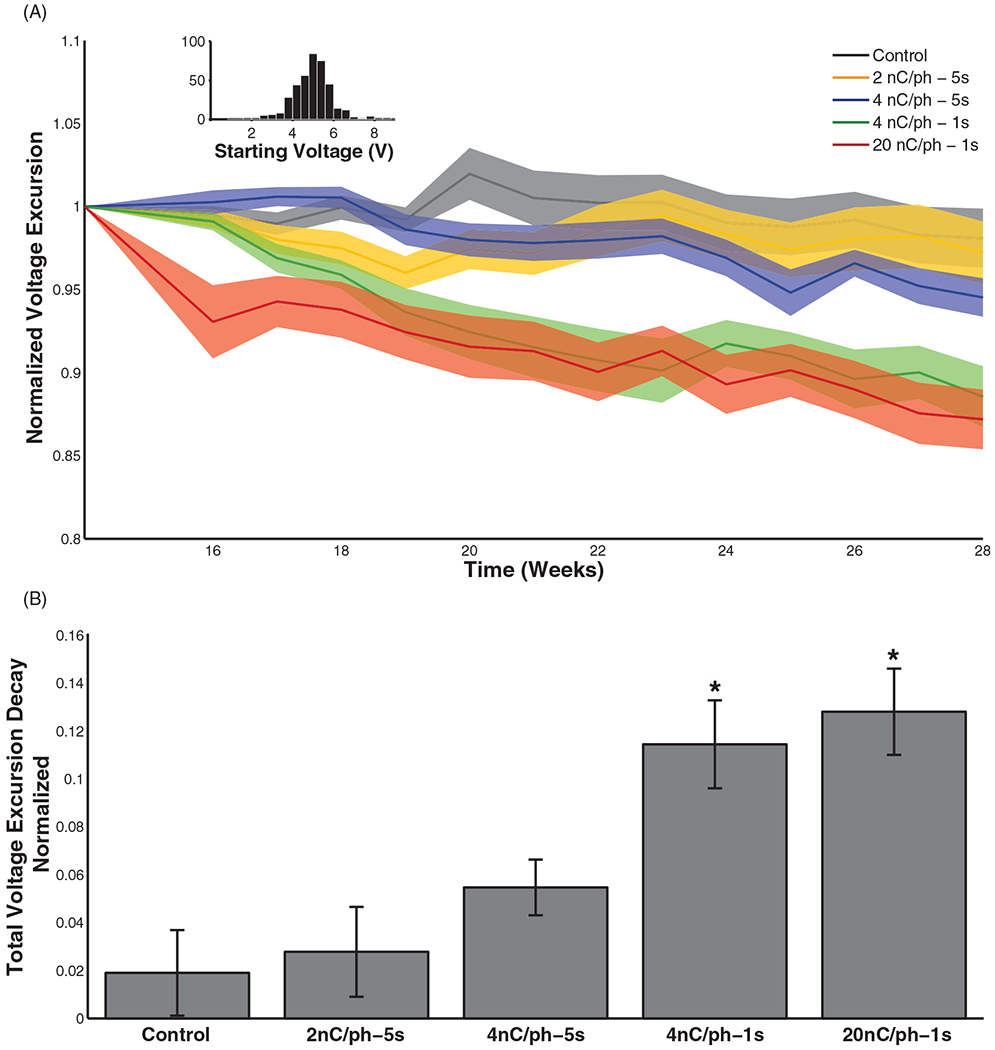
(A) Pre-stim voltage excursion amplitudes (difference between anodic and cathodic voltage peaks) over time (for the last 14 weeks of the study) comparing the effect of stimulation at 2, 4, and 20 nC/phase ICMS as well as 1 and 5 s interval durations. Values were normalized to the pre-stim voltage excursion at week 14. Shaded region indicates standard error of the mean, reflecting the variability across electrodes subjected to each regime of stimulation at each point in time. Inset: histogram of absolute starting voltage excursion amplitudes for all electrodes. (B) Total voltage excursion decay from week 14–28. The 4 nC/phase–1 s and 20 nC/phase stimulation conditions differed significantly from the controls (Tukey’s HSD, p < 0.01). In all stimulation conditions, a 20 nC/phase pulse was used to measure voltage excursions.
Voltage excursions underwent a small but significant drop during each stimulation block (figure 7, table 3(g)) but, as was the case with impedance, were approximately restored to their initial values by the next stimulation session (~20 h later). Unlike their impedance counterparts, (1) voltage excursion drops were significantly greater with high stimulation amplitudes at the end of the study (figure 8) (table 3(h)) and (2) control electrodes experienced little to no change in voltage excursion. In the 20 nC/phase condition, however, the percentage (acute) change in voltage excursion was comparable to the change in its impedance counterpart (~15%) at the end of the study.
Figure 7.
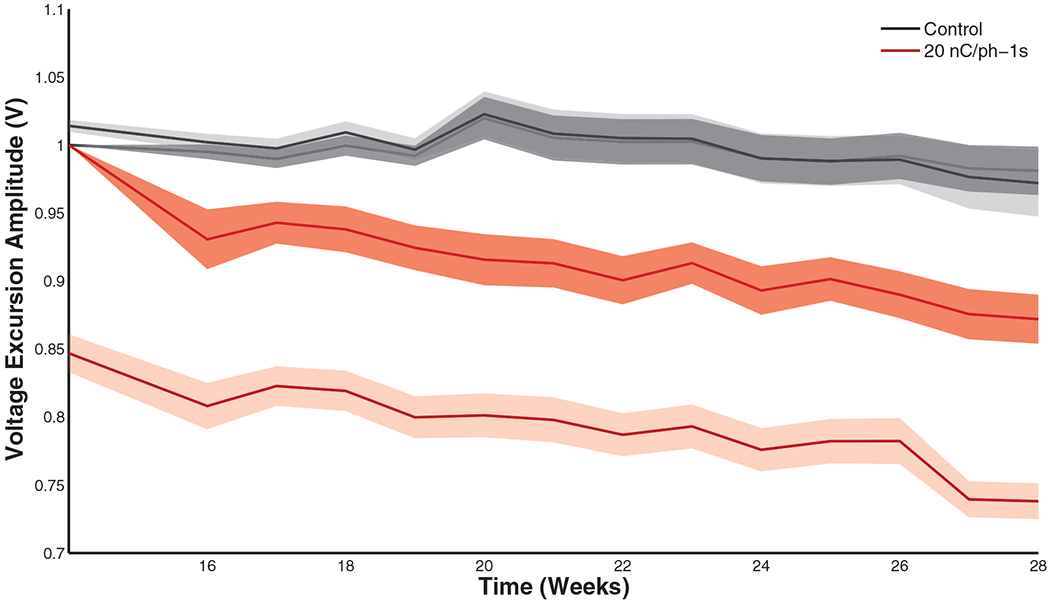
Pre-stim (dark band) and post-stim (light band) voltage excursion amplitudes over time (for the last 14 weeks of the study) for the control and 20 nC/phase conditions. Shaded region indicates standard error of the mean, reflecting the variability across electrodes subjected to each regime of stimulation at each point in time. Overall differences between pre- and post-stim were significant (table 3(g)).
Figure 8.
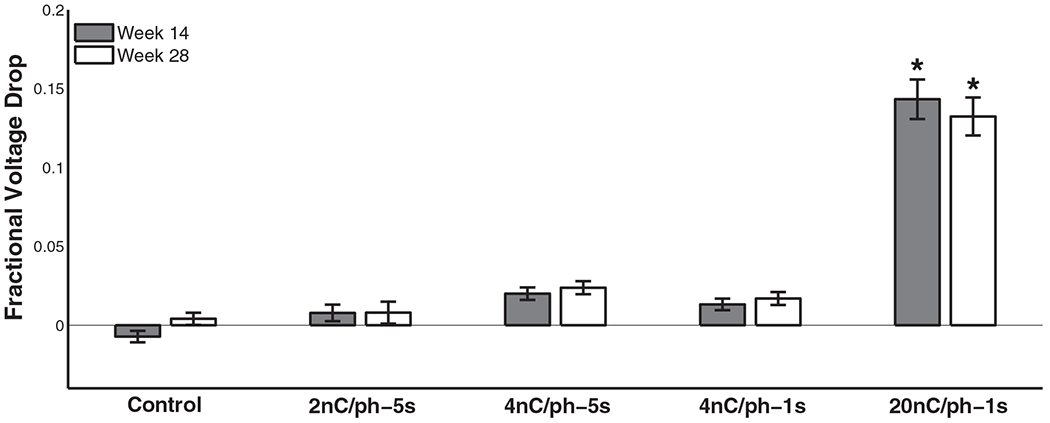
Comparison of the voltage excursion amplitude drop as fraction of pre-stim values after stimulation blocks compared between the midpoint (week 14) of the study and the last week (28). Only the 20 nC/phase stimulation condition differed significantly from the controls at both time points (Tukey’s HSD, p < 0.01).
Behavioral effects of chronic microstimulation
In order to provide a metric of the functional consequences of the long-term microstimulation performed in this study, animals were tested on a grasping task after each stimulation session using small (< 1 cm, e.g. raisin), medium (2–3 cm, e.g. grape) and large (>4 cm, e.g., apple slice) treats; performance on each of the grasps was documented each day. Failure to grasp objects could indicate damage to somatosensory cortex based on the findings that lesions in fingertip regions of S1 can lean to difficulties performing dexterous tasks [26]. None of the animals ever exhibited an impaired ability to grasp or manipulate any of the presented treats. Indeed, the use of the hand contralateral to the stimulation appeared to be completely normal in these daily tests as well as in their behavior in the cage.
In two animals, transient reactions to microstimulation were observed on the first day of stimulation. These reactions consisted of vocalization in one animal, and rhythmic contractions of the contralateral arm in both animals. This behavior stopped as soon as stimulation stopped and normal function was regained within several minutes. In one case this was due to 16 electrodes delivering 20 nC/phase stimulus pulses simultaneously. In the other case, a section of the Cereport filament-film was damaged during sterilization and stimulus pulses were delivered through several electrodes with damaged connections; while the exact cause of the ICMS-induced adverse event is unclear, those electrodes were not used again. Modifications to the stimulus protocol were implemented (which involved minimizing the amount of simultaneously injected current) and no further adverse effects of microstimulation, or any overt ICMS-triggered movements, were ever noted. Furthermore, ICMS of the hand representation in S1 at 16 nC/phase, using an identical preparation, was found not to trigger activity in extrinsic or intrinsic hand muscles (see supporting data for [13]).
Discussion
Chronic decay of electrode impedance
The change in electrode impedance over time was characterized by a sharp decrease over the first few weeks, after which impedance stabilized. The asymptotic impedance levels of stimulated electrodes tended to be similar to those of non-stimulated electrodes with the speed of decay determined by the amplitude and duration of the stimulation trains; 20 nC/phase stimulation was the exception in that it yielded significantly lower asymptotic impedance levels compared to control electrodes.
Previous studies have revealed a pattern of sharp increase in electrode impedance within the first several weeks after implantation of arrays, followed by decay back to baseline over time [27–30], hypothesized to reflect the dynamics of reactive tissue surrounding the site of implantation [31–33]. Wang et al demonstrated in rat motor cortex that after implantation of platinum/iridium electrodes, impedances increased for 5–6 weeks but then decreased and plateaued in the following 5–6 weeks with chronic microstimulation [34]. In the present study, we did not observe such an increase since we began stimulation and impedance measurements 9–11 weeks after implantation, at which time the tissue response to implantation may have stabilized. However, the decay and plateau behavior of electrode impedances subject to chronic stimulation are similar to those shown by Wang et al, but tracked over a longer time scale. The observed changes in electrode impedance on the control electrodes are similar to those reported by Kane et al during long-term implantation of SIROF electrodes in cat cortex [35]. Note that similar changes in impedance are observed in silicon arrays used solely for neural recording [29].
Chronic decay of voltage excursion
Evaluated as the difference between anodic and cathodic amplitudes, voltage excursions decayed over time, an effect that was modulated by charge amplitude and pulse train duration, as was the case with impedance. However, the magnitude of the decay was lower than that observed for impedance. Voltage excursions reflect the impedance of the incident current square waves, which contain a range of frequencies, with a lower bound at the reciprocal of the pulse width, in this case 5000 Hz. The differential decay of impedance and voltage excursions suggests that the impedance at 1000 Hz decreases proportionally more than does that at 5000 Hz and above [31,36]. Given that ICMS usually involves square wave pulses rather than sinusoids, voltage excursions may provide a more relevant measure of the electrode–tissue interface than does impedance at 1000 Hz. That chronic ICMS did not have identical effects on impedance and voltage excursion highlights the fact that these two measures are not interchangeable (figure 9(A)).
Figure 9.
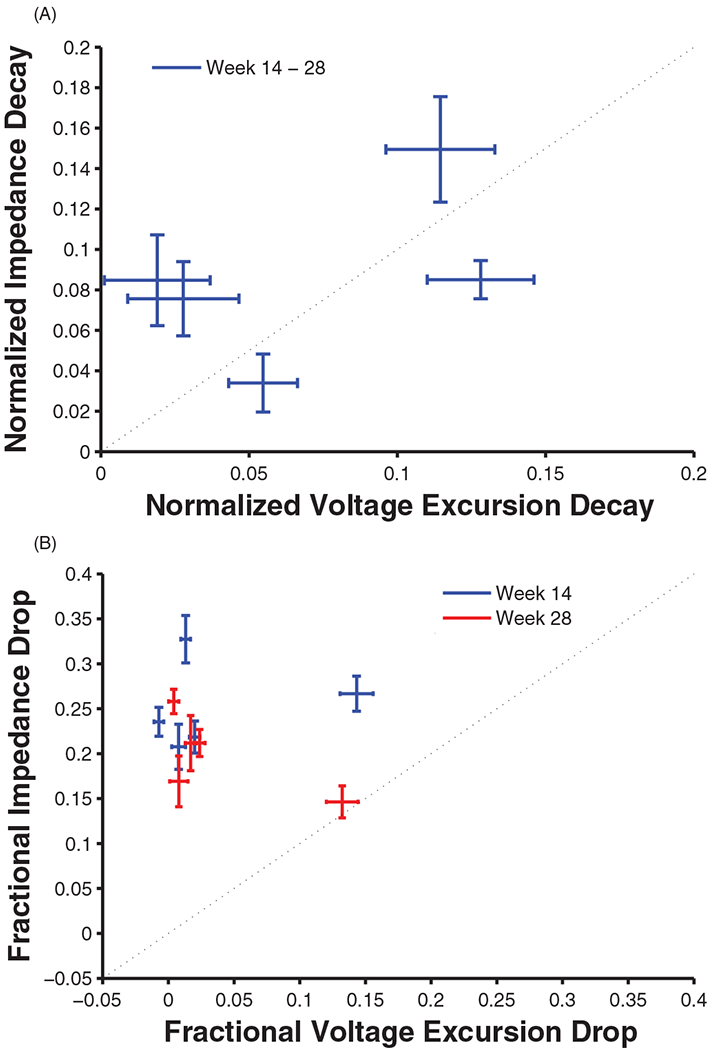
(A) Relationship between impedance decay and voltage excursion decay. Each data point represents one of the stimulation conditions. (B) Relationship between acute (reversible) impedance drop and acute voltage excursion drop. The effects of ICMS on impedance and voltage excursion are not identical.
Reversible drop in impedance
In addition to the slow decay over time, electrode impedance exhibited a temporary decrease from pre-stim to post-stim that was restored by the following experimental session (~20 h later) (cf [27,28, 37–39]). This effect is similar to the transient changes in electrode impedance reported in attempts to ‘rejuvenate’ electrodes for improved neural recording [40]. In the first weeks of stimulation, the magnitude of this reversible drop, like the chronic impedance decay, was modulated by ICMS amplitude and duration. The magnitude of the drop became more consistent over time, so that, while the magnitude of the drop was dependent on charge amplitude at the onse of chronic ICMS, it was less so at the end. For example stimulation at 20 nC/phase produced the largest reversible drop in the first week and the smallest drop in the last week. One possibility is that electrode impedance cannot drop below a certain minimum level; since electrodes subjected to high stimulation regimes approach this lower limit faster, they are more rapidly restricted as to how much further their impedance can drop in a given stimulation session.
The acute impedance drop may reflect a reversible electrochemical process at the interface of the electrode [27, 32]. Glial cells may have also accumulated at these sites in a natural response to implantation and stimulation, an accumulation which may be temporarily reversed during ICMS by removing or dispersing these cells, a process that may have reversed itself upon removal of stimulation [32, 33, 36, 38, 40, 41]. Current pulsing may also lead to temporary changes in the measured impedance by improving the efficiency of oxidation/reduction reactions in the iridium oxide, a phenomenon that is only observed in vivo [37]. Furthermore, impedance drops appeared to become more consistent over time, which might be interpreted as evidence that, while the electrochemical processes may not be completely reversible, they eventually stabilize (cf [33]).
Interestingly, control electrodes also exhibited a significant acute drop during each experimental session, despite receiving no chronic ICMS, suggesting that stimulation delivered through neighboring electrodes may have induced a global effect on the tissue or the array. This drop in the control electrodes significantly increased for the latter half of the study, during which voltage excursions were measured using a brief periodic bursts of ICMS (up to 20 nC/phase) on all electrodes including the controls, suggesting that these test pulses may have contributed to the observed drops in impedance. However, given that the drops were observed even at the beginning of the stimulation study, the voltage excursion tests were not the sole contributors to the reversible drop in impedance observed on control electrodes.
Reversible drop in voltage excursion
While the effects of chronic ICMS on voltage excursions broadly mirrored those on impedance, changes in voltage excursion tended to be smaller than changes in impedance, with the exception of stimulation at 20 nC/phase. The temporary decrease in voltage excursion for the 20 nC/phase stimulation condition was unexpectedly larger in comparison to other conditions given the trend seen in the impedances (see figures 5 and 8). Again, this decoupling between impedance and voltage excursion highlights that these two measures of the electrode–tissue interface are not interchangeable (figure 9(B)).
Mechanisms underlying the effect of chronic ICMS on the electrode–tissue interface
Excluding effects of the instrumentation, which are unlikely given that five different stimulators were used in this study, there are (at least) four mechanisms that would lead to a decrease in impedance: (1) an electrical ‘loosening’ of the glial and/or other tissue encapsulation (cf [27, 28, 30, 34, 38]); (2) the formation of iridium oxide or other electrochemical effects at the metal interface (cf [27, 38]); (3) failure of the insulation of the electrode (cf [42]); (4) failure of the electrode substrate or other aspect of the device (i.e., wire bonds or connector) (cf [35]).
Changes in electrode impedance and voltage excursion occurred on two time scales. Over the span of weeks or months, both impedance and voltage excursion decreased and eventually leveled off. The asymptotic levels of these two quantities were relatively unaffected by ICMS, with the exception of the most intense stimulation condition, which yielded significantly lower impedances and voltage excursions than did the control condition at the end of the study. A possible mechanism for impedance changes on SIROF electrodes pulsed at higher intensities is the dissolution of the coating itself, resulting from exceeding the water window; such a mechanism would lead to an increase in observed electrode impedance [20]. Given that the measured impedance of the 20 nC/phase electrodes (and all other stimulus intensities as well) decreased on both the short and long time scales rather than increased, coating dissolution is unlikely to have occurred, but we lack the data to directly test this possibility. In fact, Wang et al, who showed a similar impedance decay during a three month period of chronic stimulation in vivo, were able to confirm that the parylene coating of their Pt/Ir electrodes was not compromised [34]. Electrodes also exhibited an acute and reversible drop in impedance and voltage excursion, the magnitude of which became more consistent over time for both impedance and voltage excursions. While it is not clear which of the four mechanisms listed above account for these changes in the electrode–tissue interface, it seems as though the long-term and short-term effects on impedance are related. Indeed, the magnitude of the acute drop in impedance was modulated by that of the chronic drop. In other words, as the impedance decreased over time, the magnitude of the acute drop decreased. One possibility is that common mechanisms are at play, and that there is a floor below which electrode impedance will not drop, reflecting the bulk conductivity of the tissue [43, 44]. Examination of the explanted arrays and of the stimulated tissue will perhaps help identify the causes of the observed effects of ICMS on impedance and voltage excursions.
That chronic ICMS had a weaker effect on voltage excursion than it did on impedance may be interpreted as evidence that the measured effects on impedance may overestimate the impact on charge injection capacity. Indeed, voltage excursions reflect impedance across a range of frequencies—that of square wave pulses typically used in ICMS studies—while impedance was only measured at a single frequency. In conclusion, ICMS at all but the highest amplitude had a negligible effect on the electrode–tissue interface, as assessed by impedance and voltage excursion measurements.
Acknowledgment
This work was supported by DARPA contract no. #N66001-10-C-4056.
References
- [1].Sainburg RL et al. 1995. Control of limb dynamics in normal subjects and patients without proprioception J. Neurophysiol. 73 820–35 [DOI] [PMC free article] [PubMed] [Google Scholar]
- [2].Johannes MS et al. 2011. An overview of the developmental process for the modular prosthetic limb Johns Hopkins Univ. Appl. Phys. Lab. Tech. Dig. 30 207–16 [Google Scholar]
- [3].Schwartz AB et al. 2006. Brain-controlled interfaces: movement restoration with neural prosthetics Neuron 52 205–20 [DOI] [PubMed] [Google Scholar]
- [4].Santhanam G et al. 2006. A high-performance brain-computer interface Nature 442 195–8 [DOI] [PubMed] [Google Scholar]
- [5].Suminski AJ et al. 2010. Incorporating feedback from multiple sensory modalities enhances brain-machine interface control J. Neurosci. 30 16777–87 [DOI] [PMC free article] [PubMed] [Google Scholar]
- [6].O’Doherty JE et al. 2011. Active tactile exploration using a brain-machine-brain interface Nature 479 228–31 [DOI] [PMC free article] [PubMed] [Google Scholar]
- [7].Collinger JL et al. 2013. High-performance neuroprosthetic control by an individual with tetraplegia Lancet 381 557–64 [DOI] [PMC free article] [PubMed] [Google Scholar]
- [8].Cipriani C, D’Alonzo M and Carrozza MC 2012. A miniature vibrotactile sensory substitution device for multifingered hand prosthetics IEEE Trans. Biomed. Eng. 59 400–8 [DOI] [PubMed] [Google Scholar]
- [9].Lundborg G and Rosen B 2001. Sensory substitution in prosthetics Hand Clin. 17 481–8 [PubMed] [Google Scholar]
- [10].Berg JA et al. 2013. Behavioral demonstration of a somatosensory neuroprosthesis IEEE Trans. Neural Syst. Rehabil. Eng. 21 500–7 [DOI] [PubMed] [Google Scholar]
- [11].O’Doherty JE et al. 2012. Virtual active touch using randomly patterned intracortical microstimulation IEEE Trans. Neural Syst. Rehabil. Eng. 20 85–93 [DOI] [PMC free article] [PubMed] [Google Scholar]
- [12].O’Doherty JE et al. 2011. Active tactile exploration using a brain–machine–brain interface Nature 479 228–31 [DOI] [PMC free article] [PubMed] [Google Scholar]
- [13].Tabot GA et al. 2013. Restoring the sense of touch with a prosthetic hand through a brain interface Proc. Natl Acad. Sci. USA 110 18279–84 [DOI] [PMC free article] [PubMed] [Google Scholar]
- [14].London BM et al. 2008. Electrical stimulation of the proprioceptive cortex (area 3 a) used to instruct a behaving monkey IEEE Trans. Neural Syst. Rehabil. Eng. 16 32–36 [DOI] [PMC free article] [PubMed] [Google Scholar]
- [15].Brummer SB, Robblee LS and Hambrecht FT 1983. Criteria for selecting electrodes for electrical stimulation: theoretical and practical considerations Ann. New York Acad. Sci. 405 159–71 [DOI] [PubMed] [Google Scholar]
- [16].Beebe X and Rose TL 1988. Charge injection limits of activated iridium oxide electrodes with 0.2 ms pulses in bicarbonate buffered saline IEEE Trans. Biomed. Eng. 35 494–5 [DOI] [PubMed] [Google Scholar]
- [17].Cogan SF, Plante TD and Ehrlich J 2004. Sputtered iridium oxide films (SIROFs) for low-impedance neural stimulation and recording electrodes Conf. Proc. IEEE Eng. Med. Biol. Soc. 6 4153–6 [DOI] [PMC free article] [PubMed] [Google Scholar]
- [18].Cogan SF 2008. Neural stimulation and recording electrodes Annu. Rev. Biomed. Eng. 10 275–309 [DOI] [PubMed] [Google Scholar]
- [19].Negi S et al. 2010. In vitro comparison of sputtered iridium oxide and platinum-coated neural implantable microelectrode arrays Biomed. Mater. 5 15007. [DOI] [PubMed] [Google Scholar]
- [20].Negi S et al. 2010. Neural electrode degradation from continuous electrical stimulation: comparison of sputtered and activated iridium oxide J. Neurosci. Methods 186 8–17 [DOI] [PMC free article] [PubMed] [Google Scholar]
- [21].Davis TS et al. 2012. Spatial and temporal characteristics of V1 microstimulation during chronic implantation of a microelectrode array in a behaving macaque J. Neural Eng. 9 065003. [DOI] [PMC free article] [PubMed] [Google Scholar]
- [22].Koivuniemi AS and Otto KJ 2011. Asymmetric versus symmetric pulses for cortical microstimulation IEEE Trans. Neural Syst. Rehabil. Eng. 19 468–76 [DOI] [PMC free article] [PubMed] [Google Scholar]
- [23].McCreery D, Pikov V and Troyk PR 2010. Neuronal loss due to prolonged controlled-current stimulation with chronically implanted microelectrodes in the cat cerebral cortex J. Neural Eng. 7 036005. [DOI] [PMC free article] [PubMed] [Google Scholar]
- [24].Zaaimi B et al. 2013. Multi-electrode stimulation in somatosensory cortex increases probability of detection J. Neural Eng. 10 056013. [DOI] [PMC free article] [PubMed] [Google Scholar]
- [25].McCreery DB et al. 1990. Charge density and charge per phase as cofactors in neural injury induced by electrical stimulation IEEE Trans. Biomed. Eng. 37 996–1001 [DOI] [PubMed] [Google Scholar]
- [26].Xerri C et al. 1998. Plasticity of primary somatosensory cortex paralleling sensorimotor skill recovery from stroke in adult monkeys J. Neurophysiol. 79 2119–48 [DOI] [PubMed] [Google Scholar]
- [27].Parker RA et al. 2011. The functional consequences of chronic, physiologically effective intracortical microstimulation Prog. Brain Res. 194 145–65 [DOI] [PMC free article] [PubMed] [Google Scholar]
- [28].Koivuniemi A et al. 2011. Multimodal, longitudinal assessment of intracortical microstimulation Prog. Brain Res. 194 131–44 [DOI] [PMC free article] [PubMed] [Google Scholar]
- [29].Vetter RJ et al. 2004. Chronic neural recording using silicon-substrate microelectrode arrays implanted in cerebral cortex IEEE Trans. Biomed. Eng. 51 896–904 [DOI] [PubMed] [Google Scholar]
- [30].Rousche PJ and Normann RA 1999. Chronic intracortical microstimulation (ICMS) of cat sensory cortex using the Utah intracortical electrode array IEEE Trans. Rehabil. Eng. 7 56–68 [DOI] [PubMed] [Google Scholar]
- [31].Williams JC et al. 2007. Complex impedance spectroscopy for monitoring tissue responses to inserted neural implants J. Neural Eng. 4 410–23 [DOI] [PubMed] [Google Scholar]
- [32].Tykocinski M, Cohen LT and Cowan RS 2005. Measurement and analysis of access resistance and polarization impedance in cochlear implant recipients Otol. Neurotol. 26 948–56 [DOI] [PubMed] [Google Scholar]
- [33].Paasche G et al. 2009. The long-term effects of modified electrode surfaces and intracochlear corticosteroids on postoperative impedances in cochlear implant patients Otol. Neurotol. 30 592–8 [DOI] [PubMed] [Google Scholar]
- [34].Wang C et al. 2013. Characteristics of electrode impedance and stimulation efficacy of a chronic cortical implant using novel annulus electrodes in rat motor cortex J. Neural Eng. 10 046010. [DOI] [PubMed] [Google Scholar]
- [35].Kane SR et al. 2011. Electrical performance of penetrating microelectrodes chronically implanted in cat cortex EMBC’11: Proc. Annu. Int. Conf. of the IEEE Engineering in Medicine and Biology Society vol 60, pp 2153.– [DOI] [PMC free article] [PubMed] [Google Scholar]
- [36].Otto KJ, Johnson MD and Kipke DR 2006. Voltage pulses change neural interface properties and improve unit recordings with chronically implanted microelectrodes IEEE Trans. Biomed. Eng. 53 333–40 [DOI] [PubMed] [Google Scholar]
- [37].Weiland JD and Anderson DJ 2000. Chronic neural stimulation with thin-film, iridium oxide electrodes IEEE Trans. Biomed. Eng. 47 911–8 [DOI] [PubMed] [Google Scholar]
- [38].Newbold C et al. 2011. Electrical stimulation causes rapid changes in electrode impedance of cell-covered electrodes J. Neural Eng. 8 036029. [DOI] [PMC free article] [PubMed] [Google Scholar]
- [39].Charlet de Sauvage R et al. 1997. Electrical and physiological changes during short-term and chronic electrical stimulation of the normal cochlea Hear. Res. 110 119–34 [DOI] [PubMed] [Google Scholar]
- [40].Johnson MD, Otto KJ and Kipke DR 2005. Repeated voltage biasing improves unit recordings by reducing resistive tissue impedances IEEE Trans. Neural Syst. Rehabil. Eng. 13 160–5 [DOI] [PubMed] [Google Scholar]
- [41].Sommakia S, Rickus JL and Otto KJ 2009. Effects of adsorbed proteins, an antifouling agent and long-duration DC voltage pulses on the impedance of silicon-based neural microelectrodes EMBC’11: Proc. Annu. Int. Conf. of the IEEE Engineering in Medicine and Biology Society pp 7139–42 [DOI] [PubMed] [Google Scholar]
- [42].Liu X et al. 1999. Stability of the interface between neural tissue and chronically implanted intracortical microelectrodes IEEE Trans. Rehabil. Eng. 7 315–26 [DOI] [PubMed] [Google Scholar]
- [43].Grill WM and Mortimer JT 1994. Electrical properties of implant encapsulation tissue Ann. Biomed. Eng. 22 23–33 [DOI] [PubMed] [Google Scholar]
- [44].Logothetis NK, Kayser C and Oeltermann A 2007. In vivo measurement of cortical impedance spectrum in monkeys: implications for signal propagation Neuron 55 809–23 [DOI] [PubMed] [Google Scholar]


