

Abstract
Although there is increased interest in utilizing machine learning (ML) to support drug development, technical hurdles associated with complex algorithms have limited widespread adoption. In response, we have developed Pharm‐AutoML, an open‐source Python package that enables users to automate the construction of ML models and predict clinical outcomes, especially in the context of pharmacological interventions. In particular, our approach streamlines tedious steps within the ML workflow, including data preprocessing, model tuning, model selection, results analysis, and model interpretation. Moreover, our open‐source package helps to identify the most predictive ML pipeline among defined search spaces by selecting the best data preprocessing strategy and tuning the ML model hyperparameters. The package currently supports multiclass classification tasks, and additional functions are being developed. Using a set of five publicly available biomedical datasets, we show that our Pharm‐AutoML outperforms other ML frameworks, including H2O with default settings, by demonstrating improved predictive accuracy of classification. We further illustrate how model interpretation methods can be utilized to help explain the fine‐tuned ML pipeline to end users. Pharm‐AutoML provides both novice and expert users improved clinical predictions and scientific insights.
Study Highlights.
WHAT IS THE CURRENT KNOWLEDGE ON THE TOPIC?
Machine learning (ML) is a powerful methodology for analyzing complex healthcare data and automatic ML (AutoML) offers a way to automate tedious steps in ML pipeline. However, the current AutoML frameworks are not fulfilling the needs of biopharmaceutical or healthcare researchers due to the lack of end‐to‐end automation of ML pipelines, including data preprocessing and model interpretation.
WHAT QUESTION DID THIS STUDY ADDRESS?
Pharm‐AutoML is designed to provide an end‐to‐end AutoML solution, which enables biopharmaceutical researchers to automate the construction of ML models, predict clinical outcomes, and interpret ML models.
WHAT DOES THIS STUDY ADD TO OUR KNOWLEDGE?
Pharm‐AutoML automates ML pipeline from data preprocessing, model tuning, model selection, results analysis, and model interpretation. We show that such an end‐to‐end workflow can outperform current implementations of ML and AutoML.
HOW MIGHT THIS CHANGE DRUG DISCOVERY, DEVELOPMENT, AND/OR THERAPEUTICS?
Pharm‐AutoML will help to accelerate the ML model development, deployment, and interpretation, thereby facilitating the application of ML for predicting outcomes and extracting insights in the context of clinical trials and drug research.
INTRODUCTION
With the growing amount of health data collected from numerous sources, such as electronic health records (EHRs), genomic sequencing, and biomedical research, big data in healthcare has become a popular research topic. 1 Because of the data‐driven nature of machine learning (ML), 2 the large amount of data in health care offers the potential to successfully leverage ML techniques. Recently, it has been proposed that the analysis of complex big healthcare data by ML offers considerable advantages over traditional biostatistical methods for tasks such as risk stratification and survival predictions. 3 , 4 Researchers in biopharmaceutical development and healthcare fields are familiar with data that arise in their domain and standard analysis workflows. Nonetheless, they often lack the expertise necessary to apply advanced ML techniques. 5 In particular, the interactive process between researchers in the healthcare domain and expert data scientists requires expenditure of a copious amount of communication, time, and effort that may impede ML solution deployment and explanation. 5 Motivated by the need to lower the technical barrier to application of ML, automated ML (AutoML) has become an active research area. 6
In the context of both drug development and regulation, many potential applications of ML exist ranging from categories such as supervised and unsupervised learning to reinforcement learning. 7 In this study, we focus on supervised classification tasks in the context of clinical pharmacology analysis for clinical outcome predictions. 8 Examples of these tasks and their uses include: exposure‐response analyses for the justification of dose selection, identification of key biomarkers predictive of patient response for use in personalized health care, and prediction of patients who may experience drug‐induced adverse events (AEs) to support clinical trial design. In addressing these topics, the input data, or features, used in the analysis may involve baseline covariates, such as demographics and laboratory measurements or other biomarkers, as well as metrics of pharmacokinetics exposure (e.g., the maximum drug concentration [Cmax] or the area under the curve [AUC]), with the targets being categorical variables, such as clinical response (e.g., complete response or progressive disease) or AEs of various grades (e.g., diarrhea, hyperglycemia, etc.).
Many different Python‐based AutoML solutions 6 have been proposed in recent years. H2O AutoML 9 , 10 is an open‐source ML workflow that supports the most widely used ML models and advanced models, such as deep learning and ensemble. To ensure high performance and easy deployment, H2O utilizes Java to develop core algorithms and provides application programming interfaces (APIs) for Python and R users. In the ML field, hyperparameters 6 refer to the set of tunable parameters that characterize the model via higher level concepts, such as model complexity, or capacity of regularization. Therefore, the hyperparameter optimization step can help identify the most suitable model(s) among the searching space that best fit the validation data. Compared with other popular AutoML packages, H2O has fewer hyperparameters to tune and applies random grid search optimization techniques. Thus, this method may result in overfitting and an unsatisfactory generalization performance. 11 As a drop‐in replacement for the popular ML package scikit‐learn, 12 auto‐sklearn 13 is a package that allows users to quickly adopt scikit‐learn style functions to build models from their data. Auto‐sklearn also has many data preprocessing options and leverages Bayesian optimization 14 to narrow down the search space of optimal hyperparameter combinations. However, with auto‐sklearn, it is not easy to extract optimization results and this package is reported to have unexpectedly low prediction accuracy. 15 Hyperopt‐sklearn 16 is another AutoML framework and uses hyperopt, 17 a Python library for optimization over search spaces, to encompass many scikit‐learn ML models. Hyperopt‐sklearn allows users to define search space and display optimized hyperparameters explicitly. However, this framework does not have many data preprocessing methods and lacks feature interpretation implementation. Thus, a further development of hyperopt‐sklearn is needed.
Despite growing interest in the field of AutoML, there has been little work done to apply these techniques to fulfill the needs of biopharmaceutical or healthcare researchers. 5 For example, ML data preprocessing and data splitting can be complex and time‐consuming. For researchers with little ML expertise, implementation mistakes may occur along different stages of the workflow, resulting in detrimental errors, such as data leakage, which occurs when the information from the validation or test data inadvertently enters the model training process. However, the existing AutoML frameworks (as mentioned in the previous paragraph) generally do not help streamline the end‐to‐end process. In addition, for pharmaceutical or healthcare applications, model interpretation is particularly important. Again, the existing AutoML frameworks do not include the most widely used and state‐of‐art model interpretation approaches, such as tree‐based feature importance analysis 18 and SHapley Additive exPlanations (SHAP) analysis. 19 , 20 Thus, even after the ML models have been built, researchers using them may need to carry out additional analyses to reveal how the predictions are made. In this work, we present an end‐to‐end AutoML solution, Pharm‐AutoML, aimed at researchers involved in biopharmaceutical development and healthcare, which ensures simplicity and transparency of the entire ML pipeline (see Figure 1).
FIGURE 1.
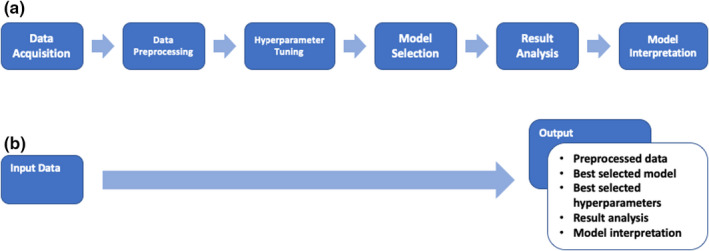
Model schematic. (a) The traditional ML pipeline. (b) The Pharm‐AutoML pipeline, an end‐to‐end AutoML. ML, machine learning
METHODS
Overview of pharm‐AutoML
Pharm‐AutoML is an open‐source Python package aimed at end‐to‐end automation of complex and computationally expensive ML pipelines, including data preprocessing, model selection, hyperparameter tuning, and model interpretation. One Python code example is available in Text S1. Pharm‐AutoML is easy to deploy on both local computers as well as remote cluster systems (in Mac and Unix OS). As shown in the Pharm‐AutoML flowchart (Figure 2), we implemented two pipeline branches for Pharm‐AutoML: branch A “impute missings” and branch B “allow missings.” This arrangement was made because although some ML models are able to handle missing values in the algorithm, thereby not requiring the user to impute data, other algorithms require no missing data. For example, XGboost can handle missing values internally by putting all input samples for which the value of the feature being split is missing into a child leaf.
FIGURE 2.
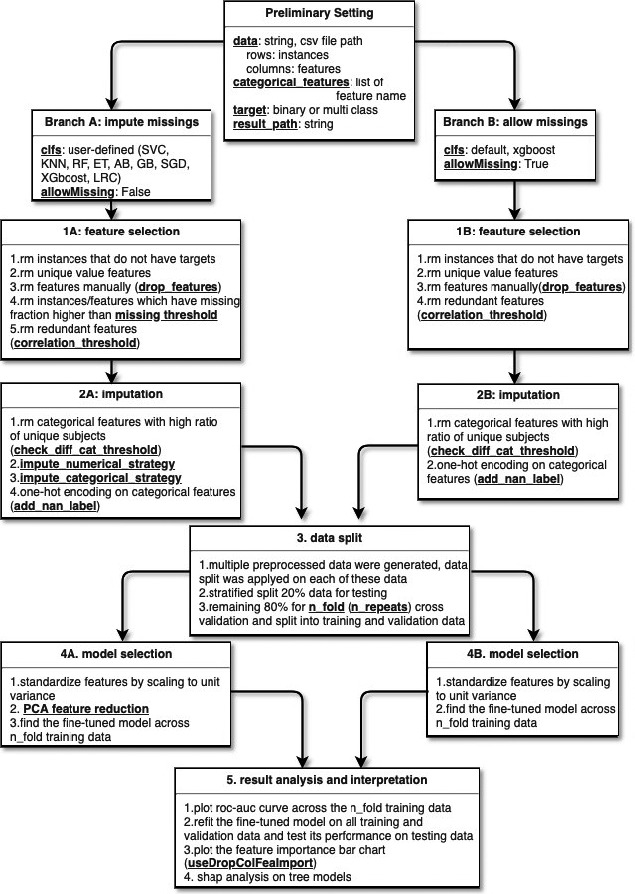
Pharm‐AutoML flowchart. “rm” denotes “remove”. The bold underlined text refers to the user‐defined parameters in each module. PCA, principal component analysis
Our Pharm‐AutoML implementation currently only handles multiclass classification tasks (under the category of supervised learning), although other capabilities are in development (see Discussion). As a demonstration of the utility and predictive performance of our implementation, we have selected five biomedical outcome prediction datasets (of multiclass classification) from the University of California, Irvine (UCI) ML repository and tested our package with default parameters. These five datasets used in this study were: (1) heart failure clinical record dataset, (2) breast cancer dataset, (3 hepatitis dataset, (4) chronic kidney disease dataset, and (5) risk factors for cervical cancer dataset (Table S1). 21 We standardized these dataset examples into the format that satisfies our Pharm‐AutoML input requirements (Code S1 AutoML_package, sub‐folder src_autoML/examples/data) and made them available on the Pharm‐AutoML github page. We compared the prediction performance of the AutoML model with many popular models, including XGboost, Logistic regression, and H2O, using default settings.
Package prerequisites
Pharm‐AutoML was developed in Python version 3.7 and supports both Mac and Unix operating systems. Currently, this package has not been fully tested for other Python versions. The prerequisite Python packages are available on the project Github page and modelers are able to execute an Anaconda command to set up the proper environment (Text S2). For each module in the Pharm‐AutoML pipeline, we selected different pre‐existing state‐of‐the‐art packages to support the corresponding functionalities. For example, in the feature selection module and imputation modules (modules 1 and 2), Python packages numpy and pandas were used to convert data into structured arrays to be fully compatible with the subsequent module in the Pharm‐AutoML pipeline. In the model selection modules (4A and 4B), we modified hyperopt‐sklearn, a widely used Python package for Pharm‐AutoML, to find the optimal set of hyperparameters for all scikit‐learn classifiers. The matplotlib package was used to visualize prediction results and model interpretation (module 5).
Input data and settings
Pharm‐AutoML requires input data to be in comma‐separated values (CSVs) format, which includes both the input features and prediction targets as columns, and the instances are given as rows. The target column consists of binary or multiclass labels (with or without missing values). By default, all the columns, except the prediction target, are treated as input data features, although the user has the ability to explicitly remove specific features. Pharm‐AutoML also supports categorical string data and qualitative data (with or without missing value) in the feature columns. It is noteworthy that if the modelers wish to treat a feature with numerical value as categorical data, Pharm‐AutoML requires the modelers to specify the corresponding feature names in the categorical_features parameter. The user also needs to specify the directory (result_path) as a required parameter to save all the preprocessed data, refitted models, and results plots.
Preprocessing: feature selection and imputation (modules 1 and 2)
There are two modules in the data preprocessing step, feature selection (module 1) and imputation (module 2). We applied two different data preprocessing strategies for the respective branches. In the missing imputation branch, feature selection module (1A) first removes instances that lack prediction targets. In the same module, the algorithm checks if the data have features that take on identical values and removes those features. In addition, the user may manually ignore specific features via the drop_features setting. This allows the instances and features that have a missing fraction higher than the missing_threshold to be dropped. Further, pairs of features found to be redundant when the Pearson correlation coefficient is greater than the setting threshold (correlation_threshold) are identified and the second feature of each pair is removed. Next, the data processed by the feature selection module 1A is passed to the imputation module 2A. The imputation module first removes categorical features with a high ratio to the number of unique subjects (check_diff_cat_threshold), for instance, patient names, then imputes the data based on whether the feature is numerical or categorical (impute_numerical_threshold or impute_categorical_strategy). By default setting (which the user has the ability to change), categorical features are imputed by the most frequent value and numerical features are imputed by the mean value. Finally, categorical features are one‐hot encoded. The Boolean parameter add_nan_label determines if Pharm‐AutoML adds new features to label all missing values. On the other hand, in the Pharm‐AutoML branch B allow missing, none of the imputation strategy is used for features‐selected data. The users are allowed to pass multiple sets of preprocessing parameters to Pharm‐AutoML, thus generating multiple preprocessed data. Pharm‐AutoML saves all of these preprocessed data into result_path as well as passing it to the data split module (module 3).
Data splitting (module 3)
Following the data preprocessing module, Pharm‐AutoML splits the preprocessed data into training data (80% of all data) and test data (20% of all data) in a stratified manner, which preserves the same proportions of target variables in training and test sets. These preprocessed data are then saved into the results folder. To preserve the independence of the test data, it is not used until testing the fine‐tuned model in module 5. In order to select the best ML model on training data, the model selection module further splits the total training data in a stratified manner into fold‐specific training data and validation data with n_folds cross‐validation (done only once, see Figure 3). The parameter n_repeats controls the number of repeated stratified splits with different randomization. Therefore, in n_repeats cross‐validation, the n_folds cross‐validation procedure will be repeated n_repeats times randomly. All splits of the training data enable the model selection module (modules 4A and 4B) to not only reduce the model overfitting, but also to identify the most stable model among all classifiers.
FIGURE 3.
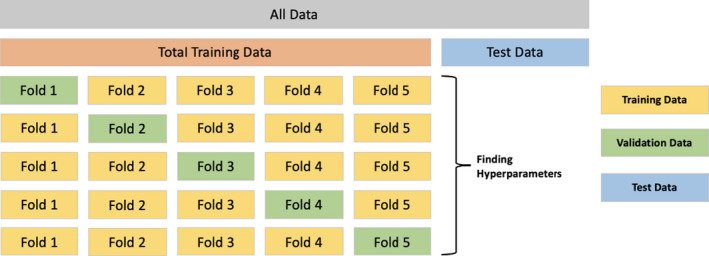
Visual representation of AutoML data split and cross validation strategy. ML, machine learning
Model selection (module 4)
After the splitting of data into the training and test sets, Pharm‐AutoML standardizes features in the training data by scaling to zero mean and unit variance and then transforms the validation data by the standardized scaler computed from the training data. For data consisting of high dimensional features, such as genomics data, the users have the ability to apply principal component analysis (PCA) to find the optimal number of transformed components. 12 The Pharm‐AutoML uses all available classifiers within scikit‐learn, including logistic regression classifier (LRC), random forest (RF), extra trees (ETs), adaboost classifier (AB), support vector machine classifier (SVC), k‐nearest neighbors (KNNs), gradient boosting (GB) classifier, stochastic gradient descent classifier (SGD), and xgboost classifier (XGboost). 12 We use the Bayesian optimization implemented by Python package hyperopt to search for the best set of hyperparameters to optimize the accuracy‐based loss function in each classifier. To evaluate different ML approaches, the prediction performance of each model with optimal hyperparameters are evaluated across sets of validation data. In order to customize Pharm‐AutoML for better performance on datasets of biomedical relevance, we utilized five representative data examples to help set appropriate hyperparameter search space. For example, in XGboost classifier, the hyperparameter min_child_weight refers to the minimum number of samples that a tree node can represent. The tree node will not split if there are fewer than min_child_weight samples at that node. However, in healthcare applications, there are usually a relatively small number of samples. When the hyperparameter min_child_weight is too big, a large portion of samples may fall into a few particular leaves and thus, the XGboost classifier fails to perform well on validation data. Therefore, in Pharm‐AutoML we set the upper bound of min_child_weight as 10 (code available in src_autoML/hpsklearn/components.py).
Results analysis and model interpretation (module 5)
In the results analysis module of Pharm‐AutoML, we refit our fine‐tuned models on all training data (all n‐folds data) and then evaluate the prediction performance on test data. This module implements various model performance metrics to reveal the performance of the selected model. These metrics include accuracy (ACC), F‐1 score, sensitivity (SEN), specificity (SPE), area under receiver operating characteristic curve (AUROC), and area under precision recall curve (AUPRC). Plots showing n‐fold results of the receiver operating characteristic (ROC) and precision recall curve are also generated and saved in the result_path.
Feature importance refers to how useful the features are in contributing toward predicting the target variable and may be quantified using different methods. Our package offers two ways to assess the best‐performing model: (1) the scikit‐learn based model‐dependent feature importance method; (2) model agnostic interpretation methods (drop‐column feature importance method 22 and SHAP analysis. 19 , 20 First, our package adopts the feature importance functionality of scikit‐learn. For example, in the logistic regression model, the coefficients are calculated as feature importance scores whereas in the random forest classifier, the Gini index across all trees is used for the feature importance scores. 18 All ML model candidates (LRC, RF, ETs, AB classifier, SVC, GB classifier, and XGboost classifier) are available for feature importance. We also implemented a way to quantify the feature importance by comparing model predictions with all features present versus an alternative model with the feature dropped for refitting. 22 This functionality can be set up with the parameter useDropColFeaImport. Finally, our package offers the ability to use SHAP analysis for explaining model predictions, which is a novel approach based on game theoretical concepts. 19 , 20 For classification tasks, the SHAP values for each patient represent the contribution to the model prediction (i.e., the logit of the probability value) from the individual features, thus explaining how the prediction outcome is computed from the features in an additive manner (see Result and Discussion sections). All tree‐based models (e.g.,XGboost, GB, and RG) can undergo SHAP analysis. Moreover, all of the model interpretation plots are saved in the results directory.
RESULTS
Pharm‐AutoML facilitates comparison of models and output generation
In the data preprocessing step, Pharm‐AutoML outputs details of each of the data preprocessing steps and saves them into a log file. We compared the average prediction performance of n‐fold cross‐validation data across all user‐defined ML models. Figure 4 shows the model performance, ranked by ROC AUC metric, when we tested all available ML models for prediction of biopsy examination outcomes from patient features within a cervical cancer dataset.
FIGURE 4.
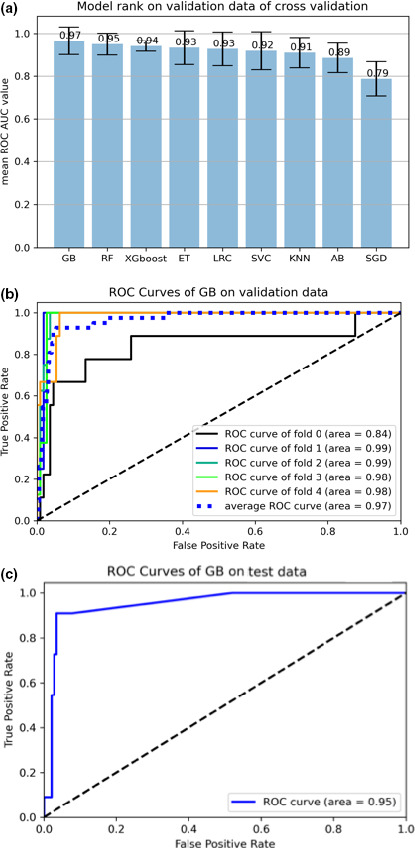
Models and ROC curves. (a) All available ML models ranked by average validation performance for predicting the biopsy examination outcome by risk factor features from a cervical cancer dataset. The error bars indicate the standard error of the ROC values over the fivefolds. (b) ROC curves of gradient boosting classifier on validation, and (c) test data for the cervical cancer dataset. AUC, area under the curve; GB, gradient boosting; ML, machine learning; ROC, receiver operating characteristic
Pharm‐AutoML also generates the ROC curve of the best model on n‐folds cross‐validation and test data. Figure 4 shows the ROC curves generated by fitting the selected GB classifier to risk factors in the cervical cancer dataset. We demonstrate that the model generated by Pharm‐AutoML is relatively stable across different folds of validation data and is able to prevent overfitting as shown by the evaluation of model performance using test data.
Pharm‐AutoML package demonstrates competitive performance
In order to compare the performance of our Pharm‐AutoML with alternative frameworks, we evaluated five different ML or AutoML implementations on each of the five biomedical datasets shown in Table S1. These models used for comparison consist of: two scikit‐learn models (logistic regression and XGboost classifiers, both with default settings), H2O framework with default settings, and our Pharm‐AutoML with or without imputation. After finding the optimal hyperparameters and ML model, we randomly stratified the dataset into training and test data 100 times and then refit the selected optimal models for comparison by training data and assessed the performance on test data. The area under the ROC curve (ROC‐AUC) was used to measure the performance across different models. As shown in Figure 5, the performance of the Pharm‐AutoML framework is either superior or equal to that of H2O frameworks with default settings for all five datasets tested. Further, among all tested datasets, the Pharm‐AutoML models significantly outperform other models for heart, breast, and cervical cancer datasets (more details in Table S2).
FIGURE 5.
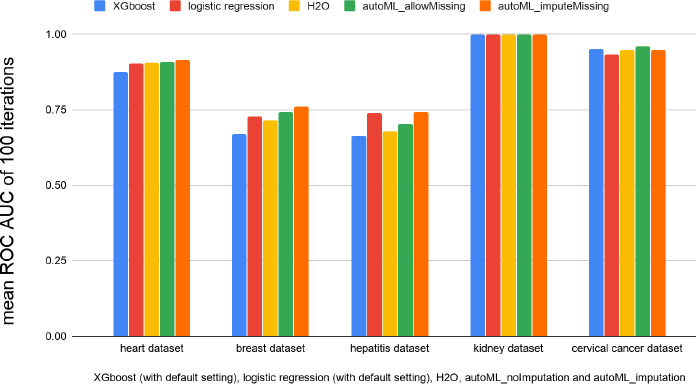
Prediction performance comparison between Pharm‐AutoML and other traditional ML models, for randomly sampled training and test sets performed 100 times. AUC, area under the curve; ML, machine learning; ROC, receiver operating characteristic
Pharm‐AutoML enables reproducible and interpretable results
In order to demonstrate the model explanation capability of our package, we provide the optimal model and feature importance plots generated from the cervical cancer dataset as an illustration. We found that the GB classifier with the selected hyperparameters (Text S3) performs the best among all models when predicting biopsy examination outcome for a cervical cancer dataset.
We then interpret the selected model using scikit‐learn feature importance plot. Figure 6 shows the feature rank from the GB classifier.
FIGURE 6.
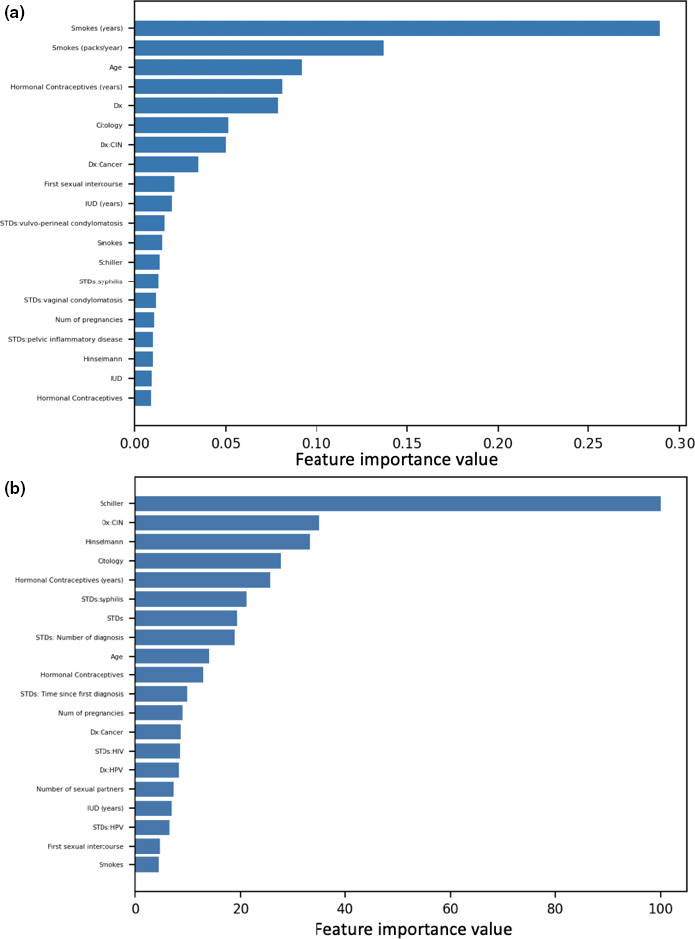
Scikit‐learn plots. (a) Scikit‐learn‐based feature importance rank for predicting biopsy outcome from risk factors for cervical cancer. (b) Logistic regression features importance rank on predicting biopsy outcome from risk factors in a cervical cancer dataset. CIN, chemotherapy‐induced neutropenia; Dx, diagnosis; HPV, human papillomavirus; IUD, intrauterine device; STD, sexually transmitted disease
As GB is a tree‐based ML model, we can also use SHAP analysis to interpret this optimal model with the selected hyperparameter. Figure 7 shows the SHAP summary plot of the features rank extracted from the GB model. The “Schiller,” “Hinselmann,” and “Citology” features have the strongest impact on the outcome of the model, and these features correlate positively with the outcome, as shown by the sign of their SHAP values. Furthermore, this interpretation result agrees with open‐source Kaggle notebooks. 23 , 24
FIGURE 7.
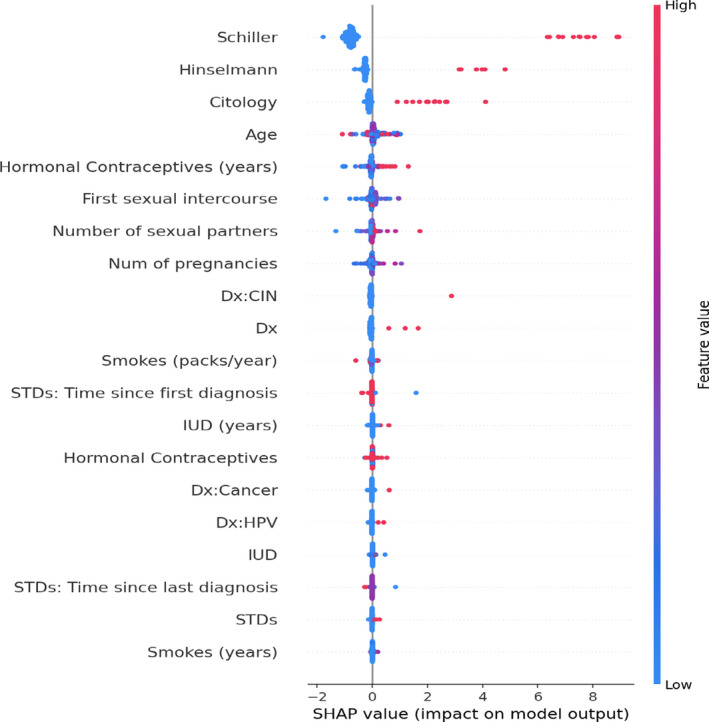
SHAP value rank of features predicting biopsy in a cervical cancer dataset. CIN, chemotherapy‐induced neutropenia; Dx, diagnosis; HPV, human papillomavirus; IUD, intrauterine device; SHAP, SHapley Additive exPlanations; STD, sexually transmitted disease
We find that the absolute SHAP values (summed across patients) obtained from the GB classifier are highly correlated to the absolute value of regression coefficients in the logistic regression model (Figure 6), with a Pearson correlation coefficient value of 0.9052 (p < 10−5). This result illustrates the consistency between the interpretation of SHAP values on nonlinear models (such as tree models) with the regression coefficients in the linear setting.
DISCUSSION
While there is growing interest in ML utilization for drug development, 7 , 8 , 25 the technical hurdles of applying complex ML algorithms hampers its broad adoption. Thus, there is a need for practical packages to accelerate ML applications in this domain. Our Pharm‐AutoML package is an end‐to‐end ML package aimed at both academic and industry researchers. Because it does not require complex coding, Pharm‐AutoML enables rapid data analysis and ML model interpretation. Thus, by automating technical steps our package facilitates the utilization of ML models for predicting outcomes in clinical trials and with healthcare data. As it is built upon popular open‐source libraries, such as scikit‐learn and hyperopt, Pharm‐AutoML is easy to maintain and utilizes standardized hyperparameters of ML models. Furthermore, Pharm‐AutoML is not only a user‐friendly package, but is also an open‐source platform that ML experts can build on for further development. By augmenting existing statistical approaches, Pharm‐AutoML has the potential to generate improved prediction models and reveal more insights from the fine‐tuned ML model. Therefore, we anticipate it being an essential tool for the “AI‐enabled 21st century clinical pharmacologist.” 26
Although there are several other AutoML frameworks, our package is differentiated from these efforts in a number of ways. This includes splitting of the AutoML pipeline into “impute missings” and “allow missings,” which conforms to data imputation requirements for different ML algorithms. The “allow missings” pipeline also prevents the introduction of potential noise into the dataset via imputations, which may impact model performance and computational time. As an error‐prone step in the AutoML pipeline, hyperparameter tuning is generally time‐consuming for most users of ML. We also demonstrate the good performance of Pharm‐AutoML by customizing hyperparameter search space utilizing five representative biomedical datasets.
There are many packages available for implementing the hyperparameter tuning step in the ML pipeline, such as hyperopt‐sklearn. However, few popular AutoML packages cover model interpretation, the most important step in biomedical and healthcare applications. To this end, we implemented three model interpreters to explain our fine‐tuned model from two different perspectives, a model‐dependent interpreter based on scikit‐learn feature importance and a model‐agnostic interpreter based on drop‐column feature importance or SHAP analysis. 19 , 20 , 22 , 27 The model‐dependent interpreters explain ML models by analyzing algorithm characteristics. For example, the coefficients in logistic regression models can reflect the feature importance of the corresponding feature. On the other hand, the model‐agnostic interpreters compute the contribution of each feature to the prediction regardless of the ML algorithm characteristics. Thus, the drop‐column feature importance and SHAP analysis‐based model‐agnostic interpreter measure the magnitude of feature attributions and allows AutoML to explore all types of ML models, including high performing algorithms, such as XGboost.
We have successfully built an end‐to‐end AutoML package for classification tasks, however, a few topics require further work. A task that is currently not supported is the building of ML models for regression analysis, where the outcomes to be predicted are continuous rather than categorical variables. 28 In addition, survival analysis is frequently encountered in the analysis of clinical data, where the aim is to predict the time until an event of interest occurs while accounting for data censoring. 29 Various ML algorithms have been developed for survival analysis, 30 each with its own set of underlying modeling assumptions. Given the importance of these tasks in the context of drug research and development, we aim to extend our Pharm‐AutoML package to include these capabilities in the near future and keep it updated on Pharm‐AutoML github page.
CONFLICT OF INTEREST
G.L., D.L., and J.L. are employees of Genentech and own stock in Roche.
AUTHOR CONTRIBUTIONS
G.L., D.L., and J.L wrote the manuscript. J.L. designed the research. G.L. performed the research. G.L., D.L., and J.L. analyzed the data.
Supporting information
Supplementary Material
Code S1
ACKNOWLEDGEMENTS
The authors would like to acknowledge Logan Brooks, Qi Liu, Rashed Harun, Azade Tabaie, Jin Y. Jin, and Amita Joshi for their feedbacks and support, as well as Mausumi Debnath and Harbeen Grewal of Anshin Biosolutions for providing editorial assistance.
REFERENCES
- 1. Dash S, Shakyawar S, Sharma M, Kaushik S. Big data in healthcare: management, analysis and future prospects. J Big Data. 2019;6:1‐25. [Google Scholar]
- 2. Beam AL, Kohane IS. Big data and machine learning in health care. JAMA. 2018;319:1317‐1318. [DOI] [PubMed] [Google Scholar]
- 3. Ngiam KY, Khor IW. Big data and machine learning algorithms for health‐care delivery. Lancet Oncol. 2019;20:e262‐e273. [DOI] [PubMed] [Google Scholar]
- 4. Rajkomar A, Dean J, Kohane I. Machine learning in medicine. N Engl J Med. 2019;380:1347‐1358. [DOI] [PubMed] [Google Scholar]
- 5. Waring J, Lindvall C, Umeton R. Automated machine learning: review of the state‐of‐the‐art and opportunities for healthcare. Artif Intell Med. 2020;104:101822. [DOI] [PubMed] [Google Scholar]
- 6. Hutter F, Kotthoff L, Vanschoren J. Automated Machine Learning: Methods, Systems, Challenges. Basingstoke: Springer Nature; 2019. [Google Scholar]
- 7. Liu Q, et al. Application of machine learning in drug development and regulation: current status and future potential. Clin Pharmacol Ther. 2020;107:726‐729. [DOI] [PubMed] [Google Scholar]
- 8. Koch G, Pfister M, Daunhawer I, Wilbaux M, Wellmann S, Vogt JE. Pharmacometrics and machine learning partner to advance clinical data analysis. Clin Pharmacol Ther. 2020;107:926‐933. [DOI] [PMC free article] [PubMed] [Google Scholar]
- 9. H20.ai. H20, H20 version 3.10.0.8. 2016. https://github.com/h2oai/h2o‐3. Accessed October 18, 2020.
- 10. H20.ai. H20 AutoML. 2017. http://docs.h2o.ai/h2o/latest‐stable/h2o‐docs/automl.html. Accessed October 18, 2020.
- 11. Raschka S. Python Machine Learning. Birmingham, UK: Packt Publishing; 2015. [Google Scholar]
- 12. Pedregosa F, Varoquaux G, Gramfort A, et al. Scikit‐learn: machine learning in Python. J Machine Learn Res. 2011;12:2825‐2830. [Google Scholar]
- 13. Feurer M, Klein A, Eggensperger K, Springenberg J, Blum M. Efficient and robust automated machine learning. In: Cortes C, Lee DD, Garnett R, Lawrence N, Sugiyama M, eds. Advances in Neural Information Processing Systems. Red Hook, NY: Curran Associates, Inc; 2015:2962–2970. [Google Scholar]
- 14. Snoek J, Larochelle H, Adams R. Practical Bayesian optimization of machine learning algorithms. In: Pereira F, Burges CJC, Bottou L, Weinberger KQ, eds. Advances in Neural Information Processing Systems 25. Red Hook, NY: Curran Associates, Inc.; 2012:2951‐2959. [Google Scholar]
- 15. Pacull F. First try of auto‐sklearn . 2019. https://www.architecture‐performance.fr/ap_blog/first‐try‐of‐auto‐sklearn/. Accessed October 18, 2020.
- 16. Komer B, Bergstra J, Eliasmith C. Hyperopt‐sklearn: automatic hyperparameter configuration for scikit‐learn. ICML Workshop on AutoML 2014;9:50. [Google Scholar]
- 17. Bergstra J, Yamins D, Cox D. Making a science of model search: hyperparameter optimization in hundreds of dimensions for vision architectures. In: Dasgupta S, McAllester D, eds. The Proc. of the 30th International Conference on Machine Learning. Atlanta, GA: PLMR; 2013:115–123. [Google Scholar]
- 18. Breiman L. Random forest. Mach Learn. 2001;45:5‐32. [Google Scholar]
- 19. Lundberg SM, Erion G, Chen H, et al. From local explanations to global understanding with explainable AI for trees. Nat Mach Intell. 2020;2:56‐67. [DOI] [PMC free article] [PubMed] [Google Scholar]
- 20. Lundberg SM, Lee S‐I. A unified approach to interpreting model predictions. In: Guyon I, Luxburg UV, Bengio S, Wallach H, Fergus R, Vishwanathan S, et al. Neural Information Processing Systems. Red Hook, NY: Curran Associates, Inc.; 2017:4765‐4774. [Google Scholar]
- 21. Dua D, Graff C. UCI Machine Learning Repository . 2019. http://archive.ics.uci.edu/ml%5D. Accessed October 18, 2020.
- 22. Parr T, Wilson J, Hamrick J. Nonparametric feature impact and importance . 2020. https://arxiv.org/pdf/2006.04750.pdf.
- 23. Huang P‐H. For beginners: using Keras to build models. 2017. https://www.kaggle.com/randyrose2017/for‐beginners‐using‐keras‐to‐build‐models. Accessed October 18, 2020.
- 24. Ullah N. Ullah N. ML explainability: Deep dive into the ML model! 2018. https://www.kaggle.com/niyamatalmass/ml‐explainability‐deep‐dive‐into‐the‐ml‐model. Accessed October 18, 2020.
- 25. Bica I, Alaa AM, Lambert C. & van der Schaar, M. From real‐world patient data to individualized treatment effects using machine learning: Current and future methods to address underlying challenges. Clin Pharmacol Ther. 2021;109(1):87‐100. [DOI] [PubMed] [Google Scholar]
- 26. Corrigan BW. Artificial intelligence and machine learning: will clinical pharmacologists be needed in the next decade? The John Henry Question. Clin Pharmacol Ther. 2020;107:697‐699. [DOI] [PubMed] [Google Scholar]
- 27. Molnar C. Interpretable machine learning. A guide for making black box models explainable. 2020. https://christophm.github.io/interpretable‐ml‐book/.
- 28. James G, Witten D, Hastie T, Tibshirani R. An introduction to statistical learning: With applications in R. New York, NY: Springer; 2013. [Google Scholar]
- 29. Miller RG. Survival Analysis. 2nd ed. New York: Wiley; 2011. [Google Scholar]
- 30. Wang P, Li Y, Reddy CK. Machine learning for survival analysis: a survey. ACM Comput Surv. 2019;51:Article 110. [Google Scholar]
Associated Data
This section collects any data citations, data availability statements, or supplementary materials included in this article.
Supplementary Materials
Supplementary Material
Code S1