

Abstract
Information on individual lesion dynamics and organ location are often ignored in pharmacometric modeling analyses of tumor response. Typically, the sum of their longest diameters is utilized. Herein, a tumor growth inhibition model was developed for describing the individual lesion time‐course data from 183 patients with metastatic HER2‐negative breast cancer receiving docetaxel. The interindividual variability (IIV), interlesion variability (ILV), and interorgan variability of parameters describing the lesion time‐courses were evaluated. Additionally, a model describing the probability of new lesion appearance and a time‐to‐event model for overall survival (OS), were developed. Before treatment initiation, the lesions were largest in the soft tissues and smallest in the lungs, and associated with a significant IIV and ILV. The tumor growth rate was 2.6 times higher in the breasts and liver, compared with other metastatic sites. The docetaxel drug effect in the liver, breasts, and soft tissues was greater than or equal to 1.2 times higher compared with other organs. The time‐course of the largest lesion, the presence of at least 3 liver lesions, and the time since study enrollment, increased the probability of new lesion appearance. New lesion appearance, along with the time to growth and time‐course of the largest lesion at baseline, were identified as the best predictors of OS. This tumor modeling approach, incorporating individual lesion dynamics, provided a more complete understanding of heterogeneity in tumor growth and drug effect in different organs. Thus, there may be potential to tailor treatments based on lesion location, lesion size, and early lesion response to provide better clinical outcomes.
Study Highlights.
WHAT IS THE CURRENT KNOWLEDGE ON THE TOPIC?
The individual tumor lesion data, which comprise the sum of the longest diameters (SLDs), contain lesion dynamic data and organ location that are often ignored in the investigation of predictors of long‐term clinical end points, such as overall survival (OS). The lesion data may better describe disease progression and OS more so than a composite SLD.
WHAT QUESTION DID THIS STUDY ADDRESS?
The time‐course of individual metastatic lesions was characterized and quantified the interlesion and interorgan variability in patients with HER2‐negative breast cancer treated with docetaxel. Further, the ability of various lesion‐related metrics to predict appearance of new lesions, dropout from tumor measurements, and OS were evaluated.
WHAT DOES THIS STUDY ADD TO OUR KNOWLEDGE?
The developed tumor modeling approach, incorporating individual lesion dynamics, provided a more complete understanding of heterogeneity in tumor dynamics in different organs. The tumor growth rate and drug‐induced shrinkage were different between metastatic sites, whereas the rate of appearance of resistance toward docetaxel was the same in all organs. Metastasis of the liver was associated with a poor prognosis as it was associated with increased hazard of both the appearance of new lesions as well as death. Appearance of new lesions along with metrics driven from tumor dynamics were predictive of OS.
HOW MIGHT THIS CHANGE DRUG DISCOVERY, DEVELOPMENT, AND/OR THERAPEUTICS?
The developed modeling framework provided information about the treatment response/tumor growth in various metastatic sites. This modeling approach can be applied to other cancer types and therapies to provide a better understanding of the relationship among drug exposure, individual lesion‐organ response, and new lesion appearance/OS and thereby facilitate early clinical interventions to improve anticancer therapy.
INTRODUCTION
Pharmacometric models are increasingly applied to data collected from oncology trials toward a better understanding of the drug response in patients over time. The time‐course of the sum of the longest diameters (SLDs), or metrics thereof, are investigated as predictors of long‐term clinical end points, such as overall survival (OS). 1 , 2 , 3 , 4 The individual tumor lesion data, which comprise the SLD, contain lesion dynamic data, and organ location that are often ignored. These data may better describe disease progression and OS more so than a composite SLD measurement.
Tumors that originate from the same organ can behave and respond to treatment differently at different metastatic sites even though they are histologically similar, indicating that the growth and drug‐induced shrinkage of individual tumor lesions may be highly dependent on the microenvironment. 5 , 6 , 7 , 8 , 9 It is noteworthy that the metastasis of vital organs is one of the main reasons for death in patients with cancer, and metastasis‐associated death was reported as high as 90% in some cancer types. 10 , 11 , 12 Breast cancer, the most common cancer in women, has a 5‐year survival rate of 99% if the patient had cancer only in the breasts; the survival rate drops to 26% for patients with metastasis, and ~ 75% of deaths in breast cancer were associated with metastasis. 10 Liver, lungs, and brain are the most common metastasis sites having a strong relation to cancer relapse and OS. 13 , 14
Traditionally the tumor (SLD) changes are usually assessed based on the response evaluation criteria in solid tumors (RECIST). The initial version of RECIST (version 1.0) 15 was based on the sum of 10 lesions and a later version (version 1.1) 16 is based on the sum of 5 lesions. When SLD is evaluated, the progression of an individual lesion may be hidden by shrinkage in other lesions, or progression may not be apparent if the increasing lesion has a relatively small absolute size compared with the other target lesions. Consequently, SLD‐based response categorization ignores individual lesions’ and the metastatic organs’ contribution to clinical end points. 5 , 17
Pharmacometric models have an advantage in that different levels of variability can be quantified; however, there are only a few examples where pharmacometric modeling has been applied to characterize lesion dynamics. 18 , 19 , 20 , 21 , 22 For example, analyses by Mercier et al. 18 Schindler et al., 19 , 20 and Claret et al. 21 found significant interlesion variability (ILV) in model parameters, suggesting tumor heterogeneity. Additionally, in a nonparametric analysis using a novel methodology (i.e., “classification clustering of individual lesions”), 22 similarities between lesion dynamics within the same anatomic site classification were observed; however, many patients demonstrated very diverse lesion dynamics when comparing across different tumor site classifications. A model‐based approach, incorporating the understanding of the time‐course of the disease in distinct metastatic sites, and the contribution of lesions to overall response, would help in predicting the expected responses at different timepoints.
In the present study, a pharmacometric modeling approach was developed to describe the time‐course of individual lesions. Detailed survival analysis was performed where, in addition to baseline covariates, tumor dynamics in an organ or of a lesion, and appearance of new lesions were investigated as predictors of the OS. The approach was developed based on data from patients with HER2‐negative metastatic breast cancer receiving docetaxel therapy. In addition to survival analysis, we explored the ability of various lesion‐related metrics to predict new lesions and dropout from tumor measurements.
METHODS
Study population
The tumor data, including metastatic sites, target lesion diameters (LDs), and appearance of new lesions were available from the docetaxel arm of the phase III AVADO trial where the efficacy and safety of combining bevacizumab with docetaxel were investigated in patients with HER2‐negative metastatic breast cancer (ClinicalTrials.gov Identifier: NCT00333775). 23 From the docetaxel arm (n = 241), patients who had no measurable target lesions at baseline (n = 34) or had received bevacizumab before disease progression (n = 24) were excluded. Thus, the current study population comprised of 183 subjects with a median age of 55 years (range 29–83 years). Patients received docetaxel 100 mg/m2 (i.e., 164 mg for a typical woman) infused over 1 h on day 1 of each 3‐week cycle. The tumor size response was evaluated according to RECIST version 1.0 (i.e., up to 10 lesions/patient). The lesions were in the population distributed in seven different metastatic sites, namely breasts, liver, lungs, lymph nodes, mediastinum, soft tissues, and other sites (including adrenal, skin, pelvis, and kidneys). Lesion size and locations were evaluated from computed tomography scans and the median tumor size follow‐up was 32 weeks (range 6–145 weeks). The treatment continued until disease progression, as assessed by RECIST version 1.0, or until intolerable toxicity occurred. The main characteristics of the study population are summarized in Table 1. The AVADO trial was conducted according to the Declaration of Helsinki, the Good Clinical Practice guidelines of the International Conference on Harmonization, and the laws and regulations of the countries involved. The protocol was approved by local ethics committees and written informed consent was obtained from all patients before the screening.
TABLE 1.
Summary of clinical characteristics of the study population
| Characteristics | Median | Range |
|---|---|---|
| Total number of patients, n | 183 | ‐ |
| Age, years | 55 | 29–83 |
| Tumor baseline size, mm | 34 | 10–140 |
| Sum of longest diameters at baseline | 69 | 10–308 |
| Tumor follow‐up, a weeks | 32 | 5–145 |
| Number of organs with metastasis, per patient | 2 | 1–6 |
| Number of lesions, per patient | 3 | 1–10 |
| New lesion appearance (yes), n | 121 | 66% |
| Time of new lesion appearance, weeks | 34.4 | 5.43–111 |
| Death events, n | 93 | 51% |
| Survival follow‐up, weeks | 108 | 12–160 |
| Time to death, weeks | 50 | 12–145 |
Lesion size and locations were evaluated from computed tomography scans every 9 weeks during the first 36 weeks, and thereafter every 12 weeks.
Lesion model
A tumor growth inhibition (TGI) model, without modification, was applied to describe the change in individual lesions over time. 24 In this model, the tumor growth rate is described by an exponential growth function with a first‐order rate constant (k GROW). The tumor size shrinkage rate during treatment is explained by drug exposure, the drug‐specific cell kill rate constant (k SHR), and the emergence of resistance to the treatment (λ; Equation 1). As docetaxel concentrations were not available, a population pharmacokinetic‐pharmacodynamic (PK‐PD) modeling approach 25 (Equation 2) was used along with the TGI model.
| (1) |
| (2) |
where LDia ,1 is the diameter of lesion 1 in organ “a,” is the growth rate constant for organ a, is the docetaxel‐related cell kill rate constant for organ a of the ith subject. is the elimination rate constant in the PK‐PD model and Docetaxel(t) describes the docetaxel exposure driven by dose and elimination rate.
In addition to interindividual (IIV) variability, ILV, 19 , 20 and interorgan variabilities (IORGVs) in lesion baseline, k GROW, λ, and k SHR parameters, were initially considered but it led to model instability and estimation errors. Therefore, ILV in the lesion at baseline and IORGV in k GROW, λ, and k SHR parameters were explored. The typical baseline value for the lesions was evaluated to be organ‐specific. For the parameter for the i th subject (), and an organ a, the value for lesion, j = 1, 2…5 can be written as:
| (3) |
where, is the typical parameter value for organ a, is the random IIV that is common to all organs and lesions within individual i, and Kiaj is the random ILV specific to the lesion, organ, and individual.
The IORGV in k GROW, λ, and k SHR was evaluated as fixed effects. The IORVG in k GROW parameter for different organs a–e for ith subject () can be written as:
| (4) |
where, are the typical parameter value for k GROW for organs a, b, c, d, and e; and is the random IIV. The parametrization for λ and k SHR were similar to k GROW parametrization (Equation 4). Both η and κ are assumed to be normally distributed with mean 0 and variance of ω 2 and π 2, respectively. The ILV for a specific organ was assumed to have a common variance magnitude regardless of the lesion number (i.e., ). The organ‐specific k GROW, λ, and k SHR were allowed to be shared between organs (e.g., ) if they do not differ statistically.
New lesion appearance and dropout from tumor size measurements
Patient dropout was defined as the stopping of docetaxel treatment due to disease progression or “other” event, or at the scheduled end of the trial. The probability of a new lesion or dropout from tumor size measurements can be high for those individuals who have a poor treatment response and/or develop resistance to docetaxel. 26 In simulations, to account for the dropping out from tumor measurement follow‐up, a logistic regression model was used (Equation 5). The probability of identifying new lesion(s) at scheduled measurement time points was described using a logistic regression model. A sequential approach similar to population PK parameters and data (PPP&D) was used in lesion‐new lesion appearance‐dropout modeling.
| (5) |
where,
The different baseline and time‐varying factors that were tested as predictors on the probability of developing new lesions are summarized in Table S1. The predictors evaluated for dropout from tumor size measurements were a 20% increase (in combination with at least a 5 mm absolute increase) in SLD from the tumor nadir, time in the study, baseline SLD, time‐course of SLD, and the appearance of new lesions. 15 , 16
Overall survival model
A parametric time to event (TTE) model with a Weibull function was used for describing the baseline hazard (h 0(t)) of OS events. The effect of potential predictors on h 0(t) was explored using a sequential analysis method similar to the individual PK parameter approach. 27 The long computational times of the lesion model did not allow for using other estimation approaches like the PPP&D or simultaneous approaches 27 when linking the lesion model predictions to the OS model. Individual empirical Bayes estimates (EBEs) from the final lesion model were consequently used to explore the lesion time‐courses, or model‐derived metrics, as predictors of OS. Predictors were investigated alone in an initial univariate analysis and then evaluated in combination (multivariate). Four separate analyses were performed with different types of predictors; (i) baseline characteristics only, (ii) appearance of new lesions, (iii) baseline LD and metrics derived from LD, and (iv) baseline SLD and metrics derived from SLD (sum of either up to 10 lesions [RECIST version 1.0] or up to 5 lesions [RECIST version 1.1]). New lesion was evaluated as a time‐varying categorical covariate (NewLesion = 0 until the new lesion appeared, thereafter NewLesion = 1).
The tumor dataset based on RECIST version 1.1 was created by selecting one (largest) lesion per organ because none of the patients had more than 5 metastatic sites at baseline. For individuals who had a total number of lesions less than five and had more than one lesion/organ, a second lesion/organ was selected from (in the order of priority) liver, lymph nodes, lungs, or other available sites to have a total number of lesions equal to five.
Model development and evaluation
Population models were developed using the nonlinear mixed‐effect modeling software (NONMEM version 7.4). 28 The first‐order conditional estimation method with interaction was used in lesion model development and the Laplace method was used in logistic regression and TTE models. The EBEs from the final lesion model were obtained using the Laplace method with interaction because the estimation method used in regression/TTE models was the Laplace method. Logistic regression models for new lesion appearance and dropout from tumor size measurements were developed in combination and estimated simultaneously. Model development was assisted by Pirana (version 2.9.9) for run management, the Perl‐speaks‐NONMEM (PsN) toolkit for handling NONMEM run commands, R (version 3.6), and Xpose (version 4.1) for model diagnostics and graphical analysis. 29
The objective function value (OFV; −2∙log‐likelihood) and graphical diagnostics were used in the evaluation of model performance. An OFV decrease of 6.64 (p < 0.01) was considered as significant for the addition of one parameter (1 degree of freedom) in the lesion model and an OFV decrease of 3.84 (p < 0.05) was applied in TTE and logistic regression models. The actual decrease in OFV (dOFV) required for p less than 0.05 and 1 degree of freedom in the TTE model was determined to 3.36 using the randomization test (randtest) in the PsN toolkit. 30 While investigating shared k GROW, λ, or k SHR parameter between two metastatic organs (i.e., reduction in one parameter [1 less degree of freedom], or an increase in OFV of 10.83 [p < 0.001]) was considered as significant. Parameter uncertainties were derived using Sampling Importance Resampling 31 or the NONMEM‐provided R matrix. Visual predictive checks (VPCs) for the lesion model and Kaplan–Meier VPCs for the logistic and TTE models were used for evaluating their predictive performance. For VPCs of lesion, new lesion, and dropout models, the final joint model (lesion‐new lesion appearance‐dropout model) was used in the simulations to account for the response‐related dropout observed in the study. Patients were recruited into the study at different dates and they censored from OS follow‐up at the study closure date or at a random time. A competing TTE model was developed in OS simulations to describe the censoring from OS follow‐up.
RESULTS
Data
The lesion data consisted of 2045 observations from 586 lesions distributed among 7 metastatic sites in 183 patients with metastatic HER2‐negative breast cancer (Figure S1). At baseline, a median of three (range 1–10) lesions per patient, from two (range 1–4) metastatic sites were present. More than one metastatic site was present in 44% (n = 81) of the patients. Liver and lymph nodes were the most common metastatic sites, where 49% (n = 90) of the patients in the population had at least one lesion in the liver and 46% (n = 84) had at least one lesion in the lymph nodes.
Lesion model
A TGI model described the individual lesion data and the schematic representation of the structural lesion model are given in Figure S2. The baseline lesion size was characterized by an organ‐specific value along with IIV and ILV (Equation 4). At study enrollment, the lesions were typically largest in soft tissues (44 mm), and smallest in the lungs (19 mm). The most common metastatic organs— liver (24 mm) and lymph nodes (20 mm)—had about half of the size of the typical soft tissue lesions. The ILV was not significantly different between different sites (41% coefficient of variation [CV]) except for the ‘other sites” (67% CV). Notably, ILV was higher than IIV (29% CV) for the baseline lesion diameter. The growth rate (k GROW) and docetaxel drug effect (k SHR) were significantly different between organs, whereas λ was not affected by metastatic site (i.e., the rate of appearance of resistance was the same in all metastatic sites). The fastest growing lesions were from the liver and breasts, the k GROW, Liver was not significantly different from k GROW, Breast, and the estimate was 0.00917 week−1 (a doubling time () of ~ 1.5 years). The slowest growth rate was estimated in k GROW, Lymph nodes, k GROW, Mediastinum, and k GROW, Other, and was 0.00341 week−1 (doubling time of ~ 4 years). The drug effect in the liver, breasts, and soft tissues did not differ statistically and were estimated to be 1.7 times higher than the lungs, mediastinum, and other sites, and 1.23 times higher than the lymph nodes. There was significant IIV in growth rate (135% CV), λ (63% CV), and drug effect (43% CV).
VPCs, illustrated in Figure 1, indicate that the final lesion model can adequately describe the data from liver and lymph nodes (most common organs where lesions were observed) and for SLD (=lesion1+lesion2+…+lesion10). VPCs of all organs and a few individual fits are provided in Figure S3 and Figure S4, respectively. The final lesion model parameters along with their uncertainties are presented in Table 2.
FIGURE 1.
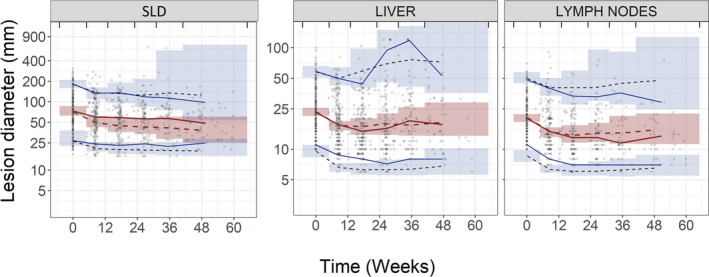
Visual predictive checks (VPCs) of the final lesion model. Sum of their longest diameter (SLD; left) was defined as lesion1+lesion2+…+lesion10, most common metastatic sites (i.e., liver [middle] and lymph nodes [right]). The red solid line represents the median of the observed tumor measurements (circles) and the blue solid lines represent the 5th and 95th percentiles of the observed tumor measurements. The inner shaded region represents the 95% confidence interval of the model simulated median (red dashed line). The outer shaded regions represent the 95% confidence intervals of the model simulated 5th and 95th percentiles and black dashed lines are the simulated median of the corresponding percentiles. Vertical lines indicate binning intervals for VPCs
TABLE 2.
Parameter estimates and their uncertainty in the final lesion model
| Parameter | Description (unit) | Typical value (RSE b ) | IIV, CV% (RSE b ) | ILV, CV% (RSE b ) |
|---|---|---|---|---|
| k GROW, Lung | Tumor growth rate constant (week−1) | 0.00453 (37) | 135 (15) | ‐ |
| k GROW, Liver | 0.00917 (32) | ‐ | ||
| k GROW, Breast | ||||
| k GROW, Lymph nodes | 0.00341 (37) | ‐ | ||
| k GROW, Mediastinum | ||||
| k GROW, Other | ||||
| k GROW, Soft tissue | 0.00676 (48) | ‐ | ||
| k DRUG, Lung | Tumor kill rate constant (week−1) | 0.000742 (27) | 43 (19) | |
| k DRUG, Mediastinum | ||||
| k DRUG, Other | ||||
| k DRUG, Liver | 0.00123 (27) | |||
| k DRUG, Breast | ||||
| k DRUG, Soft tissue | ||||
| k DRUG, Lymph nodes | 0.00101 (28) | |||
| Λ | Resistance parameter (week−1) | 0.126 (26) | 63 (16) | – |
| LD0, Lung | Baseline lesion diameter (mm) | 19.1 (14) | 31 (14) | 40 (9) |
| LD0, Liver | 24.2 (11) | |||
| LD0, Lymph nodes | 20.4 (11) | |||
| LD0, Soft tissue | 44.0 (33) | |||
| LD0, Breast | 41.9 (24) | |||
| LD0, Mediastinum | 23.0 (25) | |||
| LD0, Other | 28.8 (31) | 67 (16) | ||
| k KPD | Docetaxel elimination rate constant in PK‐PD model (week−1) | 0.576 (34) | 62 (16) | – |
| RUV a | Residual unexplained variability (%) | 20.5 (4) | – | – |
Abbreviations: CV%, percent coefficient of variation; IIV, interindividual variability; ILV, interlesion variability; PD, pharmacodynamic; PK, pharmacokinetic; RSE, relative standard error.
Additive residual error model on log transformed data.
Obtained from Sampling Importance Resampling.
New lesion appearance and dropout from tumor size follow‐up
The probability of new lesion appearance was dependent on the time‐course of the largest lesion at baseline, three or more liver lesions at enrollment, and time from the start of treatment (on logarithmic scale). The most significant predictor in the univariate analysis, the time‐course of the largest lesion (dOFV = 13), was associated with a hazard ratio (HR) of 1.71 for every 10% increase in lesion diameter. The patients who had 3 or more target lesions in the liver at baseline had a 62% higher risk (HR = 1.62) of developing a new lesion compared with patients who had less than 3 lesions in the liver. Every week in the study added about 4% increase in risk (HR = 1.04) of developing a new lesion.
As expected, both 20% increase in SLDs (HR = 8.92) and the appearance of new lesions (HR = 5.47) were significantly related to dropout. No other predictors retained significance level after inclusion of 20% increase in SLDs and the appearance of new lesions as predictors of dropout from tumor follow‐up. The final parameter estimates and their uncertainty are given in Table 3 and predictive performances as illustrated in VPCs are shown in Figure 2.
TABLE 3.
Parameter estimates and their uncertainty in the final new lesion appearance and dropout from tumor size model
| Parameter | Description | Typical value (RSE b ) | |
|---|---|---|---|
| New lesion appearance model | |||
| InterceptNew_lesion | Parameter relating to baseline probability of developing new lesion | −7.07 (8.0) | |
|
|
Coefficient of the effect of the time course of largest lesion | 0.488 (23) | |
|
|
Coefficient of the effect of ≥3 liver lesions (y/n) | 0.481 (47) | |
|
|
Coefficient of the effect of time since study start | 0.502 (24) | |
| Dropout from tumor size measurement model | |||
| InterceptDropout | Parameter relating to baseline probability of dropping out | −4.59 (3.0) | |
|
|
Coefficient of the effect of appearance of new lesions on dropout | 2.88 (7.0) | |
|
|
Coefficient of the effect of disease progression a on dropout | 1.99 (14) | |
Abbreviations: RSE, relative standard error; SLD, sum of their longest diameter.
Disease progression defined as 20% increase in SLD from tumor nadir and an absolute increase of 5 mm.
Obtained from NONMEM R‐matrix.
FIGURE 2.

Kaplan–Meier visual predictive checks for the final new lesion appearance model (left) and dropout from tumor size (right). The observed Kaplan–Meier curve (black line) is compared to the 95% confidence interval (shaded area) derived from model simulations (100 samples)
Final overall survival model
A parametric model with Weibull function adequately described the increase in the hazard of death over time. The final OS model showed that the appearance of new lesions, increase in tumor time‐course, and shorter time‐to‐tumor growth (TTG) of SLD (RECIST version 1.0) were associated with a higher hazard of death. In univariate analysis, the most significant predictor of OS was the appearance of a new lesion. However, the hazard of death was not significantly related to the number of new lesions (i.e., regardless of how many new lesions that were present at the time point of new lesion identification), the patient would have a worse prognosis (HR = 2.83) after the identification of new lesions. The OS model based on time‐course and TTG of the largest lesion at baseline (OS model iii) had similar level of statistical significance (dOFV =28, p < 0.001) as that of the OS model based on time‐course and TTG of SLD‐RECIST version 1.0 (dOFV = 34, p < 0.001; OS model iv). Addition of time‐course or TTG of the largest lesion at baseline or RECIST version 1.1 based SLD, on top of SLD‐RECIST version 1.0 based predictors did not show any improvements. Furthermore, the presence of liver lesions, dynamics of liver lesions, more than two target lesions at baseline, and baseline SLD were significant in univariate analysis, but did not retain level of significance in multivariate analysis. Detailed results from OS model i–iv analysis are given in Supplementary OS results. The parameter estimates and VPCs of the final OS model are given in Table S2 and Figure 3, respectively.
FIGURE 3.

Kaplan–Meier visual predictive checks for the final overall survival model. The observed Kaplan–Meier curve (black line) is compared to the 95% confidence interval (shaded area) derived from model simulations (200 samples)
DISCUSSION
In this study, we successfully applied a modeling approach to characterize the longitudinal lesion time‐course and quantified different types of variability in the lesion dynamics in patients with HER2‐negative breast cancer receiving docetaxel treatment. ILV was found to be significant to include in the baseline lesion diameter, but not for the tumor growth rate constant or the drug‐induced shrinkage rate. The results show a significant difference in drug‐induced shrinkage rate and growth rate between different metastatic sites within an individual. Besides, baseline and tumor‐related metrics were explored for their association with new lesion appearance, dropout from tumor size measurements, and OS.
Interestingly, the presence of liver lesions increased the hazard of both the appearance of new lesions as well as death. To our knowledge, there are few other pharmacometric analyses on the appearance of new lesions despite that it is one important criterion to define progressive disease and indicator of poor prognosis. 16 , 32 Liver metastasis was a significant predictor of new lesions, and the appearance of a new lesion was identified as a predictor of OS in a pharmacometric analysis by Zecchin et al. 33 The liver was the most common metastatic site in the current study data and thus the observed shrinkage and regrowth as monitored in SLDs might have been primarily driven by liver lesion dynamics. A high incidence of liver metastasis in breast cancer and the analysis using traditional statistics demonstrated liver metastasis as an independent predictor of worse OS in different subtypes of breast cancer. 34 , 35 The current modeling framework could be applied to other cancers as well where metastasis site data are collected and to identify the influential metastasis on OS.
Our study results suggest that OS can be predicted by the appearance of new lesions, model‐predicted lesion time‐course, along with TTG of the SLD. The tumor time‐course 19 , 36 and TTG 21 , 37 , 38 , 39 , 40 of the SLD or lesion level data, as well as combination of time‐course and TTG, 41 have earlier been suggested as predictors of OS. However, in the present study, we have compared predictors of survival based on both SLD and lesion level information. A study by Claret et al. 21 determined that the TTG of the fastest progressing lesion was the best predictor of OS and predictions based on the lesion model performed slightly better than SLD. In contrast, the current study results have shown TTG of SLD had performed marginally better than the single, largest lesion‐based metric. In both univariate and multivariate analysis (OS model iii), the dynamics of the largest lesion at baseline has valuable information on assessing the risk of death of an individual patient. Moreover, the same metrics (i.e., TS(t) along with TTG) were included in the final OS models based on lesion (OS model iii) and SLD (OS model iv) as predictors, but the OFV drop associated with the addition of predictors based on SLD was slightly better than those of lesion based. In addition, we could conclude that following 5 lesions, as in RECIST version 1.1, would in this study population perform just as good as the information on data on 10 lesions (RECIST version 1.0) in assessing the risk of death. A couple of earlier studies 42 , 43 have compared the tumor response categorization in RECIST version 1.0 versus RECIST version 1.1 and found an excellent agreement in assessing tumor response between versions. Our study results support these findings and add valuable information that regardless of the version of RECIST applied, the tumor time‐course and model predicted TTG predict survival. Instead of the sum of lesions, even the time‐course of the largest lesion provided an equal level of significance (p < 0.001) to predict OS in the current analysis. The selection of the lesions in a patient with multiple lesions could be subjective, and collecting a maximum of 2 lesions per organ, as in RECIST version 1.1, is likely enough to account for the variability in the response. Interestingly, baseline covariates were either not significant or did not retain level of significance (SLD0 and LES10) once the time‐course (which contain baseline tumor information) was included as a predictor of OS.
A model based on SLD combined with risk for new lesion would be enough for investigating predictors of the survival. Thus, the modeling of individual lesions is not intended to replace the traditional SLD based analysis—instead, it provides more detailed information about the treatment response/tumor growth in various metastatic sites. Individual lesion modeling provides a quantitative measure of various variability for an anticancer drug and indication and may find further application in combination chemotherapies, when one drug may directly target a specific receptor expression organ, and the other drug has nonspecific targeting. Furthermore, this modeling framework allows evaluation of individual lesion dynamics and organ‐specific dynamics as a predictor of OS. An extension to this work could be to explore if information of individual lesion dynamics would improve the prediction of the individual hazard of death compared with SLD‐based metrics. The number of differential equations (one differential equation for every lesion‐organ combination) and the estimation of different levels of variability lead to long (~ 9 h at 15 nodes) computational run times, hence a parsimonious model was applied in the current study. The TGI model, applied in the current study, has been used for different anticancer drug classes in various indications. 19 , 24 , 26 , 36 , 38 , 44 Alternative approaches that could be considered include tumor models requiring multiple compartments, such as biexponential, 45 sensitive‐resistant, 46 , 47 , 48 , 49 or proliferative‐quiescent. 50 , 51 The loss of further tumor measurements at the time of progression restricted the evaluation of more complex growth curves and the developed model may not necessarily be valid for extrapolation beyond disease progression. However, the individual fits and VPCs based on TGI model did a reasonable job of describing the profiles at both lesion and SLD level data.
In conclusion, this model framework successfully described the lesion time‐course and quantification of IIV, ILV, and IORGV in different model parameters. ILV was here significant in the organ‐specific baseline lesion diameters, whereas significant IORGV was estimated in growth and shrinkage parameters. The probability of developing a new lesion and the hazard of death were increased by the presence of liver metastasis, indicating that the liver is the major metastatic site in the treatment prognosis for this group of patients. The appearance of new lesions along with tumor time‐course and TTG of SLD were identified as the best predictors of the clinical end point OS. This modeling approach can be applied to other cancer types and therapies to provide a better understanding of the relationship among drug exposure, individual lesion‐organ response, and new lesion appearance/OS and thereby facilitate early clinical interventions to improve anticancer therapy.
CONFLICT OF INTEREST
B.C.B. and A.L.Q. are employees of Genentech Inc. L.E.F. has acted as a paid consultant to Genentech Inc. All other authors declared no competing interests for this work.
AUTHOR CONTRIBUTIONS
S.M.K., S.S.L., B.C.B., A.L.Q., and L.E.F. wrote the manuscript. S.M.K., S.S.L., B.C.B., A.L.Q., and L.E.F. designed the research. S.M.K. and S.S.L. performed the research. S.M.K., S.S.L., B.C.B., A.L.Q., and L.E.F. analyzed the data.
DISCLAIMER
As Deputy Editor‐in‐Chief of CPT: Pharmacometrics & Systems Pharmacology, Lena E. Friberg was not involved in the review or decision process for this paper.
Supporting information
Supplementary Material
Supplementary Material
Supplementary Material
Supplementary Material
Funding information
This work was supported by the Swedish Cancer Society and Genentech Inc., San Francisco, CA.
REFERENCES
- 1. Bender BC, Schindler E, Friberg LE. Population pharmacokinetic‐pharmacodynamic modelling in oncology: A tool for predicting clinical response. Br J Clin Pharmacol. 2015;79:56‐71. [DOI] [PMC free article] [PubMed] [Google Scholar]
- 2. Mould DR, Walz A‐C, Lave T, Gibbs JP, Frame B. Developing exposure/response models for anticancer drug treatment: special considerations. CPT Pharma Syst Pharmacol. 2015;4(1):12‐27. 10.1002/psp4.16 [DOI] [PMC free article] [PubMed] [Google Scholar]
- 3. Venkatakrishnan K, Friberg LE, Ouellet D, et al. Optimizing oncology therapeutics through quantitative translational and clinical pharmacology: challenges and opportunities. Clin Pharmacol Ther. 2015;97:37‐54. [DOI] [PubMed] [Google Scholar]
- 4. Bruno R, Bottino D, de Alwis DP, et al. Progress and opportunities to advance clinical cancer therapeutics using tumor dynamic models. Clin Cancer Res. 2020;26(8):1787‐1795. 10.1158/1078-0432.ccr-19-0287 [DOI] [PMC free article] [PubMed] [Google Scholar]
- 5. Cusnir M, Cavalcante L. Inter‐tumor heterogeneity. Hum Vaccin Immunother. 2012;8:1143‐1145. [DOI] [PMC free article] [PubMed] [Google Scholar]
- 6. Loupakis F, Pollina L, Stasi I, et al. PTEN expression and KRAS mutations on primary tumors and metastases in the prediction of benefit from cetuximab plus irinotecan for patients with metastatic colorectal cancer. J Clin Oncol. 2009;27:2622‐2629. [DOI] [PubMed] [Google Scholar]
- 7. Sun Y. Tumor microenvironment and cancer therapy resistance. Cancer Lett. 2016;380(1):205‐215. 10.1016/j.canlet.2015.07.044 [DOI] [PubMed] [Google Scholar]
- 8. Paget S. The distribution of secondary growths in cancer of the breast. The Lancet. 1889;133(3421):571‐573. 10.1016/s0140-6736(00)49915-0 [DOI] [PubMed] [Google Scholar]
- 9. Senthebane DA, Rowe A, Thomford NE, et al. The role of tumor microenvironment in chemoresistance: to survive, keep your enemies closer. Int J Mol Sci. 2017;18:1586. 10.3390/ijms18071586 [DOI] [PMC free article] [PubMed] [Google Scholar]
- 10. Dillekås H, Rogers MS, Straume O. Are 90% of deaths from cancer caused by metastases? Cancer Med. 2019;8(12):5574‐5576. 10.1002/cam4.2474 [DOI] [PMC free article] [PubMed] [Google Scholar]
- 11. Hanahan D, Weinberg RA. The hallmarks of cancer. Cell. 2000;100(1):57‐70. 10.1016/s0092-8674(00)81683-9 [DOI] [PubMed] [Google Scholar]
- 12. Gupta GP, Massagué J. Cancer metastasis: building a framework. Cell. 2006;127(4):679‐695. 10.1016/j.cell.2006.11.001 [DOI] [PubMed] [Google Scholar]
- 13. Harrell JC, Prat A, Parker JS, et al. Genomic analysis identifies unique signatures predictive of brain, lung, and liver relapse. Breast Cancer Res Treat. 2012;132(2):523‐535. 10.1007/s10549-011-1619-7 [DOI] [PMC free article] [PubMed] [Google Scholar]
- 14. Pisani P, Parkin DM, Bray F, Ferlay J. Estimates of the worldwide mortality from 25 cancers in 1990. Int J Cancer. 1999;83(1):18‐29. [DOI] [PubMed] [Google Scholar]
- 15. Therasse P, Arbuck SG, Eisenhauer EA, et al. New guidelines to evaluate the response to treatment in solid tumors. J Natl Cancer Inst. 2000;92:205‐216. 10.1093/jnci/92.3.205 [DOI] [PubMed] [Google Scholar]
- 16. Eisenhauer EA, Therasse P, Bogaerts J, et al. New response evaluation criteria in solid tumours: revised RECIST guideline (version 1.1). Eur J Cancer. 2009;45:228‐247. 10.1016/j.ejca.2008.10.026 [DOI] [PubMed] [Google Scholar]
- 17. Foo J, Michor F. Evolution of acquired resistance to anti‐cancer therapy. J Theor Biol. 2014;355:10‐20. 10.1016/j.jtbi.2014.02.025 [DOI] [PMC free article] [PubMed] [Google Scholar]
- 18. Mercier F, Kerioui M, Desmée S, et al. Longitudinal analysis of organ‐specific tumor lesion sizes in metastatic colorectal cancer patients receiving first line standard chemotherapy in combination with anti‐angiogenic treatment. J Pharmacokinet Pharmacodyn. 2020;47(6):613‐625. [DOI] [PubMed] [Google Scholar]
- 19. Schindler E, Krishnan SM, Mathijssen RHJ, Ruggiero A, Schiavon G, Friberg LE. Pharmacometric modeling of liver metastases' diameter, volume, and density and their relation to clinical outcome in imatinib‐treated patients with gastrointestinal stromal tumors. CPT Pharmacometrics Syst Pharmacol. 2017;6(7):449‐457. 10.1002/psp4.12195 [DOI] [PMC free article] [PubMed] [Google Scholar]
- 20. Schindler E, Amantea MA, Karlsson MO, Friberg LE. PK‐PD modeling of individual lesion FDG‐PET response to predict overall survival in patients with sunitinib‐treated gastrointestinal stromal tumor. CPT Pharmacometrics Syst Pharmacol. 2016;5(4):173‐181. 10.1002/psp4.12057 [DOI] [PMC free article] [PubMed] [Google Scholar]
- 21. Claret L, Pentafragka C, Karovic S, et al. Comparison of tumor size assessments in tumor growth inhibition‐overall survival models with second‐line colorectal cancer data from the VELOUR study. CPT Pharmacometrics Syst Pharmacol. 2018;82(1):49‐54. 10.1007/s00280-018-3587-7 [DOI] [PubMed] [Google Scholar]
- 22. Terranova N, Girard P, Ioannou K, Klinkhardt U, Munafo A. Assessing similarity among individual tumor size lesion dynamics: the CICIL methodology. CPT Pharmacometrics Syst Pharmacol. 2018;7(4):228‐236. 10.1002/psp4.12284 [DOI] [PMC free article] [PubMed] [Google Scholar]
- 23. Miles DW, Chan A, Dirix LY, et al. Phase III study of bevacizumab plus docetaxel compared with placebo plus docetaxel for the first‐line treatment of human epidermal growth factor receptor 2‐negative metastatic breast cancer. J Clin Oncol. 2010;28:3239‐3247. 10.1200/JCO.2008.21.6457 [DOI] [PubMed] [Google Scholar]
- 24. Claret L, Girard P, Hoff PM, et al. Model‐based prediction of phase III overall survival in colorectal cancer on the basis of phase II tumor dynamics. J Clin Oncol. 2009;27:4103‐4108. 10.1200/JCO.2008.21.0807 [DOI] [PubMed] [Google Scholar]
- 25. Jacqmin P, Snoeck E, van Schaick EA, et al. Modelling response time profiles in the absence of drug concentrations: definition and performance evaluation of the K–PD model. J Pharmacokinet Pharmacodyn. 2007;34(1):57‐85. 10.1007/s10928-006-9035-z [DOI] [PubMed] [Google Scholar]
- 26. Hansson EK, Amantea MA, Westwood P, et al. PKPD modeling of VEGF, sVEGFR‐2, sVEGFR‐3, and sKIT as predictors of tumor dynamics and overall survival following sunitinib treatment in GIST. CPT Pharmacometrics Syst Pharmacol. 2013;2(11):84. 10.1038/psp.2013.61 [DOI] [PMC free article] [PubMed] [Google Scholar]
- 27. Zhang L, Beal SL, Sheiner LB. Simultaneous vs. sequential analysis for population PK/PD data II: Robustness of methods. J Pharmacokinet Pharmacodyn. 2003;30(6):405‐416. 10.1023/b:jopa.0000012999.36063.4e [DOI] [PubMed] [Google Scholar]
- 28. Beal S, Sheiner L, Boeckmann A, Bauer R. NONMEM 7.4 users guides (ICON plc, Gaithersburg, MD, 1989–2018). Gaithersburg, MD: Icon Development Solutions; 2018. [Google Scholar]
- 29. Keizer RJ, Karlsson MO, Hooker A. Modeling and simulation workbench for NONMEM: Tutorial on Pirana, PsN, and Xpose. CPT Pharmacometrics Syst Pharmacol. 2013;2(6):50. 10.1038/psp.2013.24 [DOI] [PMC free article] [PubMed] [Google Scholar]
- 30. Nordgren R, Freiberga S, Ueckert S, Yngman G, Karlsson M. PsN: An open source toolkit for non‐linear mixed effects modelling. 2004. https://uupharmacometrics.github.io/PsN/.
- 31. Dosne A‐G, Bergstrand M, Harling K, Karlsson MO. Improving the estimation of parameter uncertainty distributions in nonlinear mixed effects models using sampling importance resampling. J Pharmacokinet Pharmacodyn. 2016;43:583‐596. [DOI] [PMC free article] [PubMed] [Google Scholar]
- 32. Shibutani M, Maeda K, Nagahara H, et al. Impact of the occurrence of new lesions on the survival of patients who undergo chemotherapy for metastatic colorectal cancer. Mol Clin Oncol. 2019;10:285‐292. [DOI] [PMC free article] [PubMed] [Google Scholar]
- 33. Zecchin C, Gueorguieva I, Enas NH, Friberg LE. Models for change in tumour size, appearance of new lesions and survival probability in patients with advanced epithelial ovarian cancer. Br J Clin Pharmacol. 2016;82(3):717‐727. 10.1111/bcp.12994 [DOI] [PMC free article] [PubMed] [Google Scholar]
- 34. Gerratana L, Fanotto V, Bonotto M, et al. Pattern of metastasis and outcome in patients with breast cancer. Clin Exp Metastasis. 2015;32(2):125‐133. 10.1007/s10585-015-9697-2 [DOI] [PubMed] [Google Scholar]
- 35. Zhao H‐Y, Gong Y, Ye F‐G, Ling H, Hu X. Incidence and prognostic factors of patients with synchronous liver metastases upon initial diagnosis of breast cancer: a population‐based study. Cancer Manag Res. 2018;10:5937‐5950. 10.2147/cmar.s178395 [DOI] [PMC free article] [PubMed] [Google Scholar]
- 36. Schindler E, Amantea MA, Karlsson MO, Friberg LE. A pharmacometric framework for axitinib exposure, efficacy, and safety in metastatic renal cell carcinoma patients. CPT: Pharmacometrics Syst Pharmacol. 2017;6(6):373‐382. 10.1002/psp4.12193 [DOI] [PMC free article] [PubMed] [Google Scholar]
- 37. Claret L, Bruno R, Lu JF, Sun YN, Hsu CP. Exploratory modeling and simulation to support development of motesanib in Asian patients with non‐small cell lung cancer based on MONET1 study results. Clin Pharmacol Ther. 2014;95:446‐451. [DOI] [PubMed] [Google Scholar]
- 38. Claret L, Gupta M, Han K, et al. Evaluation of tumor‐size response metrics to predict overall survival in Western and Chinese patients with first‐line metastatic colorectal cancer. J Clin Oncol. 2013;31:2110‐2114. 10.1200/JCO.2012.45.0973 [DOI] [PubMed] [Google Scholar]
- 39. Han K, Claret L, Sandler A, et al. Modeling and simulation of maintenance treatment in first‐line non‐small cell lung cancer with external validation. BMC Cancer. 2016;16(1). 10.1186/s12885-016-2455-2 [DOI] [PMC free article] [PubMed] [Google Scholar]
- 40. Claret L, Mercier F, Houk BE,Milligan PA, Bruno R. Modeling and simulations relating overall survival to tumor growth inhibition in renal cell carcinoma patients. Cancer Chemother Pharmacol. 2015;76(3):567‐573. 10.1007/s00280-015-2820-x [DOI] [PubMed] [Google Scholar]
- 41. Tardivon C, Desmée S, Kerioui M, et al. Association between tumor size kinetics and survival in patients with urothelial carcinoma treated with atezolizumab: implication for patient follow‐up. Clin Pharmacol Ther. 2019;106:810‐820. 10.1002/cpt.1450 [DOI] [PubMed] [Google Scholar]
- 42. Jang G‐S, Kim M‐J, Ha H‐I, et al. Comparison of RECIST version 1.0 and 1.1 in assessment of tumor response by computed tomography in advanced gastric cancer. Chin J Cancer Res. 2013;25:689‐694. 10.3978/j.issn.1000-9604.2013.11.09 [DOI] [PMC free article] [PubMed] [Google Scholar]
- 43. Choi HC, Kim JH, Kim HS, et al. Comparison of the RECIST 1.0 and RECIST 1.1 in non‐small cell lung cancer treated with cytotoxic chemotherapy. J Cancer. 2015;6(7):652‐657. 10.7150/jca.11794 [DOI] [PMC free article] [PubMed] [Google Scholar]
- 44. Bruno R, Lindbom L, Schaedeli Stark F, et al. Simulations to assess phase II noninferiority trials of different doses of capecitabine in combination with docetaxel for metastatic breast cancer. CPT Pharmacometrics Syst Pharmacol. 2012;1(12):19. 10.1038/psp.2012.20 [DOI] [PMC free article] [PubMed] [Google Scholar]
- 45. Stein WD, Yang J, Bates SE, Fojo T. Bevacizumab reduces the growth rate constants of renal carcinomas: A novel algorithm suggests early discontinuation of bevacizumab resulted in a lack of survival advantage. The Oncologist. 2008;13(10):1055‐1062. 10.1634/theoncologist.2008-0016 [DOI] [PMC free article] [PubMed] [Google Scholar]
- 46. Bender B, Jin J, Friberg L. A Mechanism‐based model of tumor quiescence and resistance in HER2‐negative metastatic breast cancer in patients receiving docetaxel or paclitaxel. 2017. http://urn.kb.se/resolve?urn=urn:nbn:se:uu:diva‐292728
- 47. Ollier E, Mazzocco P, Ricard D, et al. Analysis of temozolomide resistance in low‐grade gliomas using a mechanistic mathematical model. Fundam Clin Pharmacol. 2017;31:347‐358. [DOI] [PubMed] [Google Scholar]
- 48. Yang J, Zhao T‐J, Yuan C‐Q, Xie J‐H, Hao F‐F. A nonlinear competitive model of the prostate tumor growth under intermittent androgen suppression. J Theor Biol. 2016;404:66‐72. 10.1016/j.jtbi.2016.05.033 [DOI] [PubMed] [Google Scholar]
- 49. Ideta AM, Tanaka G, Takeuchi T, Aihara K. A mathematical model of intermittent androgen suppression for prostate cancer. J Nonlinear Sci. 2008;18(6):593‐614. 10.1007/s00332-008-9031-0 [DOI] [Google Scholar]
- 50. Ribba B, Kaloshi G, Peyre M, et al. A tumor growth inhibition model for low‐grade glioma treated with chemotherapy or radiotherapy. Clin Cancer Res. 2012;18:5071‐5080. 10.1158/1078-0432.CCR-12-0084 [DOI] [PubMed] [Google Scholar]
- 51. Panetta JC, Schaiquevich P, Santana VM, Stewart CF. Using pharmacokinetic and pharmacodynamic modeling and simulation to evaluate importance of schedule in topotecan therapy for pediatric neuroblastoma. Clin Cancer Res. 2008;14(1):318‐325. 10.1158/1078-0432.ccr-07-1243 [DOI] [PubMed] [Google Scholar]
Associated Data
This section collects any data citations, data availability statements, or supplementary materials included in this article.
Supplementary Materials
Supplementary Material
Supplementary Material
Supplementary Material
Supplementary Material