Abstract
Background:
Previous studies using diffusion tensor imaging (DTI)-based connectome analysis revealed improved connectivity in cerebral palsy (CP) patients who underwent autologous umbilical cord blood (UCB) stem-cell therapy. However, the potential mechanism for the connectivity increase remains unclear and needs to be further elucidated.
Purpose:
To develop a technique with improved accuracy for quantitative susceptibility mapping (QSM) with unique sensitivity to myelin, and demonstrate its use in elucidating the underlying mechanism of the observed motor function improvement and brain connectivity increase in CP patients who received autologous UCB stem-cell therapy.
Study Type:
Prospective.
Population:
A cohort of eight pediatric CP patients (2.6 ± 0.6 years of age) with intact corticospinal tracts (CST) from a randomized, placebo-controlled trial of autologous UCB stem-cell therapy in CP children was included in this study.
Field Strength/Sequence:
DTI and 3D spoiled gradient recalled (SPGR) QSM at 3.0T.
Assessment:
Pre- and posttreatment magnetic susceptibility (χ) and the rotationally-invariant magnetic susceptibility anisotropy (MSA) along the CST were derived. Behavioral changes were assessed using the 66-item Gross Motor Function Measurement. Changes in χ and MSA were compared between patients with and without substantial behavioral improvements.
Statistical Tests:
Two-sample t-tests were performed to assess the differences in the changes of measurements of interest (Δχ, ΔMSA, and ΔFA) between patients who significantly improved and those who did not.
Results:
Patients who demonstrated posttreatment motor improvements exceeding expectations showed significantly more diamagnetic Δχ in the periventricular region along the CST (P = 0.003). Further analysis on the ΔMSA of this region was significantly increased (P = 0.006) for high responders, along with concurrent FA increase.
Data Conclusion:
These initial findings suggest that the DTI tract-based QSM method has the potential to characterize white matter changes associated with behavioral improvements in CP children who underwent cord blood stem-cell therapy.
CEREBRAL PALSY (CP) refers to a heterogeneous group of nonprogressive but permanent motor dysfunctions as the result of injuries to the developing fetal or neonatal brains.1 It is commonly classified according to the pattern of extremity involvement and further by the character of the abnormality in muscle tone or movement.2,3 CP is one of the major causes of childhood disability, with a worldwide prevalence rate of above 3 per 1000 live births.4 Damage to brain parenchyma is commonly seen in CP patients as diffuse and/or focal lesions in the white matter (WM), often most severe in the periventricular regions, disrupting the central motor pathway that makes up the corticospinal tract (CST).5
Functionally, impairments in the motor pathway result in motor deficiency; and structurally these impairments manifest as reduced brain connectivity.6 Our previous work in CP using diffusion tensor imaging (DTI)-based connectome analysis revealed impaired connectivity in motor pathways.7
While current interventions for CP patients remain supportive, not curative, recent work in autologous cord blood stem-cell therapy has shown promise in improving motor performance in pediatric CP patients.8,9 A concurrent neuroimaging study by our group has also revealed improved connectivity in the motor network as well as throughout the brain in patients responding to stem-cell therapy.10 However, the underlying mechanism for the connectivity improvements remains unclear. DTI measures like connectivity are measured indirectly and could be impacted by several factors, such as myelin, axonal membrane, neural tubules, and crossing fibers. It is possible that either axonal or myelin repair contributes to the increased connectivity of the fiber pathways. Thus, it is of critical importance to develop advanced tissue-specific magnetic resonance imaging (MRI) methods to further distinguish the possible myelination from axonal changes, and to understand its role in improving brain connectivity.
Prior work using quantitative susceptibility mapping (QSM) has shown its unique sensitivity to myelin.11,12 However, in WM, since magnetic susceptibility is modeled as a tensor and has shown orientation dependency, it requires measurements from at least six noncolinear angles from the main magnetic field to achieve an accurate assessment. Previous studies rotated the sample and scanned in multiple orientations,13,14 which is impractical for in vivo clinical scans due to the need for difficult head rotations inside the scanner.
We hereby propose a DTI tract-based QSM approach to account for the angle dependency of the magnetic susceptibility in the WM tracts, which only requires a QSM scan from one orientation. The proposed methodology was tested on our cohort of CP patients to test its feasibility and investigate the potential mechanism of the connectivity increase in the patients who responded to the stem-cell therapy.
Materials and Methods
Patients
Patients were selected from a randomized, placebo-controlled trial of 1-year autologous cord blood stem-cell therapy in CP-afflicted children if they met the following criteria:
patients were between 2 and 4 years old (patients <2 years old were excluded to ensure accurate behavioral measurements);
patients were diagnosed with spastic CP classified at a Gross Motor Function Classification System level of I, II, III, or IV; and
patients had a sufficiently normal structural MRI to complete the registration to the pediatric brain template.
Written informed consent was obtained from the parents of each participant. All study-related procedures were approved by the Institutional Review Board.
Behavioral assessments, including physical examinations, Gross Motor Function Classification System (GMFCS) assessments, and the 66-item Gross Motor Function Measurement (GMFM-66), were performed pre- and posttreatment to evaluate their motor control, muscle tone, spasticity, overall flexibility, and reflexes.15,16 The GMFM-66 increase beyond expectation was calculated by subtracting the expected GMFM-66 score due to normal brain development from the actual GMFM-66 score to account for the age-expected gains. This “actual minus expected GMFM-66 score change” is referred to as “GMFM-66 change beyond expectation” in the following context, and indicates the behavioral improvements beyond normal aging.
Twenty-five patients had completed the behavioral and neuroimaging assessments both pre- and posttreatment; however, eight patients were excluded due to age not between 2 and 4 years old, and nine of the remaining patients did not have sufficiently normal brain structure to perform anatomical registration and fiber tracking. As a result, eight patients were included in this study. Patient demographics and behavioral measures are presented in Table 1.
TABLE 1.
Demographic Information of the Cerebral Palsy Patient Cohort
| Subject | Age at infusion (years) | Infused dose (×107 cells/kg) | GMFCS level at infusion | GMFM-66 at infusion | GMFM-66 change | GMFM-66 change beyond expectation | Typography |
|---|---|---|---|---|---|---|---|
| 1 | 2.4 | 1.48 | III | 34 | 0 | −3.7 | Q |
| 2 | 2.3 | 4.83 | II | 64 | 2 | −0.4 | H(Rh) |
| 3 | 2.7 | 1.92 | IV | 27 | 0 | −2.3 | Q |
| 4 | 2.5 | 0.75 | II | 58 | 3 | −1.2 | Q |
| 5 | 2.0 | 3.73 | II | 62 | 8 | 4.5 | H(Rh) |
| 6 | 2.1 | 2.39 | III | 50 | 15 | 12.6 | Q |
| 7 | 3.8 | 2.18 | I | 61 | 7 | 4.5 | H(Lh) |
| 8 | 3.0 | 3.77 | III | 50 | 19 | 15.4 | T(LUE) |
Q = quadriplegic; H(Rh) = hemiplegic right hemisphere; H(Lh) = hemiplegic left hemisphere; T(LUE) = tetraplegic left upper extremity.
Our patient cohort had an average age of 2.6 ± 0.6 years pretreatment. For analysis, they were evenly separated into two subgroups based on their behavioral improvement: high responders (ie, GMFM-66 change beyond expectation >0) and low responders (GMFM-66 change beyond expectation <0).The high-responding group had an average age = 2.7 ± 0.8 years pretreatment, with a mean GMFM-66 change beyond expectation of 9.25 ± 5.60; The low-responding group had an average age of 2.5 ± 0.2 years pretreatment, with a mean GMFM-66 change beyond expectation of −1.90 ± 1.43.
MRI Reconstruction and Data Analysis
Patients were sedated during the MRI scans to limit subject discomfort and motion artifacts. Each patient was scanned pre- and posttreatment, and the two timepoints were 1-year apart. All MRI scans were performed on a 3T GE MR750 scanner (Waukesha, WI), including high-resolution structural MRIs, DTI, and QSM, as detailed below.
DIFFUSION TENSOR IMAGING (DTI).
Diffusion-weighted echo-planar images (EPI) were acquired using 25 diffusion directions at b = 1000 s/mm2 with three nondiffusion-weighted images (B0 images). Dynamic eddy-current corrections were employed to reduce the diffusion-direction-dependent spatial distortions. Echo time (TE) of 70.5 msec, repetition time (TR) of 12 seconds, and SENSitivity Encoding (SENSE) acceleration factor of 2 were used. A resolution of 2 × 2 × 2 mm3 was achieved using a 96 × 96 acquisition matrix in a field of view (FOV) of 192 × 192 mm2.
Diffusion images were quality-checked to confirm suitability for subsequent analysis using the DTIPrep package,17 and further denoised to improve the precision of diffusion parameter estimation and fiber tracking.18 Diffusion tensors were then extracted using the Diffusion Toolkit,19 and diffusion fractional anisotropy (FA) values were calculated. Fiber tractography was performed using tools from the Connectome Mapper Toolkit (CMTK) with an angle threshold of 60° and an FA threshold of 0.2. WM regions of interest (ROIs) were obtained by warping and registering the JHU-DTI-MNI “Eve” atlas template20 into each subject’s DTI image space using the Large Deformation Diffeomorphic Metric Mapping (LDDMM) algorithm,21 which has been applied successfully in our prior CP studies.7,10 The CST was determined using the parcellated precentral gyrus, the internal capsule, and the pons in both hemispheres as seed ROIs. The fiber angle at each voxel along the CST was obtained from the diffusion tensors and was later used to quantify the susceptibility anisotropy.
QUANTITATIVE SUSCEPTIBILITY MAPPING (QSM).
Images for QSM were acquired using a standard flow-compensated 3D multiecho spoiled gradient recalled (SPGR) pulse sequence with following parameters: TR = 48 msec, TE1 = 3 msec, echo spacing (ΔTE) = 2.12 msec, number of echoes = 16, flip angle = 20°, spatial resolution = 1 × 1 × 1 mm3, FOV = 192 × 192 × 120 mm3.
The images were reconstructed from the multicoil k-space data and separated into magnitude and phase. The magnitude maps were skull-stripped using the brain extraction tool (BET) in FSL.22 The raw phase was processed using a Laplacian-based phase unwrapping method, and the normalized phase was calculated as , where φi is the phase of the i-th echo, n is the number of echoes, γ is the gyromagnetic ratio, and B0 is the strength of the main magnetic field. The background noise was removed using a varying-radius SHARP method.23,24 QSM images were calculated using STAR-QSM (streaking artifact reduced quantitative susceptibility mapping).25,26 QSM images at baseline were registered to the QSM images 1-year posttreatment using the LDDMM algorithm. The pre- and posttreatment QSM images were coregistered, and the 1-year change in magnetic susceptibility was then determined by subtracting the two images: Δχ = χ(posttreatment) – χ(pretreatment). A negative Δχ indicates the voxel is more diamagnetic posttreatment.
DETERMINATION OF THE ROTATIONALLY-INVARIANT MAGNETIC SUSCEPTIBILITY ANISOTROPY (MSA).
It has been reported that the magnetic susceptibility of WM is sensitive to the presence of the ordered lipids that constitute the myelin sheath in WM tracts, and follows a sine-square dependence on the tract orientations due to the cylindrical pattern of the phospholipid around the axons,27,28 as defined by the following equation:
| (1) |
Here, χα is the macroscopic susceptibility from QSM, α is the angle between the WM fiber and the main B0 field, and χ0 is the baseline susceptibility when the fiber is parallel to B0, which accounts for the susceptibility due to the choice of susceptibility reference and the isotropic susceptibility elements in WM. The MSA is theoretically defined as , where χ90 is the macroscopic susceptibility when the fiber is perpendicular to B0 and flipid is the fraction of myelin lipid. The derived MSA is rotationally invariant, thereby providing a more quantitative susceptibility-based metric for WM.
MSA was obtained through a fitting routine using all the voxels in a particular fiber tract (eg, CST) as determined by DTI tractography. The angle between the primary diffusion direction at each voxel along the CST and B0 was obtained, and then MSA was quantified by fitting all the voxels along the CST using Eq. (1 via least-squares regression. The pre- and posttreatment change of MSA was determined by ΔMSA = MSA(posttreatment) – MSA(pretreatment). A negative ΔMSA indicates that the tract is more diamagnetic after treatment.
Statistical Analysis
For comparisons between the susceptibility change of an individual subject determined by the macroscopic susceptibility values (χ) and the angle-corrected MSA, the pre- and posttreatment change of χ along the same region of CST where MSA is calculated were assessed using a voxel-by-voxel t-test.
For comparisons between the high- and low-responding groups, two-sample t-tests were conducted to assess the differences in the changes of measurements of interest (ΔMSA and ΔFA) between the two groups.
For all tests, P < 0.05 was considered statistically significant, and P < 0.01 was considered highly significant.
Results
Magnetic Susceptibility Changes
Figure 1 shows an overview of the result: the CST was overlaid onto the standardized JHU-MNI-ss T1 template, with the spatial distribution of the P-values of Δχ differences between the high-responding and low-responding groups displayed to the right, as indicated by the color bar, and the levels of important anatomical landmarks marked on the template with their corresponding z-axis coordinates shown on the right. As demonstrated by the spatial distribution of P-values along the CST, the high-responding patients exhibit significantly more substantial susceptibility changes compared to the low responders, and the differences were mostly localized in the periventricular regions between the internal capsule and the centrum semiovale.
FIGURE 1:
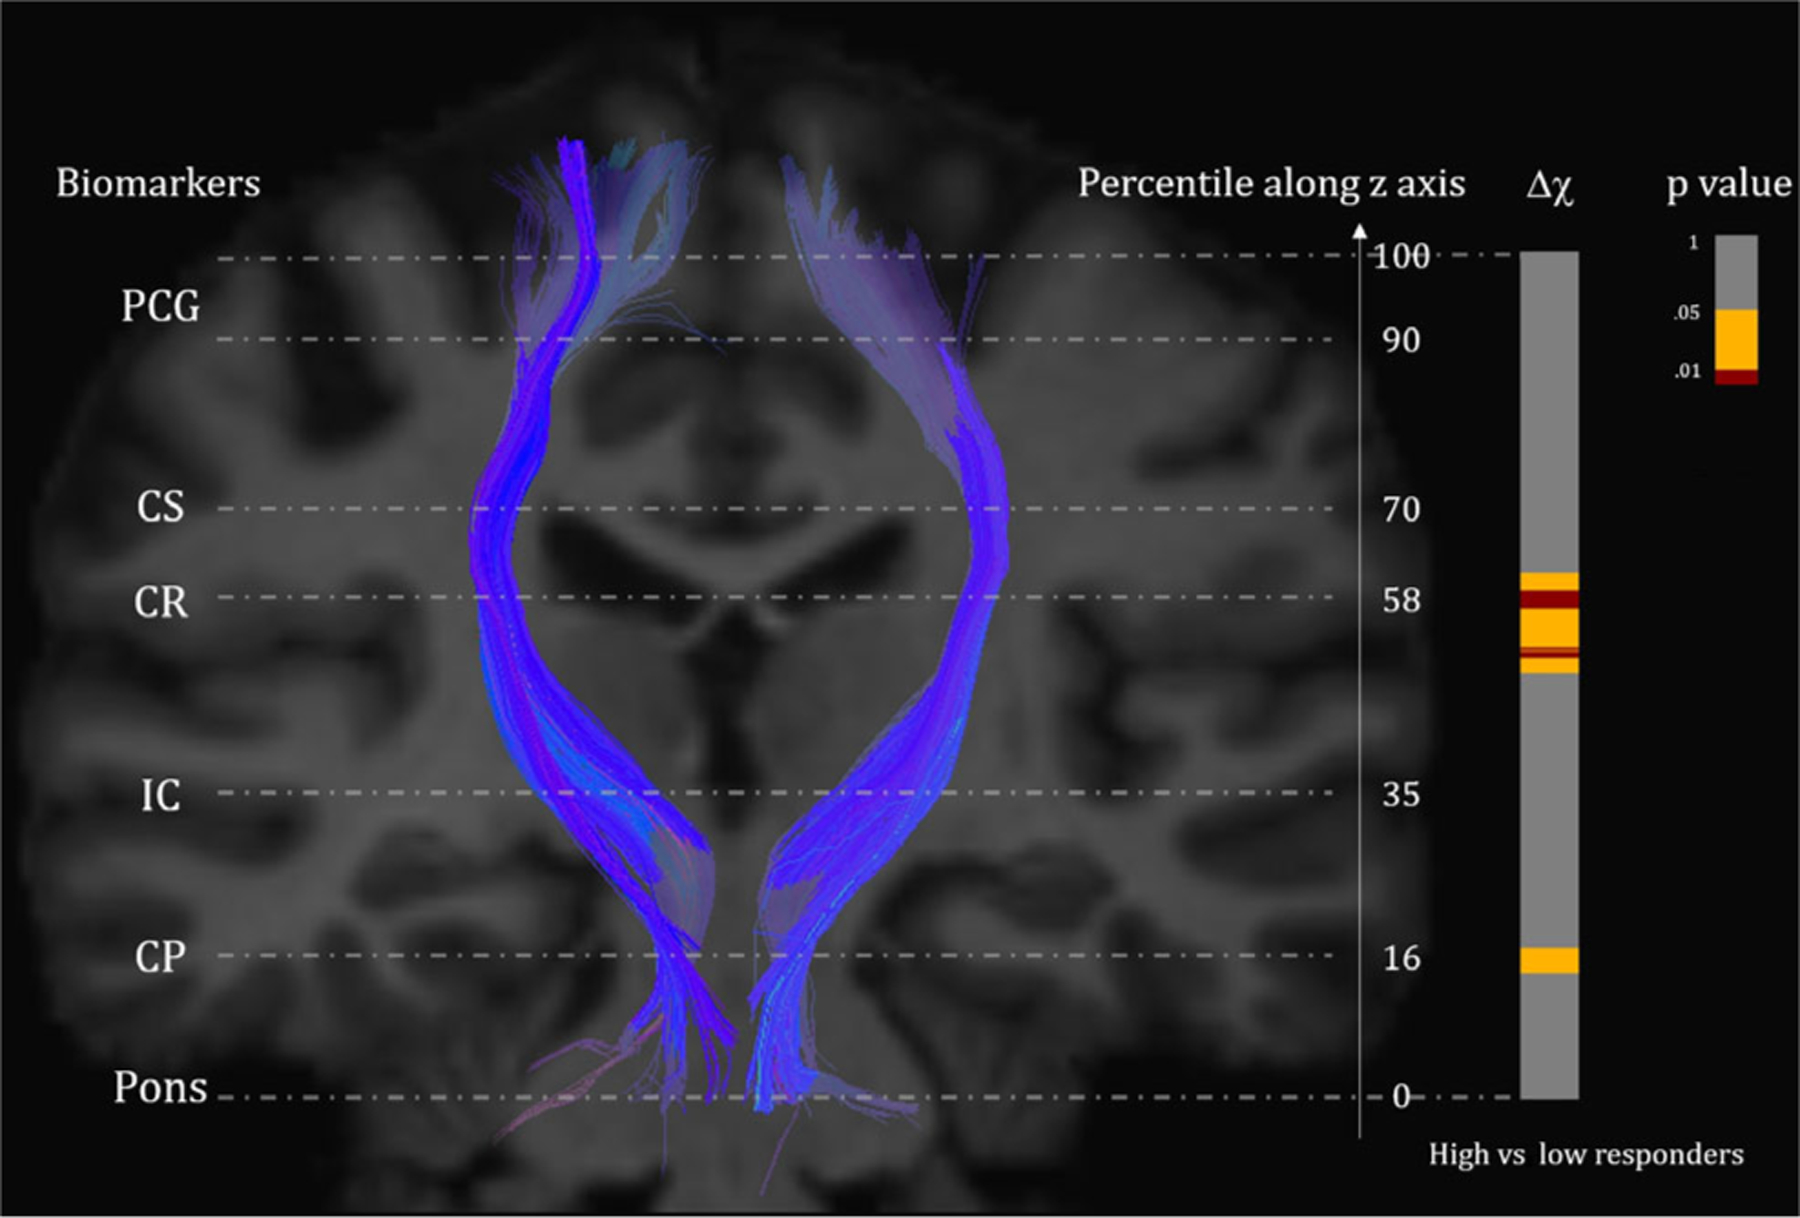
Segments exhibiting significant changes of magnetic susceptibility (Δχ) between high vs. low responders, indicated by projections along a CST on the JHU-MNI-ss T1 template with P-values on the right. Red color in the projection corresponds to highly significant regions with P < 0.01 between the groups, yellow corresponds to regions with 0.01 ≤ P < 0.05, and gray indicates insignificant segments. Important anatomical landmarks (CP = cerebral peduncle, IC = internal capsule, CR = corona radiata, CS = centrum semiovale) are shown on the left, with the corresponding normalized z-axis coordinates shown on the right.
Figure 2 shows the detailed group-averaged line profile of Δχ along the CST for both groups, with statistical significance of the difference overlaid onto the axis, as indicated by the color bar. Patients with more substantial motor function improvements exhibit more diamagnetic magnetic susceptibility changes at the periventricular regions of the CST (P = 0.003).
FIGURE 2:
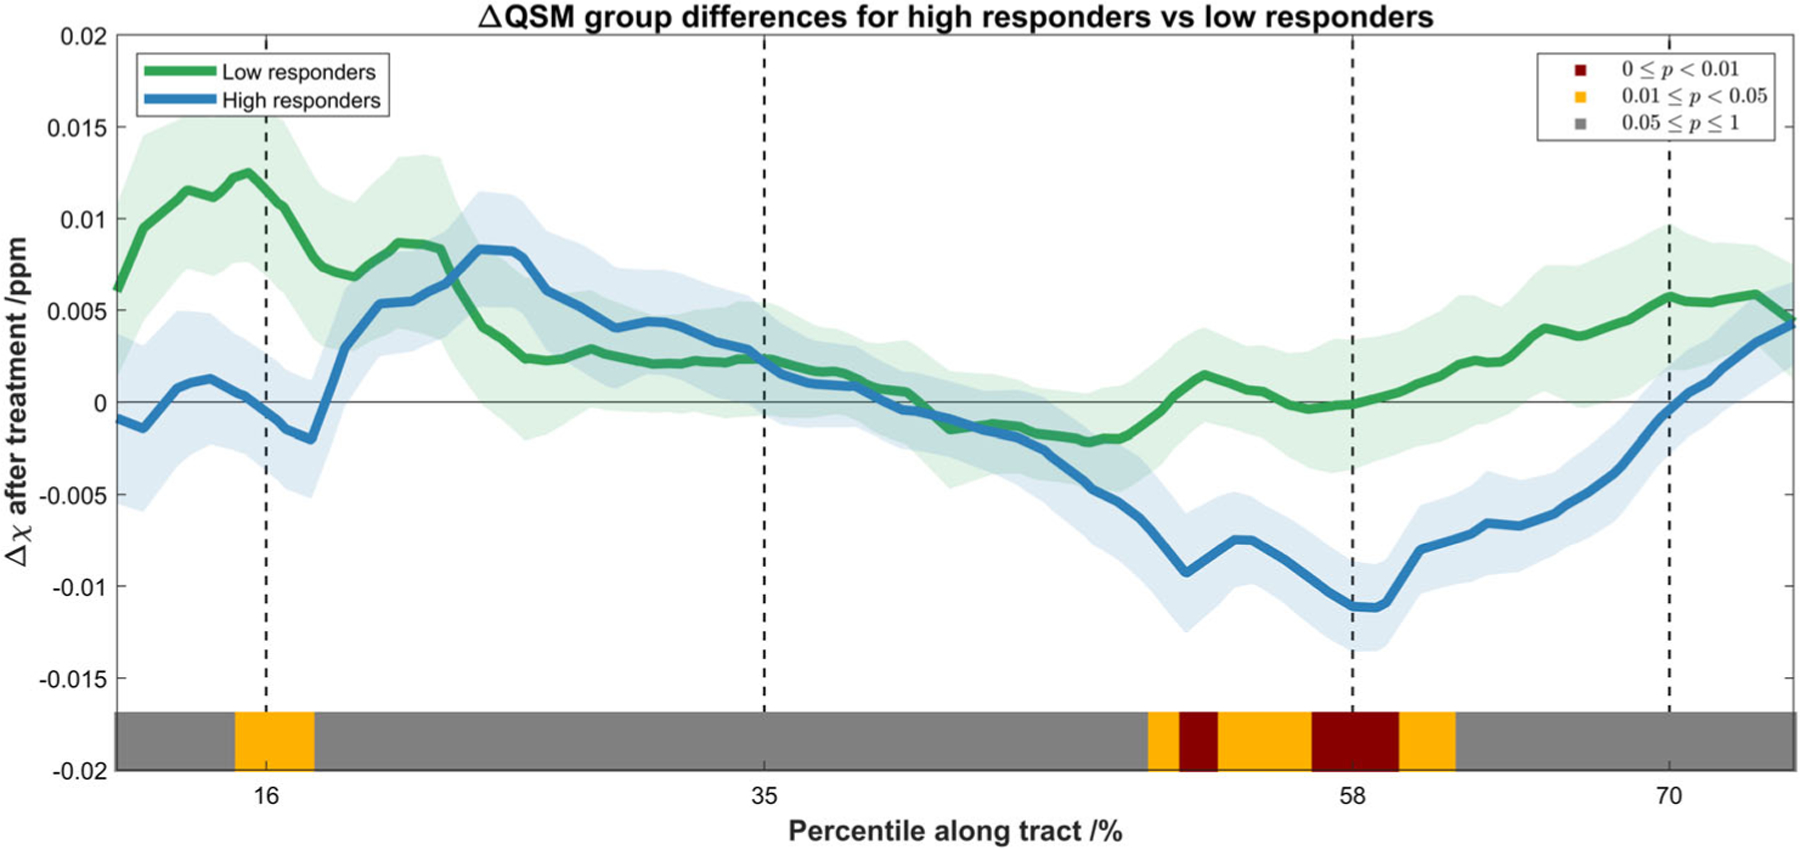
Spatial profile of the Δχ after the treatment along the CST for low responders (green) and high responders (blue), shown in mean ± standard error. The statistical significance of the difference between the two groups is indicated by the color bar (the same scheme as in Fig. 1). Subjects with more substantial motor function improvements exhibit more diamagnetic susceptibility change after treatment, and this significant difference was mostly located at the periventricular regions of the CST (from the internal capsule to the centrum semiovale).
MSA Changes After Removing Angle Dependence
Figure 3a shows the pre- and posttreatment magnetic susceptibility differences of the CST of a representative high-responding subject, (Fig. 3b) the angle dependence of the susceptibility values, and (Fig. 3c) the pre- and posttreatment T2-weighted images of the subject, with the difference image shown on the right illustrating the minimal signal changes in the CST. For Fig. 3b, the susceptibility values were fitted into 1° angle bins incrementing from 0° to 90°, where blue points correspond to the susceptibilities of patients pretreatment, and purple points correspond to those posttreatment. Angle bins with too few data points (fewer than 10) were ignored. Here, α is the angle between the WM fiber and the B0 field. Fiber pathways with angles between 45° and 65° exhibit the most apparent differences between the two groups, and these angles mostly correspond to the periventricular regions of the CST. The posttreatment MSA was determined to be −0.021 ± 0.002 (mean ± standard error, estimated with 95% confidence interval), which is distinctly more diamagnetic than the pretreatment MSA of −0.014 ± 0.001. Furthermore, the voxel-by-voxel paired t-test between the pre- and posttreatment macroscopic susceptibility values (χ) along the same region of CST was conducted for comparison, and the difference was not significant (P = 0.174).
FIGURE 3:
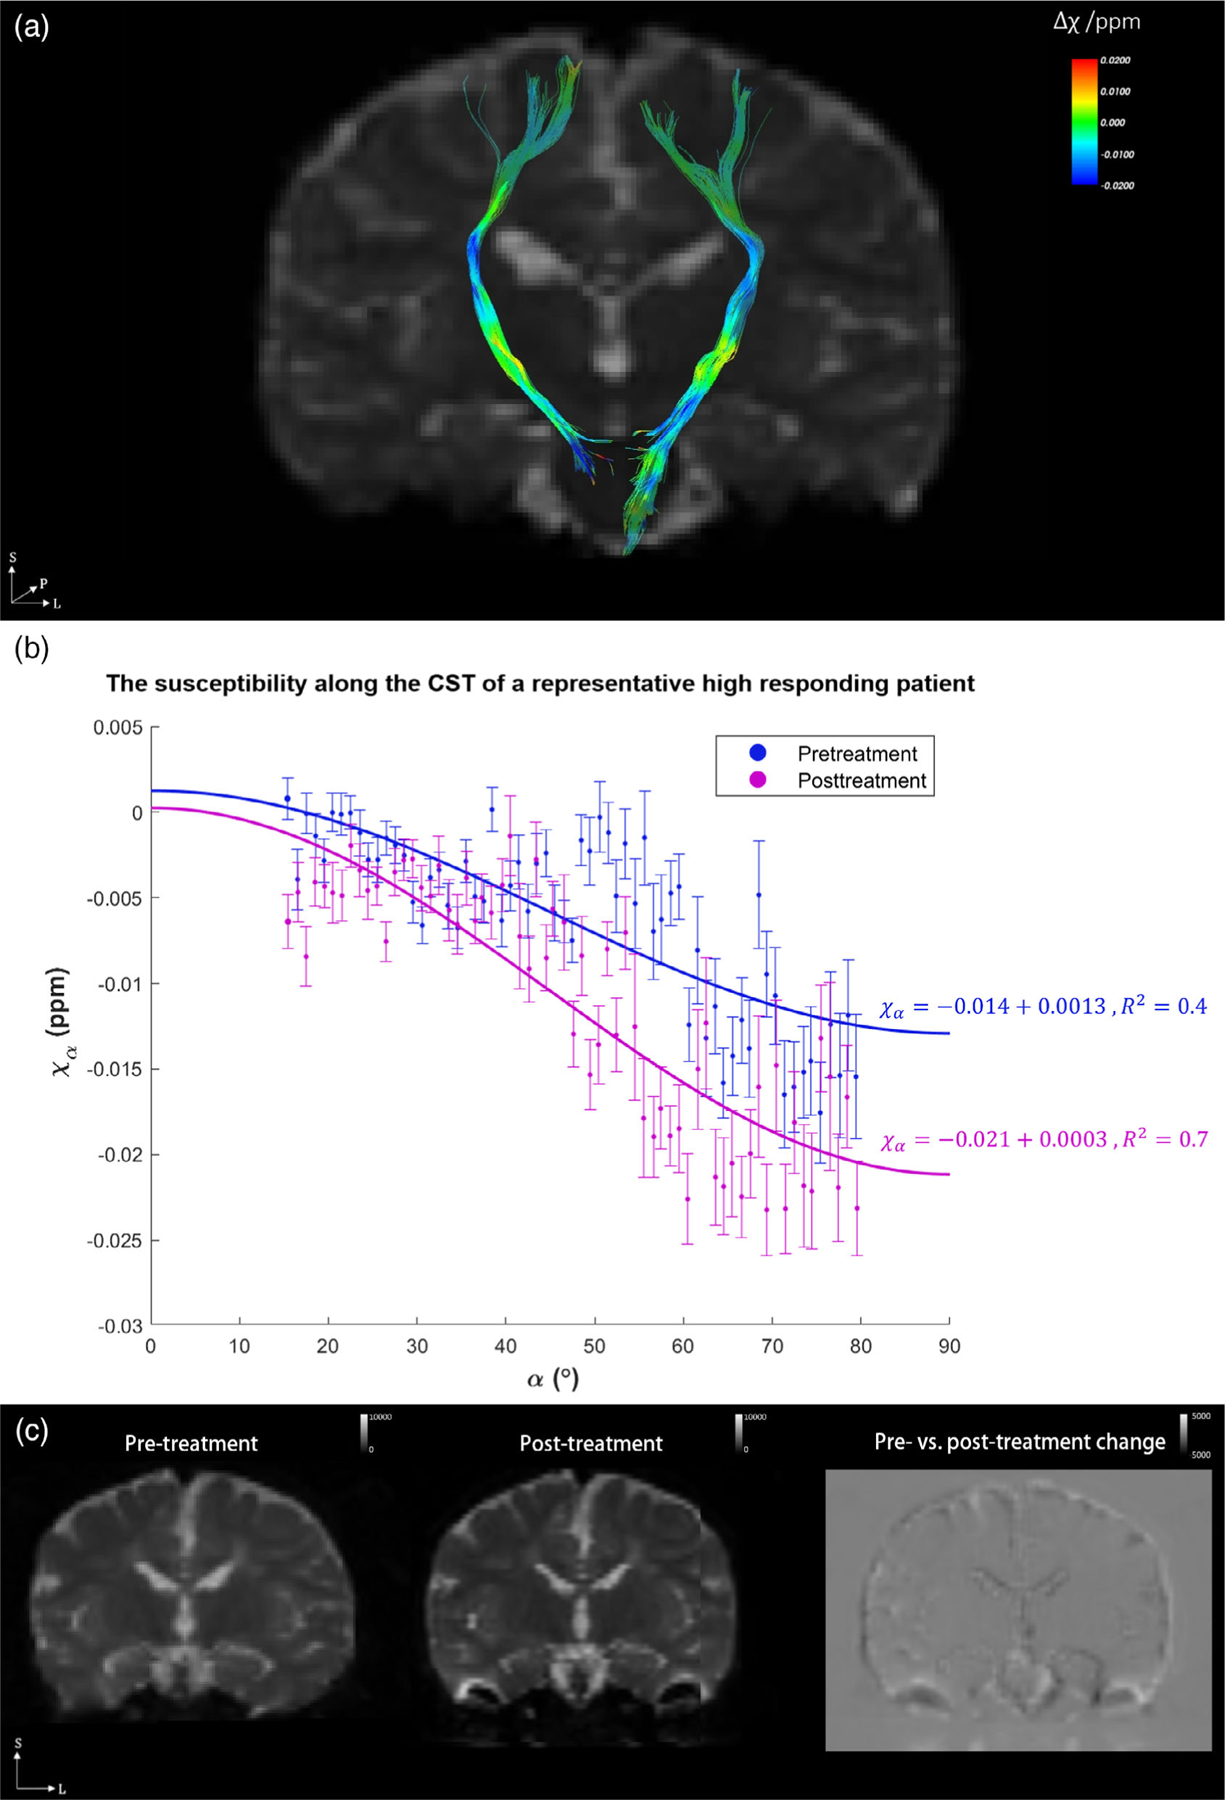
(a) The magnetic susceptibility change after treatment (Δχ) overlaid onto the CST of a representative high-responding subject; (b) the angle dependence of pre- and posttreatment magnetic susceptibility values along the CST; and (c) the pre- and posttreatment T2-weighted images of the subject, with the difference image shown on the right illustrating minimal changes in the CST. In (b), blue points correspond to the pretreatment magnetic susceptibilities of the subject, and purple points are those posttreatment. All data points are fitted into 1° angle increments, shown in mean ± standard error. The angles between the principle eigenvector of the diffusion tensor and the B0 field are shown in the horizontal axis; for example, 0° means that the fiber pathway is parallel to the main magnetic field. The fitted MSA values for pre- and posttreatment are −0.014 ± 0.001 and −0.021 ± 0.002 (mean ± standard error, estimated at 95% confidence interval), respectively. The ΔMSA for this high responding subject is −0.007 (more diamagnetic) after treatment.
Moreover, the group mean ΔMSA (± standard error) as well as the ΔMSA values of all subjects (black dots) were determined and plotted in Fig. 4 (the representative high-responding subject in Fig. 3 is also identified here). The average ΔMSA for the high responders and low responders were determined to be −0.011 ± 0.006 and 0.005 ppm, respectively. A two-sample t-test of the 0.005 group differences in ΔMSA between low- and high-responders was performed, demonstrating a significant increase in diamagnetism in MSA (P = 0.006).
FIGURE 4:
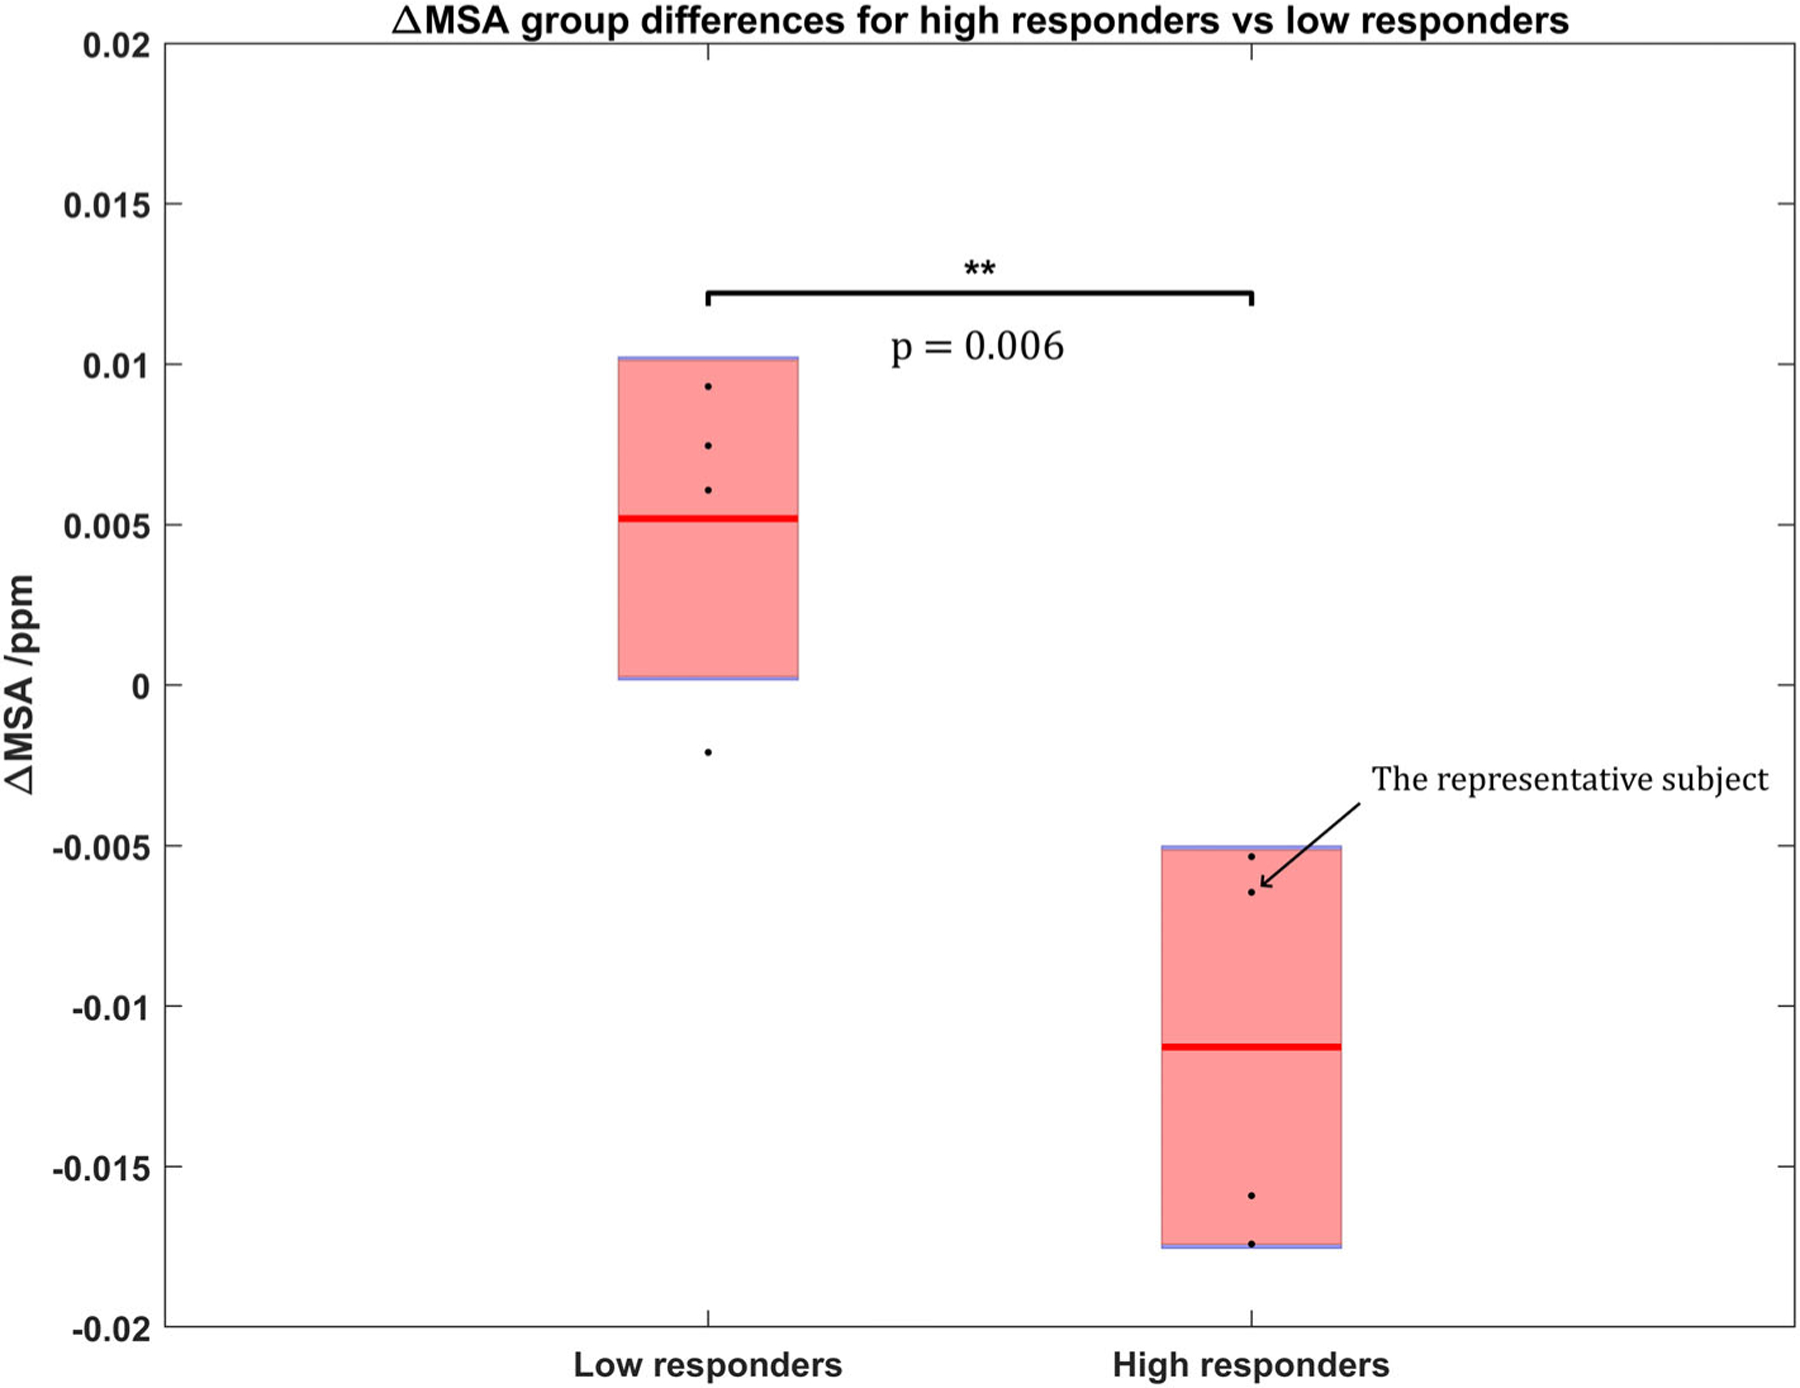
Group comparison of the ΔMSA after treatment between high and low responders. ΔMSA for each individual subject (black points), along with the group mean ΔMSA (red line) and the standard error (pink rectangle) are plotted. The MSA has turned significantly more diamagnetic (P = 0.006) for high-responding subjects compared to those exhibiting lower motor function improvements.
Diffusion FA Changes
In comparison to the susceptibility changes along the CST, t-tests were also performed among the posttreatment FA changes between the two groups in a similar scheme. Figure 5 shows the group-averaged line profile of ΔFA along the CST for both groups, with P-values of the differences overlaid onto the axis, as indicated by the color bar. While high responders did show more substantial FA increase posttreatment compared to low responders, the differences were more diffusely distributed along the CST (compared to the Δχ differences shown in Fig. 2), primarily from just beneath the corona radiata down to the internal capsule.
FIGURE 5:
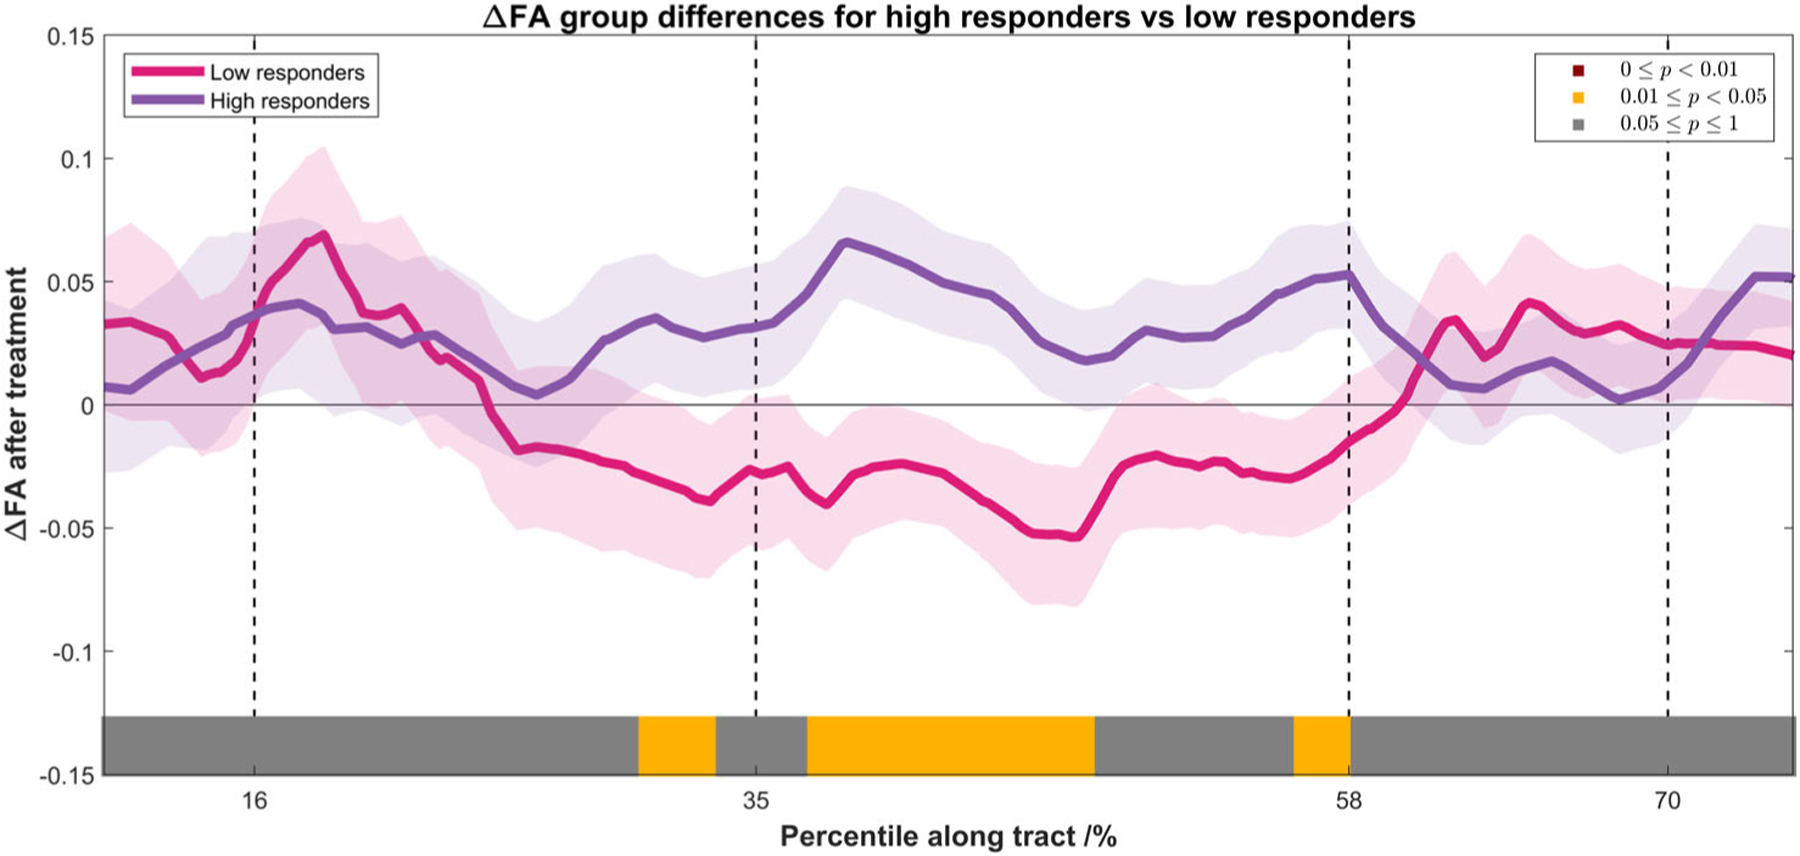
Spatial profile of the FA changes along the CST for low responders (pink) and high responders (purple), shown in mean ± standard error. The statistical significance of the difference between the two groups was indicated by the color bar (the same scheme as in Fig. 2). Subjects with more substantial motor function improvements showed increased FA after treatment, and the differences were diffusely distributed along the CST, primarily between the internal capsule and the corona radiata.
Discussion
Here we report an initial study demonstrating the use of DTI tractography-guided QSM to achieve rotationally-invariant measures of magnetic susceptibility without the need for physical head rotations, and to investigate and quantify changes in WM magnetic susceptibility and MSA in pediatric CP patients after autologous UCB stem-cell therapy.
It was found that the 1-year posttreatment motor function improvements were significantly associated with increased diamagnetism, and thus likely increased myelination12,29,30 in the periventricular regions of the CST. This significantly increased diamagnetism in high responders is consistent with our prior reports suggesting that increased myelination potentially contributed to the increase of motor connectivity and thus motor function.7,10 The line profile and the spatial distribution of the susceptibility differences between high- and low-responders, which were mostly localized in the periventricular region, indicates that regional myelination repair may be a potential neuronal mechanism for the increased brain connectivity concurrent with behavioral improvements. These findings are consistent with the fact that the CST is the primary conduit for the descending motor fibers, supporting an associative relationship between the observed increases in diamagnetism and enhanced functional motor outcomes beyond expectation following UCB cell infusion. It is worth noting that T2-weighted images before and after treatment did not exhibit significant changes in the CST, suggesting that DTI-guided QSM is a potentially more sensitive and quantitative technique to detect tissue-specific changes related to cell therapy,
Further investigation using the orientation-invariant measure in MSA provided improved quantitative accuracy and convergent evidence that the neuronal repair in the periventricular region may have contributed to the motor function improvement. MSA is typically negative for CST due to the diamagnetism of myelin; thus, a more negative MSA over time would likely indicate increased myelination28,31 after treatment. It is worth noting that the MSA estimated at a 95% confidence level did show a distinct difference; however, the direct voxel-by-voxel t-test between pre- and posttreatment macroscopic susceptibility values of this subject were not statistically different, suggesting that MSA is potentially an improved quantitative index for detecting susceptibility changes in WM tracts for individual subjects.
Compared to the significant diamagnetic focal change in magnetic susceptibility in the periventricular region of the CST, the spatial extent of the FA increase is more widespread, potentially reflecting the improved connectivity and water diffusivity throughout the CST as the result of focal myelin repair. However, it should be noted that FA measures can be influenced by a number of factors, such as partial volume effect, crossing fiber structures, and exact voxel placement, and as such they are not as tissue-specific as QSM measures.
Limitations
The number of patients included in this study was limited, primarily due to the availability of the high-resolution DTI and QSM protocol at the time of infusion, as well as the delineation of CSTs since CP patients often suffer from lesions that impair the fiber tracking and the accuracy of image registration.
It should be noted that the angles used in estimating MSA were derived from the DTI fiber tracking and may therefore be prone to error under ambiguous situations (eg, in the case of crossing fibers). However, fiber tracking within the CST has been shown to have high reliability.32 The error in fiber angle estimation in a single voxel is likely small, given the relatively homogeneous geometry of CST fibers in the periventricular region converging to the corona radiata and continuing downward to the internal capsule.
Another limitation in our study was that QSM techniques in general are sensitive to magnetic susceptibility changes due to other factors. For example, a reduction of neuroinflammation could potentially increase the diamagnetism in the CST as well.33–35 Further investigation combining other measures related to neuroinflammation will be needed to differentiate the origin of diamagnetic susceptibility changes.
Conclusion
In summary, our initial results provided additional insights and experimental evidence on the value of the tract-based QSM and its role in investigating potential myelination changes concurrent with increased brain connectivity. Thus, we believe that this new technique may be a useful tool to obtain quantitative and tissue-specific measures of myelination changes in the human brain. However, given the limitations in this initial study, further systematic investigation of the method is necessary.
REFERENCES
- 1.van Lieshout P, Candundo H, Martino R, Shin S, Barakat-Haddad C. Onset factors in cerebral palsy: A systematic review. Neurotoxicology 2017;61:47–53. [DOI] [PubMed] [Google Scholar]
- 2.Minear WL. A classification of cerebral palsy. Pediatrics 1956;18: 841–852. [PubMed] [Google Scholar]
- 3.Pakula AT, Braun KVN, Yeargin-Allsopp M. Cerebral palsy: Classification and epidemiology. Phys Med Rehabil Clin N Am 2009;20:425–452. [DOI] [PubMed] [Google Scholar]
- 4.Odding E, Roebroeck ME, Stam HJ. The epidemiology of cerebral palsy: Incidence, impairments and risk factors. Disabil Rehabil 2006;28: 183–191. [DOI] [PubMed] [Google Scholar]
- 5.Haynes RL, Folkerth RD, Keefe RJ, et al. Nitrosative and oxidative injury to premyelinating oligodendrocytes in periventricular leukomalacia. J Neuropathol Exp Neurol 2003;62:441–450. [DOI] [PubMed] [Google Scholar]
- 6.Rose S, Guzzetta A, Pannek K, Boyd R. MRI structural connectivity, disruption of primary sensorimotor pathways, and hand function in cerebral palsy. Brain Connect 2011;1:309–316. [DOI] [PubMed] [Google Scholar]
- 7.Englander ZA, Pizoli CE, Batrachenko A, et al. Diffuse reduction of white matter connectivity in cerebral palsy with specific vulnerability of long range fiber tracts. Neuroimage Clin 2013;2:440–447. [DOI] [PMC free article] [PubMed] [Google Scholar]
- 8.Sun JM, Grant GA, McLaughlin C, et al. Repeated autologous umbilical cord blood infusions are feasible and had no acute safety issues in young babies with congenital hydrocephalus. Pediatr Res 2015;78: 712–716. [DOI] [PubMed] [Google Scholar]
- 9.Sun JM, Song AW, Case LE, et al. Effect of autologous cord blood infusion on motor function and brain connectivity in young children with cerebral palsy: A randomized, placebo-controlled trial. Stem Cells Transl Med 2017;6:2071–2078. [DOI] [PMC free article] [PubMed] [Google Scholar]
- 10.Englander ZA, Sun J, Case L, Mikati MA, Kurtzberg J, Song AW. Brain structural connectivity increases concurrent with functional improvement: Evidence from diffusion tensor MRI in children with cerebral palsy during therapy. Neuroimage Clin 2015;7:315–324. [DOI] [PMC free article] [PubMed] [Google Scholar]
- 11.Wang Y, Liu T. Quantitative susceptibility mapping (QSM): Decoding MRI data for a tissue magnetic biomarker. Magn Reson Med 2015;73: 82–101. [DOI] [PMC free article] [PubMed] [Google Scholar]
- 12.Liu C, Li W, Johnson GA, Wu B. High-field (9.4T) MRI of brain dysmyelination by quantitative mapping of magnetic susceptibility. Neuroimage 2011;56:930–938. [DOI] [PMC free article] [PubMed] [Google Scholar]
- 13.Liu C. Susceptibility tensor imaging. Magn Reson Med 2010;63:1471–1477. [DOI] [PMC free article] [PubMed] [Google Scholar]
- 14.Liu T, Spincemaille P, de Rochefort L, Kressler B, Wang Y. Calculation of susceptibility through multiple orientation sampling (COSMOS): A method for conditioning the inverse problem from measured magnetic field map to susceptibility source image in MRI. Magn Reson Med 2009;61:196–204. [DOI] [PubMed] [Google Scholar]
- 15.Weis R. Gross motor function measure (GMFM-66 and GMFM-88) user’s manual. Eur J Paediatr Neurol 2004;8:111–112. [Google Scholar]
- 16.Rosenbaum PL, Walter SD, Hanna SE, et al. Prognosis for gross motor function in cerebral palsy. JAMA 2002;288:1357–1363. [DOI] [PubMed] [Google Scholar]
- 17.Oguz I, Farzinfar M, Matsui J, et al. DTIPrep: Quality control of diffusion-weighted images. Front Neuroinform 2014;8:4. [DOI] [PMC free article] [PubMed] [Google Scholar]
- 18.Veraart J, Fieremans E, Novikov DS. Diffusion MRI noise mapping using random matrix theory. Magn Reson Med 2016;76:1582–1593. [DOI] [PMC free article] [PubMed] [Google Scholar]
- 19.Wang R, Benner T, Sorensen AG, Wedeen VJ. Diffusion toolkit: A software package for diffusion imaging data processing and tractography. Proc Intl Soc Mag Reson Med 2007;15:3720. [Google Scholar]
- 20.Oishi K, Faria A, Jiang H, et al. Atlas-based whole brain white matter analysis using large deformation diffeomorphic metric mapping: Application to normal elderly and Alzheimer’s disease participants. Neuroimage 2009;46:486–499. [DOI] [PMC free article] [PubMed] [Google Scholar]
- 21.Faria AV, Hoon A, Stashinko E, et al. Quantitative analysis of brain pathology based on MRI and brain atlases—Applications for cerebral palsy. Neuroimage 2011;54:1854–1861. [DOI] [PMC free article] [PubMed] [Google Scholar]
- 22.Smith SM. Fast robust automated brain extraction. Hum Brain Mapp 2002;17:143–155. [DOI] [PMC free article] [PubMed] [Google Scholar]
- 23.Schweser F, Deistung A, Lehr BW, Reichenbach JR. Quantitative imaging of intrinsic magnetic tissue properties using MRI signal phase: An approach to in vivo brain iron metabolism? Neuroimage 2011;54:2789–2807. [DOI] [PubMed] [Google Scholar]
- 24.Li W, Wu B, Liu C. Quantitative susceptibility mapping of human brain reflects spatial variation in tissue composition. Neuroimage 2011;55: 1645–1656. [DOI] [PMC free article] [PubMed] [Google Scholar]
- 25.Li W, Wang N, Yu F, et al. A method for estimating and removing streaking artifacts in quantitative susceptibility mapping. Neuroimage 2015;108:111–122. [DOI] [PMC free article] [PubMed] [Google Scholar]
- 26.Wei H, Dibb R, Zhou Y, et al. Streaking artifact reduction for quantitative susceptibility mapping of sources with large dynamic range. NMR Biomed 2015;28:1294–1303. [DOI] [PMC free article] [PubMed] [Google Scholar]
- 27.Li W, Wu B, Avram AV, Liu C. Magnetic susceptibility anisotropy of human brain in vivo and its molecular underpinnings. Neuroimage 2012;59:2088–2097. [DOI] [PMC free article] [PubMed] [Google Scholar]
- 28.Li X, Vikram DS, Lim IAL, Jones CK, Farrell JAD, van Zijl PCM. Mapping magnetic susceptibility anisotropies of white matter in vivo in the human brain at 7T. Neuroimage 2012;62:314–330. [DOI] [PMC free article] [PubMed] [Google Scholar]
- 29.Deh K, Ponath GD, Molvi Z, et al. Magnetic susceptibility increases as diamagnetic molecules breakdown: Myelin digestion during multiple sclerosis lesion formation contributes to increase on QSM. J Magn Reson Imaging 2018;48:1281–1287. [DOI] [PMC free article] [PubMed] [Google Scholar]
- 30.Lee J, Shmueli K, Kang B-T, et al. The contribution of myelin to magnetic susceptibility-weighted contrasts in high-field MRI of the brain. Neuroimage 2012;59:3967–3975. [DOI] [PMC free article] [PubMed] [Google Scholar]
- 31.Argyridis I, Li W, Johnson GA, Liu C. Quantitative magnetic susceptibility of the developing mouse brain reveals microstructural changes in the white matter. Neuroimage 2014;88:134–142. [DOI] [PMC free article] [PubMed] [Google Scholar]
- 32.Danielian LE, Iwata NK, Thomasson DM, Floeter MK. Reliability of fiber tracking measurements in diffusion tensor imaging for longitudinal study. Neuroimage 2010;49:1572–1580. [DOI] [PMC free article] [PubMed] [Google Scholar]
- 33.Jalal FY, Yang Y, Thompson J, Lopez AC, Rosenberg GA. Myelin loss associated with neuroinflammation in hypertensive rats. Stroke 2012; 43:1115–1122. [DOI] [PMC free article] [PubMed] [Google Scholar]
- 34.Chari DM, Zhao C, Kotter MR, Blakemore WF, Franklin RJM. Corticosteroids delay remyelination of experimental demyelination in the rodent central nervous system. J Neurosci Res 2006;83:594–605. [DOI] [PubMed] [Google Scholar]
- 35.Li W-W, Setzu A, Zhao C, Franklin RJM. Minocycline-mediated inhibition of microglia activation impairs oligodendrocyte progenitor cell responses and remyelination in a non-immune model of demyelination. J Neuroimmunol 2005;158:58–66. [DOI] [PubMed] [Google Scholar]


