

Summary
Tissue-specific DNA methylation patterns at enhancers help to demarcate cellular identity. These DNA methylation patterns are created by transcription factors that recruit methylation and demethylation enzymes to cis-regulatory elements. To date, it is not known whether transcription factors are needed to continuously maintain methylation profiles in mature tissues or whether they solely establish these marks during organ development. We queried the role of the pioneer factor FoxA in generating hypomethylated DNA at liver enhancers. We discovered a set of FoxA binding sites that undergo regional FoxA-dependent demethylation during organ development. Importantly, continued FoxA presence was not required to maintain the hypomethylated state, even when massive cell proliferation was induced. This study provides strong evidence for the stable nature of tissue-specific DNA methylation patterns and suggests that this stability can enable enhancer reactivation under extreme conditions when transcription factors are temporarily misexpressed.
Keywords: DNA methylation, FoxA, tissue differentiation, enhancer activity, liver
Introduction
Cellular identity is defined by specific gene expression profiles controlled by cis-regulatory networks which are specified by thousands of cell type-specific enhancers. Lineage-specific transcription factors initiate enhancer activation at tissue-specific loci during development through the recruitment of chromatin modifying enzymes that acetylate and methylate histones, reposition nucleosomes, and demethylate DNA (Boller et al., 2016; Cheung et al., 2000; Li et al., 2012; Mayran et al., 2018; Zhu et al., 2016). To date, it is not clear whether transcription factors are constantly required to maintain the low DNA methylation state characteristic of tissue-specific enhancers or whether this enhancer mark is inherently stable, once established. DNA methylation is thought to be the most stable epigenetic mark because it is a covalent change of the DNA itself, and because its active removal requires a multistep enzymatic process which ends up in base excision repair or passive methylation dilution through DNA replication (Dor and Cedar, 2018; Pastor et al., 2013). Therefore, we set out to determine the reliance of tissue-specific DNA methylation patterns on lineage-determining transcription factors.
The pioneer factor model suggests that specialized transcription factors are capable of binding to closed chromatin and initiate gene activation (Iwafuchi-Doi and Zaret, 2016; Li et al., 2012). The FoxA winged helix proteins, previously defined as paradigm pioneer factors, were shown to be essential for the induction of the liver primordium from foregut endoderm (Lee et al., 2005) and have the capacity to bind closed chromatin and methylated DNA and to make it accessible to other transcription factors (Iwafuchi-Doi et al., 2016; Li et al., 2012). Recently, it was shown that ectopic expression of FoxA2 causes local demethylation at its binding sites, but that removal of FoxA2 following its ectopic expression led to passive, cell-cycle dependent demethylation of DNA (Donaghey et al., 2018). This in vitro study demonstrated that FoxA proteins have the capacity to cause demethylation of DNA at relevant enhancers and argued for reliance on continuous transcription factor binding. Here, we examined the requirement of continuous transcription factor binding to the maintenance of tissue-specific hypomethylated enhancers in vivo. We identified a set of hepatocyte-specific FoxA binding sites that undergo regional FoxA-dependent demethylation during liver development. Importantly, and unlike the cell culture studies (Donaghey et al., 2018), continued FoxA expression was not necessary to maintain enhancer hypomethylation, even when proliferation was induced. Moreover, even at loci where FoxA proteins are required continuously to maintain histone marks characteristic of gene activation, they were dispensable for maintaining the hypomethylated state. Thus, tissue-specific methylation initiated by lineage specific, pioneer transcription factors during organ development is not dependent on the continued presence of the factors and suggests that lineage-specific DNA methylation patterns is a dominant feature to ascertain the stability of cellular identities.
Results
FoxA proteins mediate demethylation during liver development
In order to evaluate the relationship between FoxA occupancy and DNA methylation status, we determined DNA methylation levels at FoxA binding sites in the adult mouse liver. We took advantage of the existing FoxA2 liver cistrome generated by lambda exonuclease digestion followed by sequencing (ChIP-exo-seq, (Iwafuchi-Doi et al., 2016)). Using whole genome bisulfite sequencing (WGBS), we found that the vast majority of FoxA2 binding sites are located in regions with low DNA methylation levels within 200 bp of the binding sites (Figure 1A). In addition, these binding sites are enriched for histone modifications associated with active genes (H3K27ac; Figure S1A). Most of them are also marked by the enhancer mark H3K4me1 (Figure S1A). Thus, in the adult liver, FoxA2 binding is frequently associated with unmethylated and active distal regulatory regions, i.e. putative enhancers.
Figure 1. FoxA proteins are required for developmental DNA demethylation in the liver.
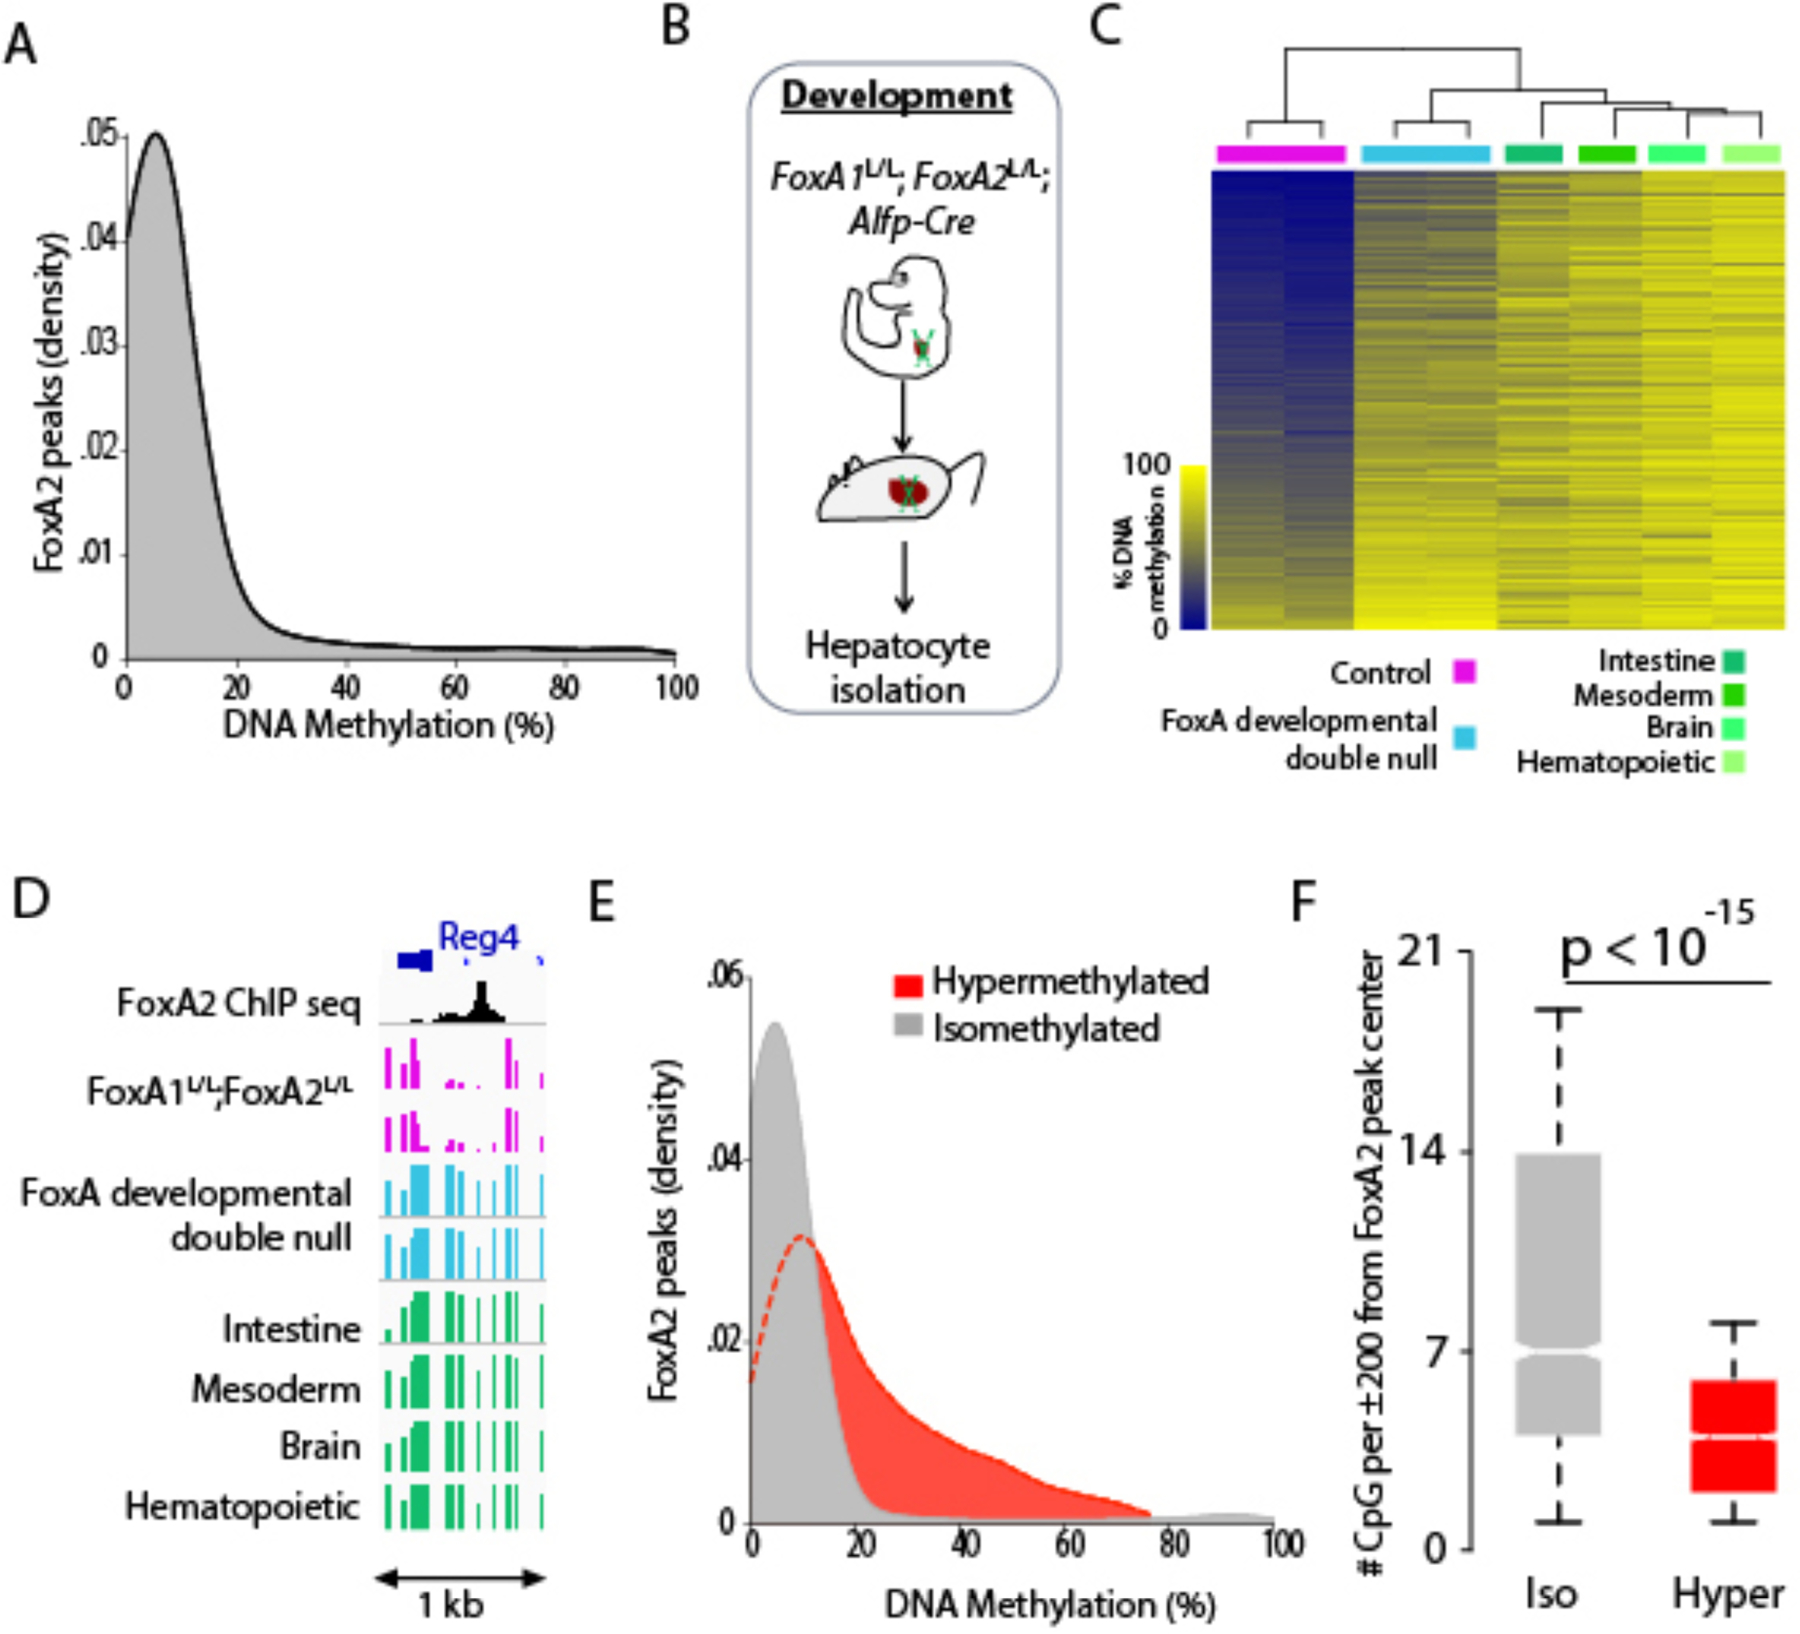
A. Density plot of DNA methylation levels of FoxA2 binding sites (±200 bp from peak center). B. Animal model for FoxA1 and FoxA2 depletion in the developing liver. C. Heatmap and unbiased hierarchal clustering of hepatocytes developmentally depleted for FoxA1 and FoxA2 as well as methylation levels in additional tissues, for the 2,705 FoxA2 peak regions differentially methylated in the FoxA1/2 developmental mutants compared with controls (±200 bp from the FoxA2 peak center). D. Example of one of the 2,705 FoxA2 peaks described in C. E. Density plot of DNA methylation distribution of sites that had not changed in the FoxA1/2 mutant (isomethylated - grey) versus regions that became hypermethylated in the mutant (hypermethyated - red). Presented are methylation levels in wild type liver (±200 bp from the FoxA2 peak center). F. Box plots of CpG methylation density in 2,705 hypermethylated sites versus 3,071 randomly sampled isomethylated sites (p<10−15 Mann-Whitney-Wilcoxon Test).
Next, we examined whether FoxA proteins mediate developmental demethylation at these sites. The FoxA gene family is comprised of three members, FoxA1, FoxA2 and FoxA3, and ablation of FoxA1 and FoxA2 during endoderm differentiation results in embryonic lethality (Lee et al., 2005). However, when the two genes are ablated after liver specification in the hepatoblast stage in FoxA1L/L; FoxA2L/L; Alfp-Cre mice, the liver forms and viable mice are obtained, which we employed here and termed `FoxA developmental double null` mice for convenience, (Li et al., 2009; Zhang et al., 2005) (Figure 1B and S1B). We performed whole genome bisulfite sequencing on adult hepatocytes isolated from these mice and age-matched controls (FoxA1L/L; FoxA2L/L) and identified 2,705 FoxA binding sites that exhibited high levels of DNA methylation in the FoxA1/A2 deficient liver compared with controls (methylation difference > 20%, Figure. 1C–D, S1C and STAR Methods, per treatment n=2). Interestingly, in the absence of the FoxA factors, these 2,705 hypermethylated sites exhibited methylation levels similar to those found in other tissues (Figure 1C, 1D). In addition, most of these FoxA binding are methylated in newborn hepatocytes, in accordance with our previous study that showed that most tissue-specific demethylation events occur postnatally (Figure S2A–D, (Reizel et al., 2018)). Thus, FoxA proteins mediate DNA demethylation during liver development at these sites.
Many FoxA2 binding sites displayed unchanged DNA methylation levels in our FoxA developmental double null mice and were thus termed ‘isomethylated’. The possible reason for lack of an effect of FoxA1/2 depletion on methylation levels at these sites could be the result of partial compensation by FoxA3 (see below), or the possibility that FoxA1/2 mediated demethylation at these sites happened before Cre activation occurred in our model. Default methylation levels at FoxA2 binding sites in which demethylation was reduced in the FoxA1/2 deficient liver (termed ‘hypermethylated’) were much higher compared with methylation levels in regions that retained their proper methylation status (termed ‘isomethylated’) (Figure 1E) because a large fraction of isomethylated sites were at proximal promoters. Strikingly, we found that the CpG density at the isomethylated sites is significantly higher compared to the sites where DNA demethylation is FoxA1/2 dependent (Figure 1F, p<10−15 Mann-Whitney-Wilcoxon Test) and that ‘isomethylated’ sites were five times as likely to overlap with proximal promoters than ‘hypermethylated’ sites consistent with previous findings that promoter-proximal regions are likely to be demethylated regardless of cell type or age {Aran, 2013 #25; Avrahami, 2015 #26}.
FoxA factors mediate a regional change in DNA methylation
Combining the FoxA2 cistrome with our whole genome DNA methylation data enabled us to analyze methylation levels at narrowly defined FoxA2 binding sites (± 10 bp from the peak center), as well as in larger areas surrounding these sites in mice deficient for FoxA1/2 during development (`hypermethylated sites`). Interestingly, similar proportions of hypermethylated sites were found in regions extending ±10, ±50 or ±200 bp from the peak center, suggesting that the effect of FoxA on DNA methylation is not confined to its binding site but extends regionally (Figure 2A–B). Only when we extended the analysis window to ±800 bp from FoxA2 binding sites did we observe a decrease in the fraction of hypermethylated CpGs (Figure 2A). To test if clustering of multiple FoxA binding sites could explain the regional spread of DNA demethylation that occurs during liver development, we determined the number of FoxA2 sites present in a 1,600 bp (±800 bp from the FoxA2 peak) and found that ~80% of both iso- and hypermethylated regions contained only one or two binding events (Figure 2C). Lastly, we found that the vast majority of FoxA binding sites that are hypermethylated in the FoxA1/2 deficient liver at the actual binding sites (±10 bp from peak center) are also hypermethylated in the ±50 and ±200 bp windows, demonstrating that the impact of FoxA on DNA methylation is almost never narrowly restricted to the actual binding sites (Figure 2D). Overall, this analysis demonstrates that FoxA binding to only one or a few specific sites is required for regional enhancer demethylation during liver development. These findings in liver development contrast with what was observed during ectopic expression of FoxA2 in a fibroblast cell line (Donaghey et al., 2018), where only the underlying CpG sites, where FoxA2 targeted, became methylated.
Figure 2. FoxA mediates regional, not local DNA demethylation.
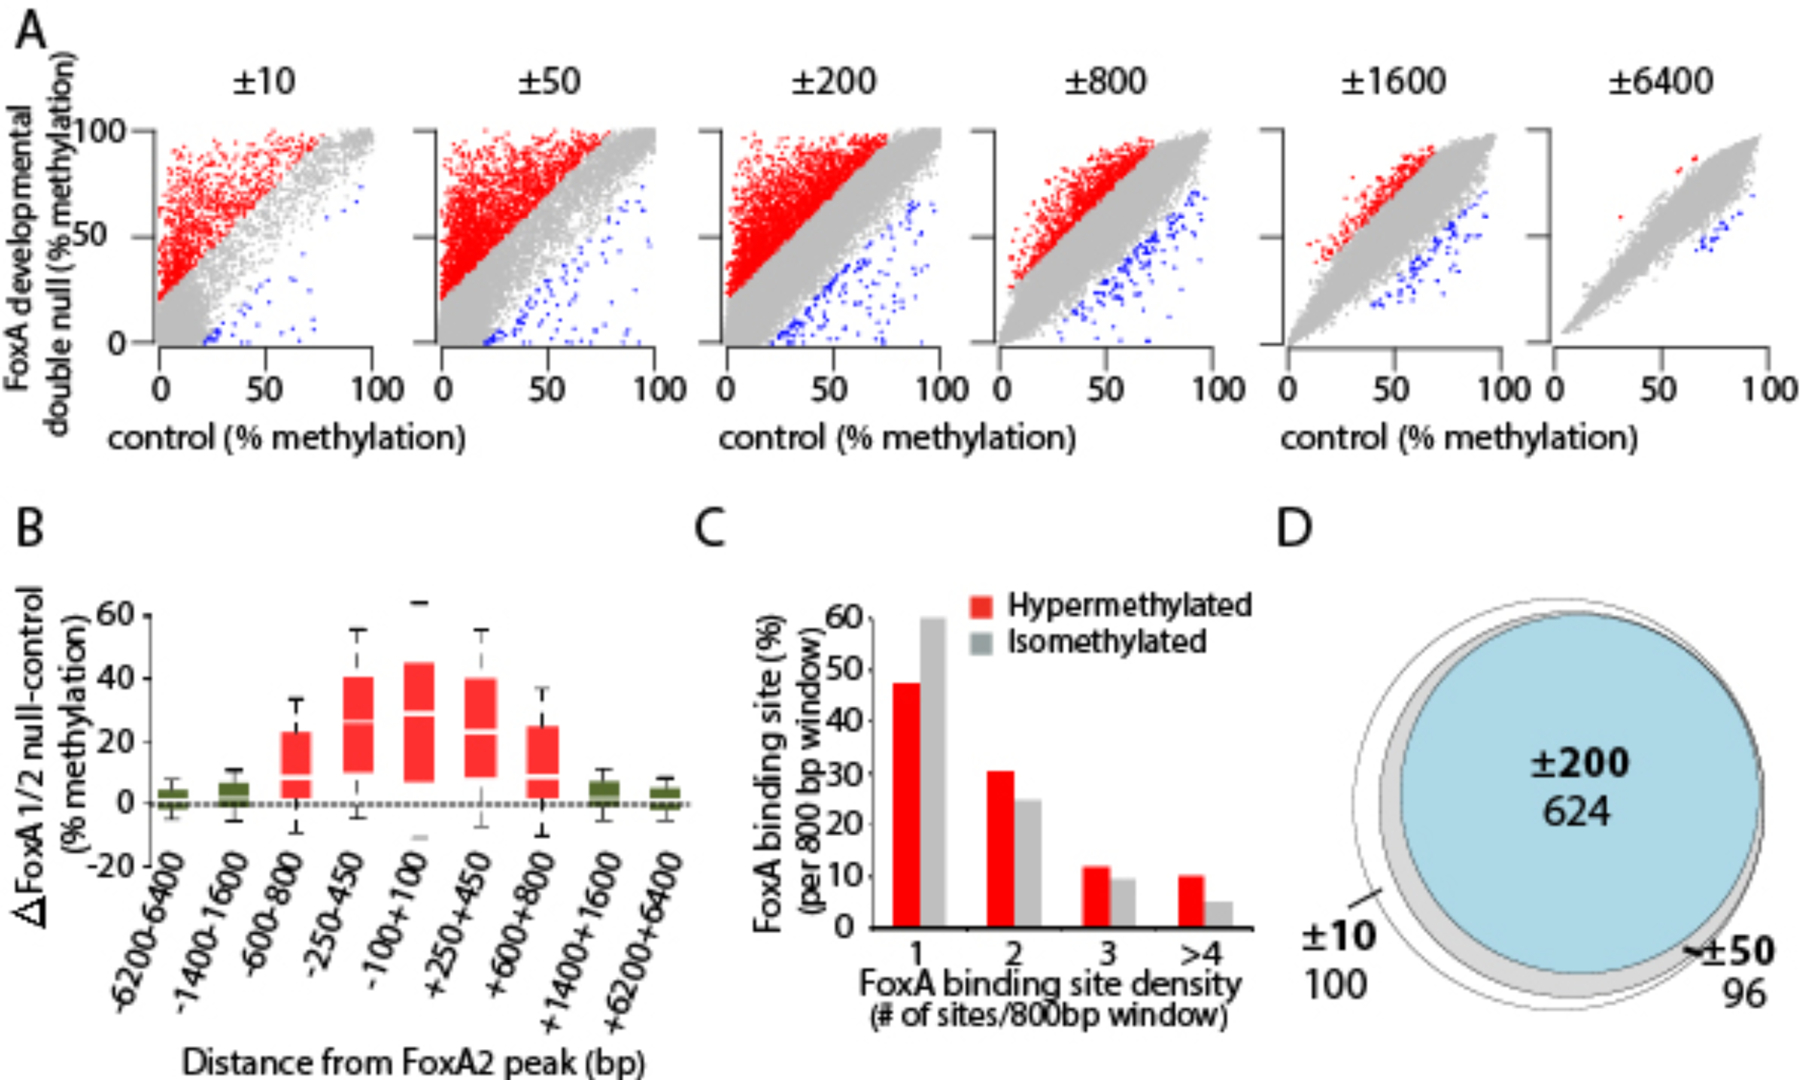
A. Scatter plots of DNA methylation levels at FoxA2 binding sites at different distances from the FoxA2 peak center in FoxA1/2 developmental mutants, compared with controls. Hyper-, iso-, and hypomethylated regions in the mutant are marked in red, grey and blue, respectively. B. Box plots showing DNA methylation levels in FoxA1/2 developmental null livers vs controls at different segments of FoxA hypermethylated sites in ±800 window from the peak center. C. Bar charts measuring the percentage and number of juxtaposed FoxA sites in isomethylated and hypermethylated regions in the ±800 window. D. Venn diagram depicting the 820 FoxA2 sites that remain hypermethylated in the FoxA1/2-developmetal deficient liver at the actual binding site (±10 from peak center) and beyond (±50 and ±200 window), demonstrating high overlap between hypermethylation at the actual binding sites and extended windows.
Loss of FoxA-mediated DNA demethylation is associated with reduced enhancer activity and aberrant gene expression
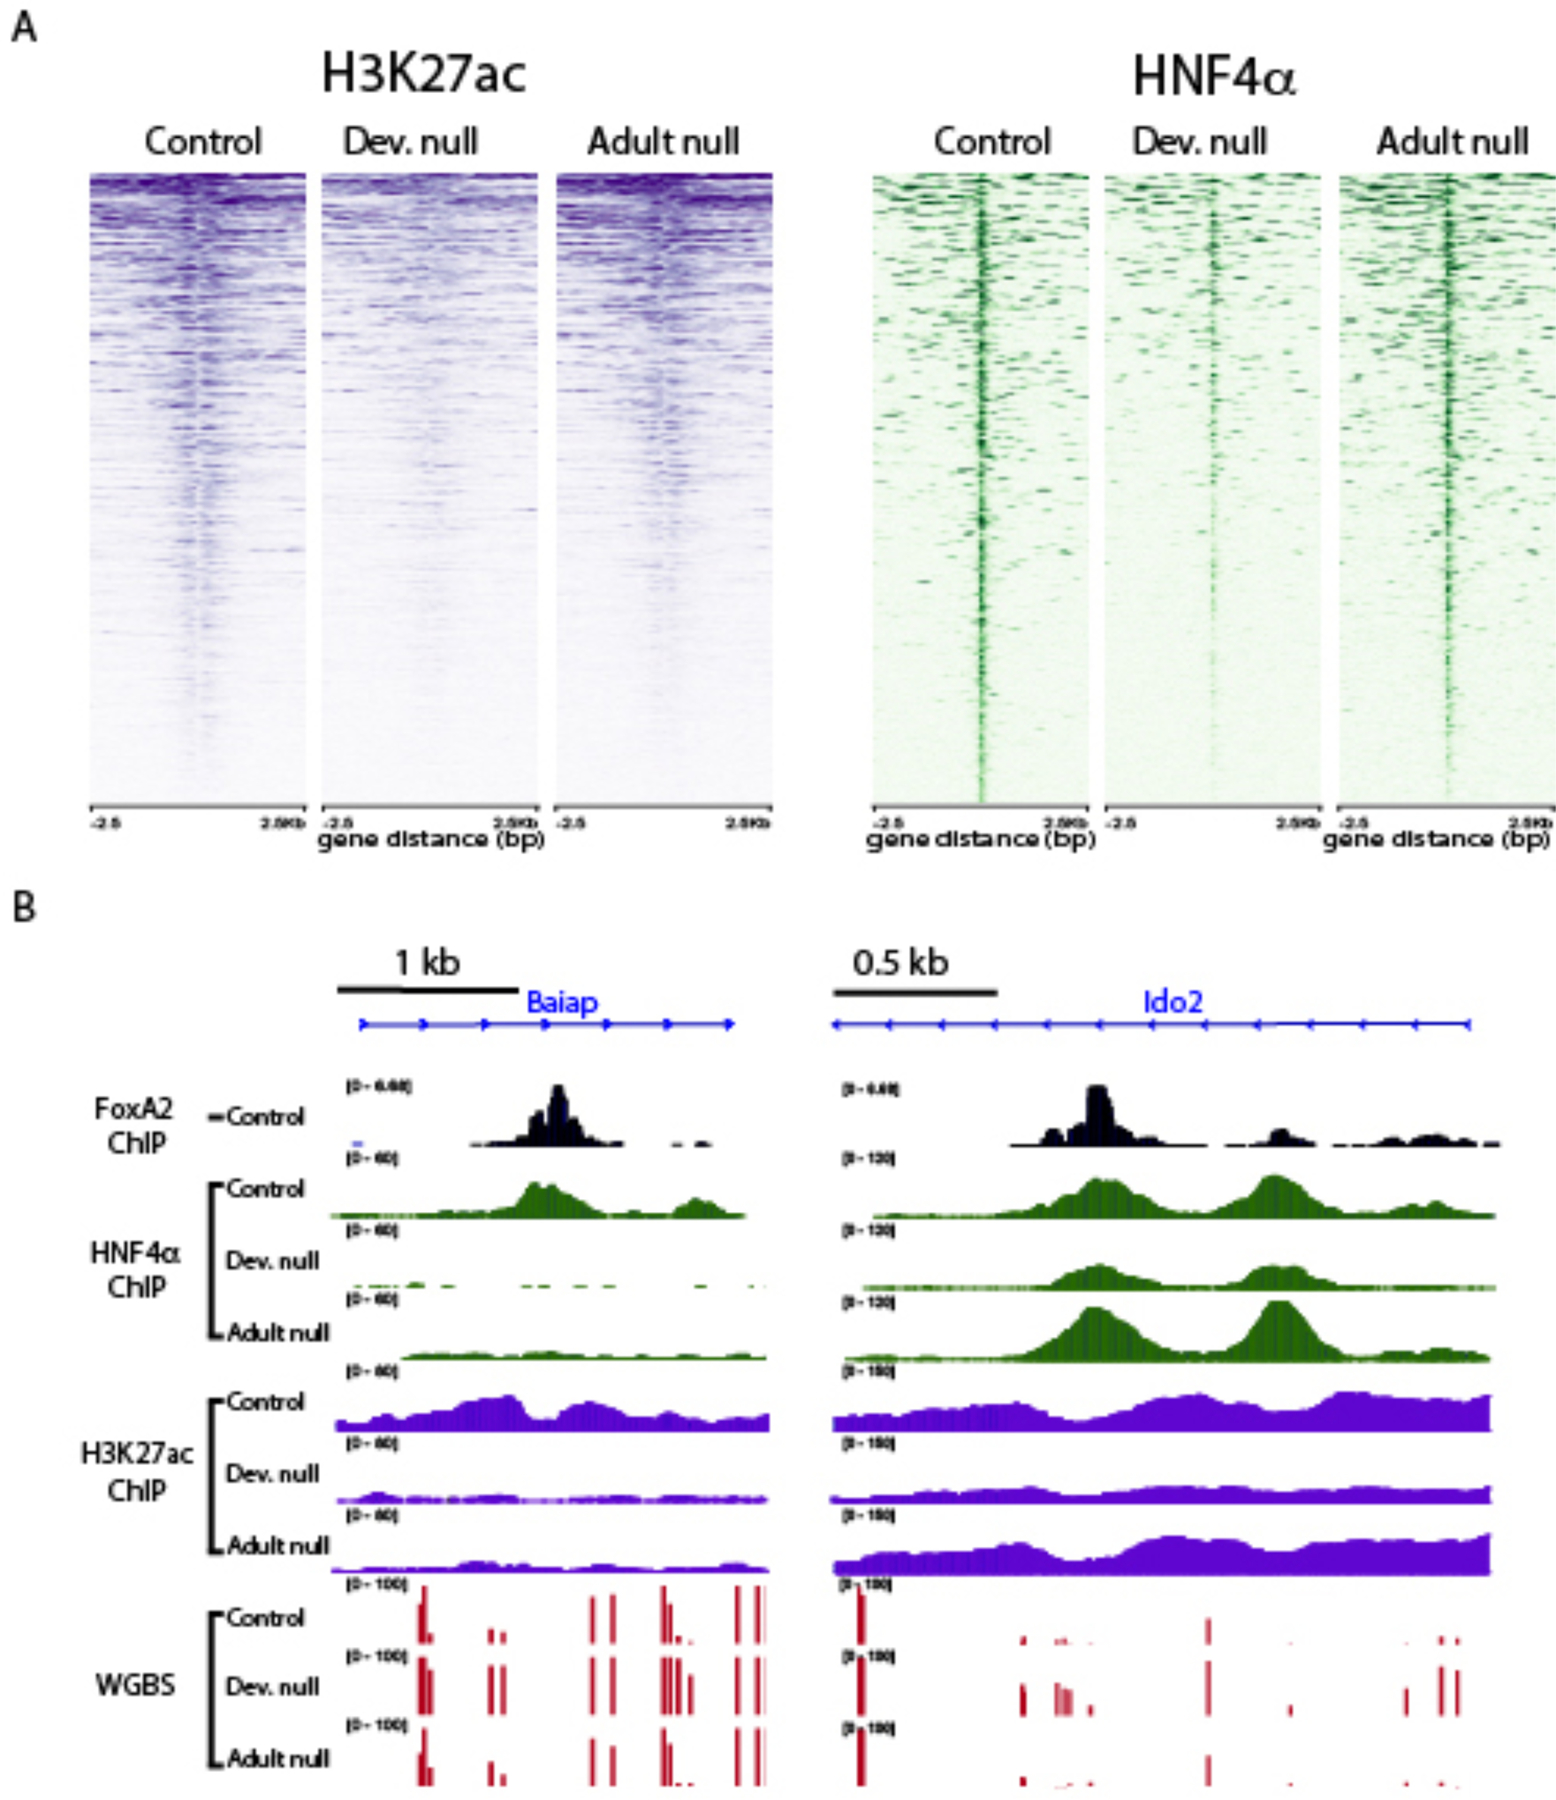
DNA demethylation has been shown to be essential for tissue differentiation and maturation by the increase in enhancer activity and altered gene expression and cellular phenotypes (Orlanski et al., 2016; Reizel et al., 2018; Sheaffer et al., 2014). Therefore, we hypothesized that FoxA-mediated demethylation is associated with altered enhancer activity and the binding of additional transcription factors. H3K27ac is a histone activity mark and HNF4α is a key transcriptional activator in the liver and frequently binds in the vicinity of FoxA proteins (Iwafuchi-Doi et al., 2016). To determine the impact of FoxA-mediated demethylation on enhancer activity and the binding of HNF4a, we performed H3K27ac and HNF4α ChIP-seq on livers of FoxA developmental double null mice and controls. We found a significant reduction in H3K27ac in 63% of hypermethylated FoxA2 bound enhancers and reduced HNF4α signal in 72% of the FoxA2 sites co-bound by HNF4α (Figure 3A–B). In contrast, only 25.5% and 25.8% of isomethylated sites exhibited reduced H3K27ac and HNF4α binding, respectively (Figure 3A–B and S3A, p<0.05, n=3 per each treatment). Overall, these observations demonstrate that loss of FoxA-mediated demethylation at enhancers is associated with reduced enhancer activity and binding of HNF4α.
Figure 3. Inhibition of FoxA-mediated demethylation results in reduced H3K27ac mark and HNF4α binding.
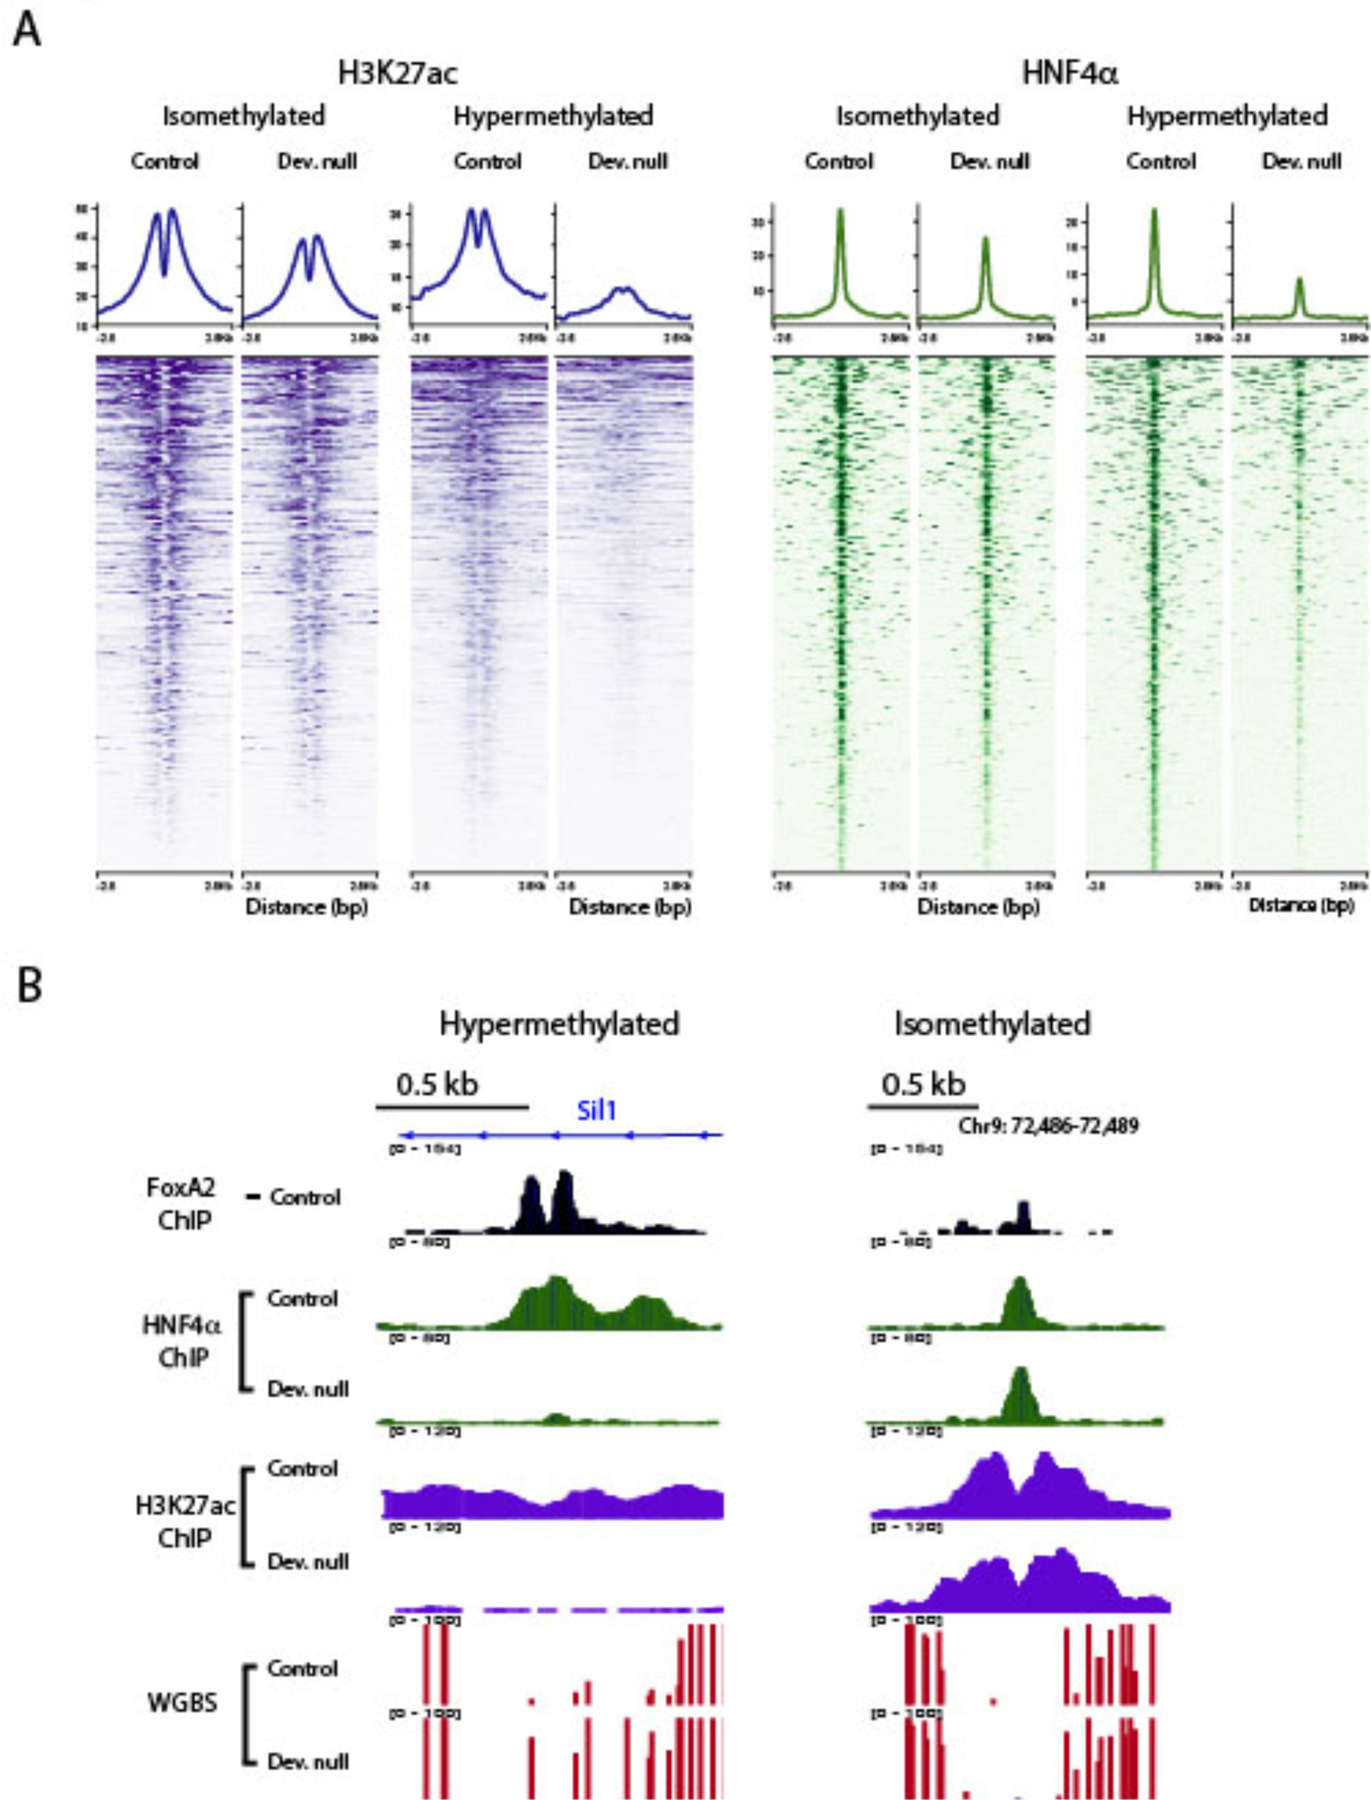
A. Heatmap showing dramatic reduction of H3K27ac and HNF4α binding compared with controls in developmentally hypermethylated sites, but only a moderate effect at isomethylated sites (n=3 for each treatment). B. Two examples of H3K27ac and HNF4α occupancy at isomethylated and hypermethylated sites.
Since we observed a strong association between hypermethylation at FoxA2 sites and loss of binding of HNF4α, we wondered whether hypermethylated sites are associated with aberrant gene expression in FoxA developmental double null mice. For this purpose, we separated the genes associated with either iso- or hypermethylated FoxA2 binding sites and determined if their steady state mRNA levels were altered in livers from FoxA developmental double null mice. We found that the proportion genes that were downregulated by embryonic deletion of FoxA1/2 was higher for genes where the FoxA proteins are required for demethylation than for isomethylated genes (Figure S4A). In contrast, genes upregulated in the FoxA-deficient liver exhibited similar proportions of iso- and hypermethylated genes (Figure S4A, p<0.0001, proportion test). Likewise, genes with reduced expression in the mutant liver were significantly more likely to exhibit increased DNA methylation at FoxA2 binding sites in the FoxA1/2 mutants, while upregulated genes showed no change in DNA methylation status (Figure S4B, p<10−5; Mann-Whitney-Wilcoxon Test). These data show that loss of FoxA-mediated demethylation during development is associated with defective gene activation.
FoxA1/2 dependent developmental enhancer demethylation is primed during development
The data presented thus far demonstrate that FoxA proteins mediate demethylation at 2,705 of its binding sites during development, in many cases leading to reduced transcription of linked genes. Next, we inquired if FoxA proteins are required continuously to maintain hypomethylated enhancers in the adult liver. To address this question, we deleted FoxA1 and FoxA2 in the mature liver by injecting adult FoxA1L/L/2L/L mice with adeno-associated virus 8 (AAV8) encoding Cre recombinase under the control of the hepatocyte-specific thyroid-binding globulin (Tbg) promoter, which resulted in full depletion of these proteins (FoxA1L/L; FoxA2L/L; AAV Cre are termed ‘FoxA double null in adulthood’, Figure S1B). We performed whole genome bisulfite sequencing on hepatocytes from FoxA double null in adulthood mice and age-matched controls and plotted methylation scores at different distances from FoxA binding sites (Figure 4A and S5). Remarkably, more than 99% of those FoxA2 binding sites whose demethylation is FoxA1/2 dependent during hepatic development remained fully demethylated when FoxA gene ablation occurred in adulthood (p<10−16 Mann-Whitney-Wilcoxon Test when compared to FoxA double null; Figure 4A, n=2 per treatment). Thus, the continued presence of the FoxA factors is not required to maintain enhancer hypomethylation once established.
Figure 4. FoxA factors are dispensable for maintaining the hypomethylated state of adult enhancers.
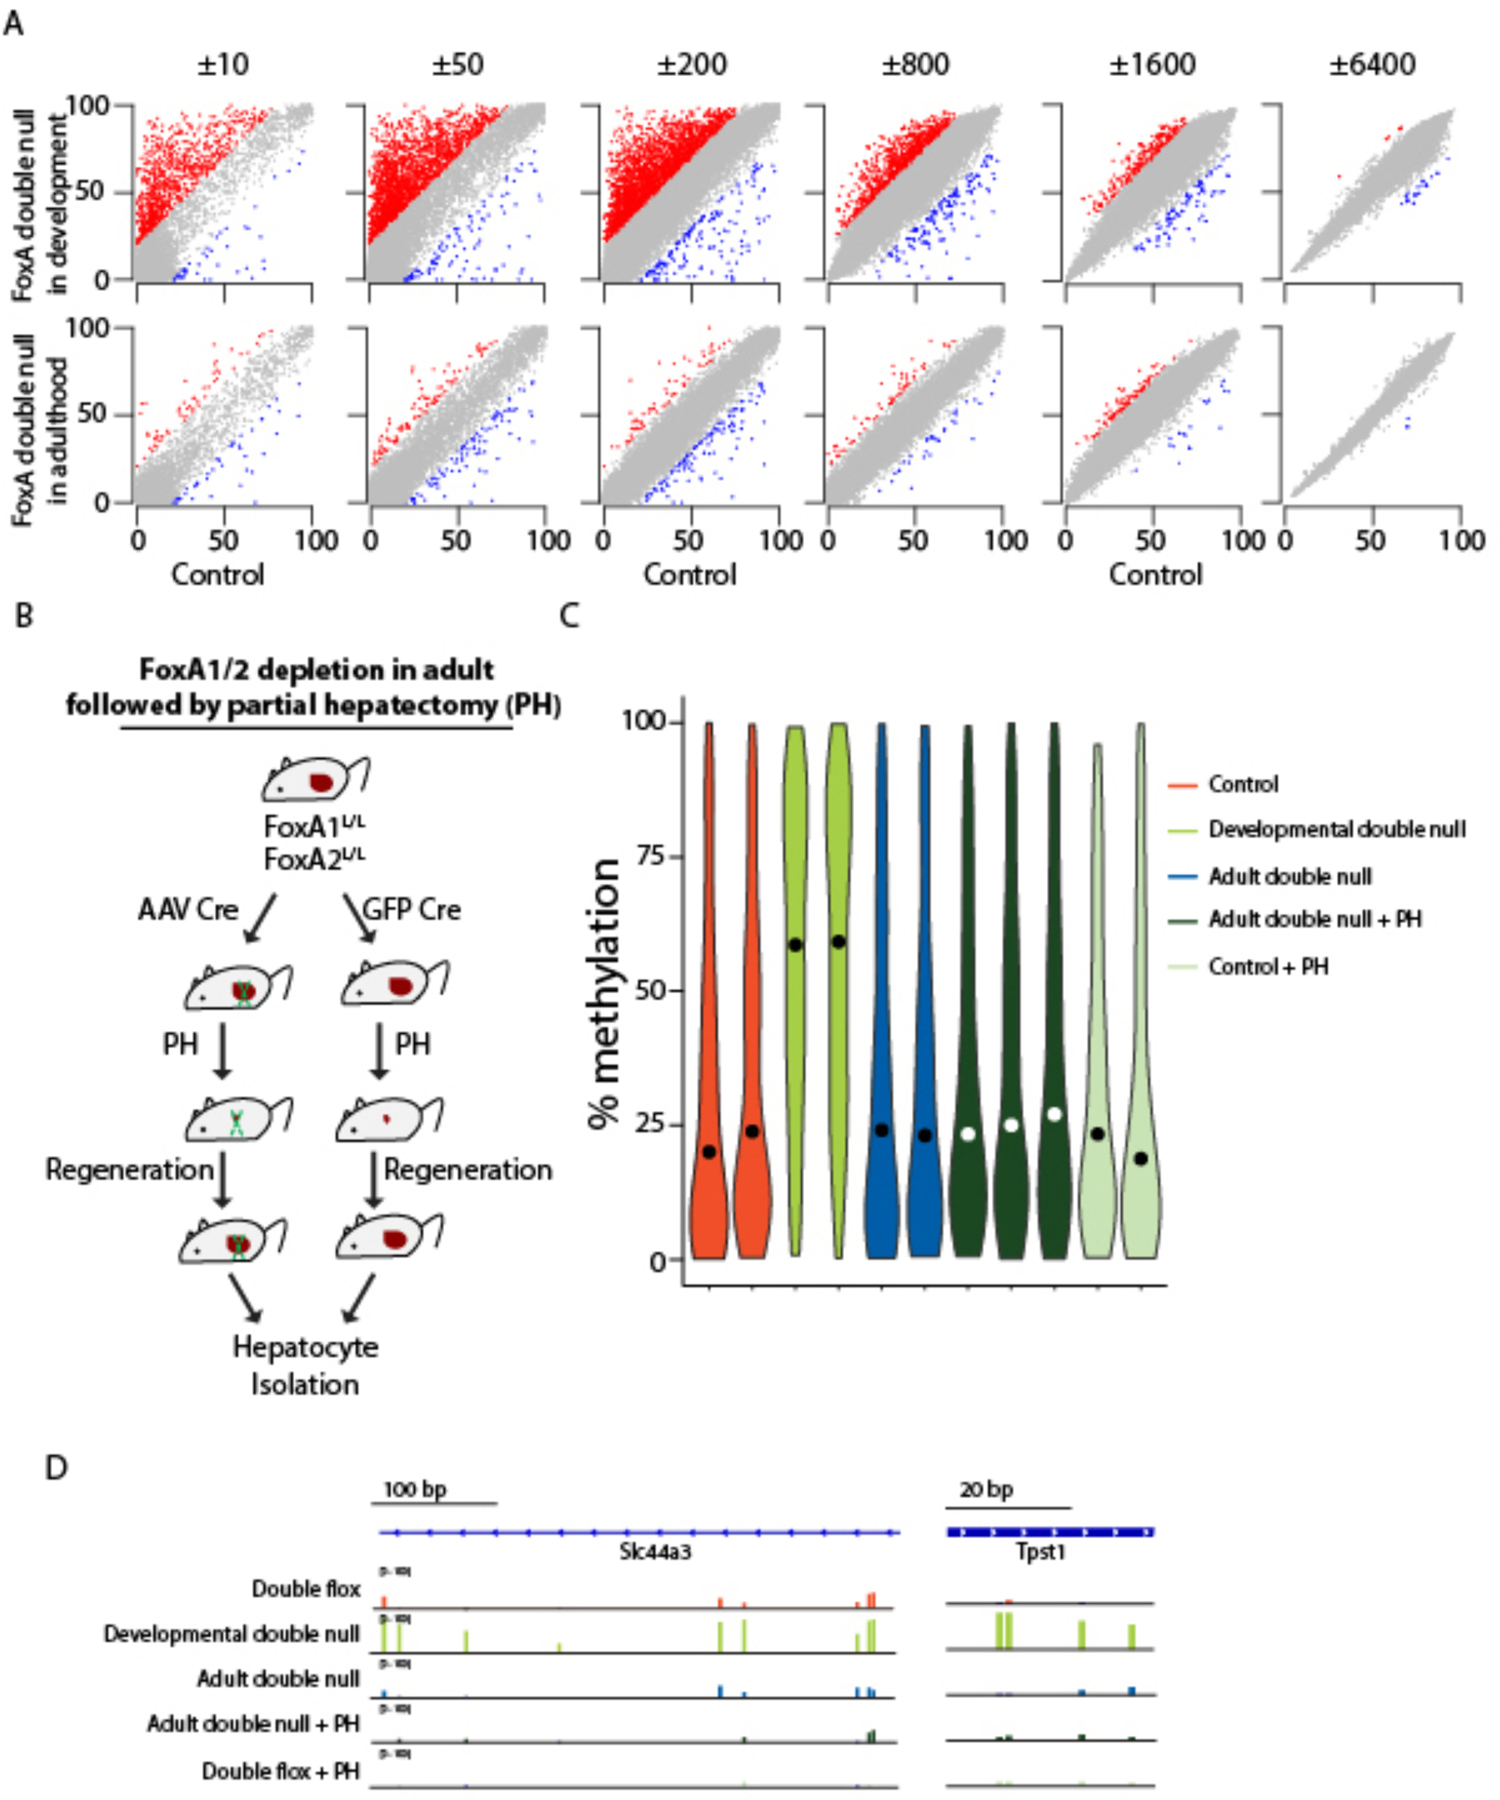
A. Scatter plot of DNA methylation levels at different distances from FoxA2 peak centers in hepatocytes depleted for FoxA1/2 during development (Alfp Cre) or in adulthood (AAV-Cre) compared with controls (without Cre). Hyper- iso- and hypo-methylated regions in the mutant are marked in red, grey and blue, respectively. B. Animal models for depleting FoxA1/2 in adult followed by partial hepatectomy and controls. C. Violin plot showing DNA methylation values of 199 RRBS 100 bp tiles overlapping with hypermethylated sites. While significant changes appear between all samples and the developmental double null liver (p < 10−16, Mann-Whitney-Wilcoxon Test), no statistically significant differences were observed between any other groups, including FoxA depletion in adulthood followed by partial hepatectomy. D. Sites which are dependent on FoxA1/2 for developmental demethylation show no change in DNA methylation after FoxA1/2 depletion in the adult followed by partial hepatectomy.
A possible explanation for the unaltered DNA methylation state of the FoxA double null in adulthood livers is that after FoxA depletion, DNA replication is required for dilution of DNA methylation at now FoxA-free sites. To test this possibility, we induced two rounds of hepatocyte DNA replication by performing partial hepatectomy on FoxA double null in adulthood mice (Figure 4B). Using reduced representation bisulfite sequencing (RRBS), we divided the genome to 100 bp tiles and found 199 tiles overlapping with the 2,705 hypermethylated sites described above. Notably, we observed no significant differences in DNA methylation levels after partial hepatectomy in the absence of adult FoxA1/2, indicating that even if proliferation is induced, FoxA1/2 ablation does not lead to DNA remethylation in the adult liver (Figure 4C–D).
Previously, we had shown that two members of the ten‐eleven translocation (TET) family of methylcytosine dioxygenases, Tet2 and Tet3, are required for hepatic postnatal demethylation (Reizel et al., 2018). Using RRBS and whole genome bisulfite sequencing data obtained from Tet2/3 null hepatocytes depleted at different time points after birth (data generated by (Reizel et al., 2018)), we found that these enzymes are required for demethylation at the same sites in which the FoxA proteins mediate demethylation (Figure S2A–D). Importantly, we found that like FoxA, Tet2/3 are essential during development but are not required to maintain the hypomethylated state in the adult liver (Figure S2A–D). Thus, both the DNA binding transcription factors (FoxA factors) and the enzymes executing the catalytic activity that brings about demethylation (Tet proteins) are required to maintain for the establishment, but not maintenance, of hypomethylation at lineage-specific enhancers in the mammalian liver.
FoxA1/2 dependent developmental enhancer activity is partly dependent on FoxA1/2 presence in the adult
Since we saw that FoxA1 and FoxA2 are not required to maintain the hypomethylated state at liver-specific enhancers when ablated in adulthood, we wondered whether enhancer activity and binding of HNF4α is continuously dependent on FoxA1/2 presence or not. First, we analyzed the H3K27ac mark at DNA methylation variable enhancers. Interestingly, 53% of FoxA1/2 bound enhancers exhibited a reduced histone acetylation mark when the FoxA proteins were depleted in the adult (Figure 5A). Next, we investigated binding of HNF4α at FoxA bound sites. While HNF4α binding was significantly reduced at 72% of co-bound enhancers when FoxA1/2 were depleted in the fetal liver, only 18% of these enhancers exhibited loss of HNF4α occupancy in the adult gene ablation model (Figure 5A and S6, per each treatment n=3). This indicates that while DNA hypomethylation generated by FoxA1/2 during development is not dependent on FoxA presence in the adult liver, significant portions of histone H3K27 acetylation and HNF4α binding are dependent on FoxA1/2 presence in the adult (exemplified in Figure 5B). These data demonstrate that the stability of the DNA hypomethylation state established at FoxA1/A2 bound enhancers is not solely explained by stable enhancer activity and the binding of other hepatic transcription factors.
Figure 5. FoxA1/2 dependent developmental enhancer activity is partly dependent on FoxA1/2 presence in the adult.
A. Heatmap of the H3K27ac and HNF4α ChIP-seq signal in developmental and adult FoxA double null livers for sites that become hypermethylated in the absence of FoxA1/2 during development. B. Examples of hypermethylated sites in which acetylation and HNF4a are being either continuously dependent on FoxA1/2 (left) or independent of FoxA1/2 (right).
Decommissioning of key enhancers by FoxA deletion does not perturb hypomethylation
As mentioned above, deletion of all three FoxA proteins in the fetal liver is not compatible with life. Interestingly, the number of FoxA3 bound sites was doubled in FoxA1/2 developmental double null livers, with most of the gained FoxA3 binding sites in the mutant overlapping with FoxA2 binding sites (termed FoxA3* for convenience, Figure 6A–B, FoxA2 cistrome from {Iwafuchi-Doi, 2016 #27}). This implies that FoxA3 par{Reizel, 2020 #28}tially compensates for the lack of FoxA1 and FoxA2. Indeed, sites that gain FoxA3 occupancy following fetal ablation of FoxA1/2 maintain low DNA methylation levels (Figure 6C). Furthermore, FoxA3 compensation was found recently to be critical for organ homeostasis in the adult liver {Reizel, 2020 #28}. FoxA3* sites were found to be highly associated with genes downregulated when all three FoxA genes are ablated in the mature liver {Reizel, 2020 #28}. Using this model, we investigated whether remethylation occurs in this extreme scenario where depletion of FoxA leads to functional enhancer decommissioning at key liver sites (Figure 6D). Remarkably, DNA methylation at FoxA3* sites remained low and unchanged in this model (Figure 6E–F). Thus, even at sites where pioneer transcription factors are required continuously to maintain enhancer activity, they are dispensable for the preservation of the demethylated state.
Figure 6. Hypomethylation is maintained even when FoxA removal leads to enhancer decommissioning.
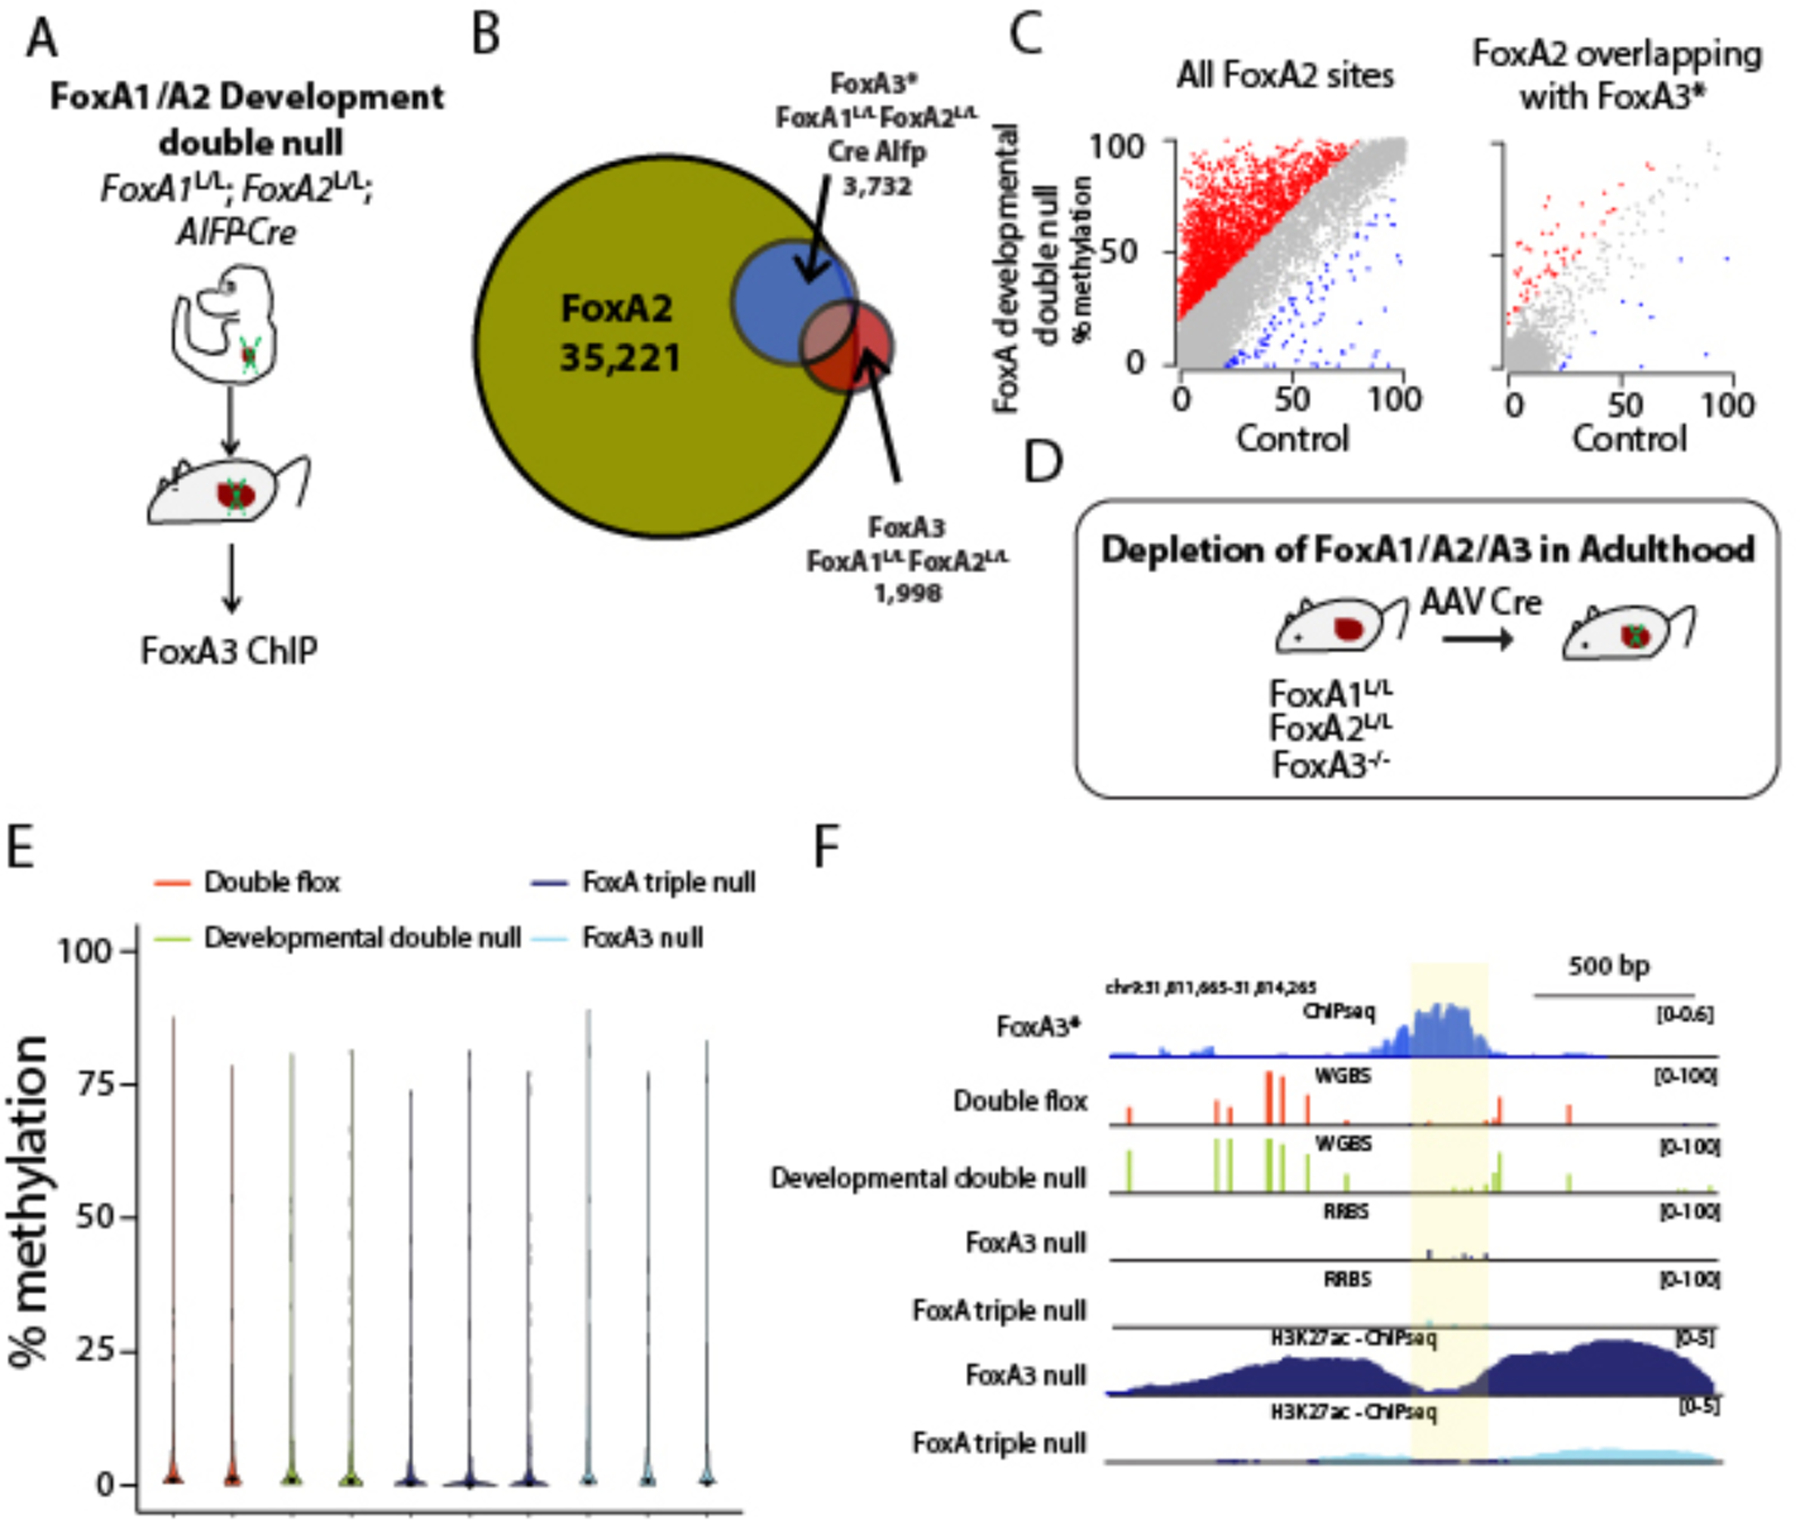
A. A model demonstrating FoxA3 ChIP-seq in the FoxA developmental double null. B. Venn diagram demonstrating compensatory binding of FoxA3* in FoxA developmental double null liver. C. Scatter plot demonstrating methylation levels at ±50 from peak center from either FoxA2 or FoxA3* sites in developmental double null hepatocytes and controls. D. Model of FoxA triple null in the adult. E. Violin plot of methylation levels at 550 RRBS 100 bp tiles overlapping with FoxA3* sites (±50 bp from peak center). No significant increase in DNA methylation levels is observed in FoxA triple null compared with the different controls. F. Example of FoxA3* binding site at which adult FoxA triple gene ablation diminishes the H3K27ac mark but does not affect DNA methylation levels.
Discussion
In the current study, we show that FoxA-mediated demethylation during liver development is associated with enhancer priming and gene activation, and that FoxA-mediated demethylation is autonomously maintained even in cases where other gene activation marks are lost. This strengthens the notion that high-abundance, tissue-specific unmethylated regions with low DNA methylation levels are remnants of an early developmental activation state even when the associated genes are silenced later in life (Jadhav et al., 2019). Recently, it was demonstrated that adult tissue-specific non-active hypomethylated sites can be re-activated under stress conditions such as removal of PRC2 (polycomb repressive complex 2) {Jadhav, 2019 #17}. Thus, PRC2 removal activated embryonic transcription factors that preferentially bound to hypomethylated non-active sites (Jadhav et al., 2019). Together with our observation showing that the hypomethylated state of enhancers is autonomously maintained when pioneer transcription factors are ablated in adulthood, these findings suggest that inactivation of tissue-specific enhancers under extreme stress conditions could be shifted back to homeostatic conditions through the independent and stable nature of DNA methylation patterns. We suggest that DNA methylation patterns are a central compartment of Waddington’s epigenetic landscape, preserving cellular stability and identity (C.H.Waddington, 1957).
As mentioned in the introduction, it was reported that ectopic expression of FoxA2 generates local DNA hypomethylation in vitro that is only transient (Donaghey et al., 2018). This strikingly different outcome is likely the result of ectopic over expression in vitro, which might not fully reflect the physiological context needed for proper demethylation. Defining the factor repertoire that cooperates with the FoxA proteins in order to bring about developmental demethylation is a matter for future experimentation and has implication for improving in vitro differentiation protocols.
This study focused on the interplay between transcription factors and DNA methylation during normal development and homeostasis. Future experiments will determine if pathological conditions such as cancer or viral infection generate stable epigenetic changes similarly to developmental processes. This could be important for the understanding of disease recurrence, since even if symptoms and the transcription factors associated with such symptoms are diminished, the methylation patterns remained could shift cells back to instability once treatment ceases. Indeed, cancer recurrence was shown to be higher in cases where primary tumors display pronounced aberrant methylation (Brock et al., 2008), but it remains to be determined if these methylation changes are indeed stable and persist from the original tumor to its recurrence.
STAR Methods
Mice
All procedures involving mice were conducted under a protocol approved by the Institutional Animal Care and Use Committee (IACUC) of the University of Pennsylvania. 8 weeks-old mice FoxA1L/L; FoxA2L/L with or without Cre Alfp were used for dissecting the role of FoxA1/2 in liver development. In the case of FoxA1/2 ablation in adulthood, a total of 1 × 10¹¹genome copies of AAV8 carrying the gene for Cre under the hepatocyte-specific Tbg promoter (Penn vector core) were injected into the superficial temporal vein of FoxA1L/L; FoxA2L/L 8-weeks-old mice. For deleting all FoxA proteins, we injected AAV Cre to FoxA1L/L; FoxA2L/L; FoxA3−/− 8 weeks old mice {Reizel, 2020 #28}. Mice were anesthetized, sacrificed, and subjected to liver perfusion. Whole liver was then digested by collagenase (Roche) and hepatocytes isolated by means of a Percoll gradient (Haimerl et al. 2009). This yielded a population of highly enriched (>95%) hepatocytes. DNA was isolated from hepatocytes or from snap-frozen tissues and incubated in lysis buffer (25 mM Tris-HCl (pH 8), 2 mM ethylenediaminetetraacetic acid, 0.2% sodium dodecyl sulfate, 200 mM NaCl) supplemented with 300 μg/mL proteinase K (Roche) followed by phenol:chloroform extraction and ethanol precipitation or using DNeasy (Qiagen).
Immunohistochemistry
Liver tissues fixed with paraformaldehyde were paraffin-embedded and sectioned. Tissues were deparaffinized, slides were incubated for 15 minutes at 56°C and then immersed in xylene for 5 minutes twice. Slides were rehydrated and then quickly dipped in H2O and then incubated in PBS for 5 minutes. Antigen retrieval was done as follows: slides were immersed in 1X R-Buffer A (Electron Microscopy Sciences) and loaded into a 2100 Antigen Retriever (Proteogenix). After reaching the target temperature, slides were allowed to cool for 2 hours. Slides were washed with running water for 5 minutes and then incubated in PBST (1X PBS, 0.1% Tween-20) for 5 minutes. Then, slides were incubated in PBS for 5 minutes three times. Slides were immersed in 3% H2O2 for 15 minutes to quench peroxidases, washed with gentle running H2O for 5 minutes, and incubated in PBS. Avidin D blocking reagent (Vector Laboratories) was applied to the slides for 15 minutes at room temperature followed by PBS. Then, tissue and slides were again incubated with Biotin blocking reagent (Vector Laboratories) for 15 minutes at room temperature and then washed again in PBS. Slides were incubated for 10 minutes at room temperature with CAS-Block (Thermo Fisher). FoxA2 antibody (Millipore 07–633) was diluted in CAS Block and applied to the tissues, and the slides were incubated overnight at 4°C in a humidified chamber. The following day, slides were incubated in PBST for 5 minutes followed by PBS for 5 minutes twice. The secondary antibody was diluted at a ratio of 1:200 in CAS Block and applied to the tissue for 30 min at 37C and then washed twice in PBS for 5 minutes. Then, slides were incubated for 30 minutes in a humidified chamber at 37°C with ABC HRP Reagent (Vector Laboratories PK-7100). Slides were washed in PBS twice for 5 minutes. Using the DAB Substrate Kit for Peroxidase (Vector Laboratories), signal development was monitored under a microscope. Slides were washed with running water for 10 minutes to stop the reaction. To counterstain the tissue, slides were dipped in Hematoxylin Solution (Sigma GHS216) and then washed with running water for 5 minutes. Tissue sections were dehydrated and mounted using Cytoseal XYL (Thermo Fisher).
Whole Genome Bisulfite Sequencing (WGBS)
WGBS libraries were prepared using the Ovation® Ultralow Methyl-Seq Library System (NuGEN Technologies Inc.) as per the manufacturer’s instructions. One hundred and fifty nanograms of genomic DNA was sheared with the M220 Focused-ultrasonicator™ (Covaris®) using the 200 bp snap-cap protocol and subsequently purified with AMPure XP beads. After end repair, adaptor ligation, and final repair, DNA was bisulfite converted with the EpiTect Fast DNA Bisulfite Kit (Qiagen GmbH) following the cycling conditions specified in the Ovation® Ultralow Methyl-Seq Library System protocol. Libraries were then amplified, purified, pooled, and sequenced on the Illumina HiSeq 4000 with 100 bp single-end sequencing. Sequencing was conducted by the University of Pennsylvania Next-Generation Sequencing Core (Philadelphia, PA, USA) to greater than 20X coverage.
RRBS
RRBS was performed using Ovation RRBS Methyl-Seq according to the manufacturer’s instruction. We used 100 ng hepatocyte DNA. Libraries were then amplified, purified, pooled, and sequenced on the Illumina HiSeq 4000 with 100 bp single-end sequencing with a minimum of 25 million reads per sample.
Partial hepatectomy
10–14 week old male transgenic mice were injected with AAV Cre or AAV GFP. After 3 weeks and validating FoxA expression mice underwent partial hepatectomy (PHx) according to the protocol of Mitchell and Willenbring between 8 AM and noon (Mitchell and Willenbring, 2014; Mukherjee et al., 2017). Briefly, after isofluorane anesthesia, a ventral midline incision was made. Then the median and left lateral lobes, comprising 70% of the liver, were resected by pedicle ligation. To ensure maximum cell division, mice were sacrificed 30 days after partial hepatectomy was performed.
ChIP-seq
130 mg of frozen liver was minced in 2 mL of cold 1X DPBS (Thermo Fisher 14080055). The volumes of liver slices were brought up to 10 mL of 1X DPBS and 1% formaldehyde and incubated at room temperature for 8 minutes with rotation. Reaction was brought to 0.125 M glycine for quenching and incubated for 5 minutes at room temperature with rotation. Samples were centrifuged at 2,500 RCF for 2 minutes at 4°C, and the supernatant was discarded and the pellet washed with 1XDPBS. The pellet was resuspended in 1 mL of cold ChIP cell lysis buffer (10 mM Tris-HCl pH 8.0, 10 mM NaCl, 3mM MgCl2, 0.5% IGEPAL CA-630, 1X cOmplete protease inhibitor cocktail) and transferred on ice to a 10 mL tissue grinder. The samples were homogenized 20 times with a smooth Teflon pestle and incubated at 4°C for 5 minutes. Following incubation the samples were centrifuged for 5 minutes at 17,000 RCF at 4°C, to pellet the nuclei. After the supernatant was discarded, and nuclei were resuspended in 1 mL of cold ChIP nuclear lysis buffer (50 mM Tris-HCl pH 8.0, 5 mM EDTA, 1% SDS, 1X cOmplete protease inhibitor cocktail). Then, we performed two rounds of sonication using the Standard Biruptor (Diagenode UCD-200) with the following parameters: Intensity = High (H), Multitimer = OFF: 30 sec, ON: 30 sec, Total timer = 7.5 minutes with maintaining 4°C. Following sonication, samples were centrifuged at 17,000 RCF for 10 minutes at 4°C and supernatant was recovered.
We isolated DNA from the sonicated chromatin to determine the amount of material required for precipitation. The DNA concentration was quantified using a NanoDrop-1000 (Thermo Fisher) and run on a BioAnalyzer High Sensitivity ChIP to estimate the length distribution. Then, 10 μg of sonicated chromatin was added to 1 mL of ChIP dilution buffer (16. mM Tris-HCl pH 8.0, 167 mM NaCl, 0.01% SDS, 1.1% Triton-X 100, 1X cOmplete protease inhibitor cocktail). 3 μg of the following antibodies, H3K27ac (Active Motif 39133) and HNF4α (Abcam ab181604), were added to the samples and the samples were incubated at 4°C overnight with rotation. 40 μL of recombinant protein G agarose beads (Thermo Fisher) were washed three times with 1 mL of ChIP dilution buffer. Next, the beads were resuspended in 75 μL of ChIP Dilution Buffer and 5 μL of BSA (New England BioLabs) and incubated at 4°C overnight with rotation for blocking. Then chromatin samples were added to the blocked beads and incubated at 4°C for 1 hour with rotation. Samples were centrifuged at 100 RCF for 30 seconds and the supernatant was discarded. The beads were then washed sequentially with each of the following buffers by resuspending the beads in 1 mL of buffer, incubating beads at room temperature for 5 minutes with rotation, pelleting beads, and discarding supernatant: TSE I (20 mM Tris-HCl pH 8.0, 150 mM NaCl, 2 mM EDTA, 0.1% SDS, 1% Triton X-100), TSE II (20 mM Tris-HCl pH 8.0, 500 mM NaCl, 2 mM EDTA, 0.1% SDS, 1% Triton X-100), ChIP Buffer III (10 mM Tris-HCl pH 8.0, 0.25 M LiCl, 1 mM EDTA, 1% IGEPAL CA-630, 1% Sodium Deoxycholate), TE (10 mM Tris-HCl pH 8.0, 1 mM EDTA). After the washes, the beads were resuspended in 100 μL of elution buffer (0.1 M NaHCO3, 1% SDS) and incubated at room temperature for 15 minutes with rotation. 4 μL of 5M NaCl was added to the supernatant and then samples were incubated at 65°C overnight. Next, DNA was isolated from the samples using Minielute (Quiagen).
Enrichment of IP samples was measured through qPCR using the following program: 95°C for 3 minutes, for 40 cycles, 95°C for 5 seconds, 60°C for 20 seconds, with the primers indicated below. Then, libraries were prepared using the NEBNext Ultra II DNA Library Prep Kit for Illumina. Libraries were sequenced on the Illumina Hiseq 4000 with 50 bp single-end sequencing with a minimum of 20 million reads per sample.
HNF1α promoter-
F - GCA CTT GCA AGG CTG AAG TC
R - ATT GGA GCT GGG GAA ATT CT
40S
F - AGC GAG CTG TGC TGA AGT TT
R - AGG CTG CTT GGA TCT GGT TA
Distribution of Materials, Data, and Code
Distribution of Materials:
Mouse strains are available from MMRRC.
Deep Sequencing Data:
All data have been deposited in the Gene Expression Omnibus (GEO) under accession number GSE124384. The following secure token has been created to allow review of record GSE124384 while it remains in private status: kvybyiyonxaldgr.
Data Analysis
DNA methylation data was analyzed by using 100 bp single-end sequencing reads that were trimmed and quality filtered by trim galore software (v.0.3.3) using the following command:
trim_galore sample_R1.fastq.gz
Read alignment (genome build mm9) and extraction of single-base resolution methylation levels were carried out by BSMAP v.2.74 (Xi and Li 2009) using the following commands:
bsmap -a sample_R1_val_1.fq.gz -d mm9_AllGenome.fa -o bam_file -R -p12
python methratio.py -i “no-action” -g -z -o sample_trim_galore_mm9.fa.meth -d mm9_AllGenome.fa bam_file
DNA methylation scores were calculated for FoxA2 binding sites obtained by ChIP-exo-seq (Iwafuchi-Doi et al. 2016) at different distances from the FoxA2 peak centers. The methylation score in each window is the average methylation level of CpGs located in the window per sample. Then, the average of two biological samples was calculated. In order to choose a rigorous cutoff when comparing FoxA1L/L; FoxA2L/L; Alfp Cre to controls, we permutated each of these samples twice (for two mutants and two controls, Supplemental Figure 1) and choose a 20% difference in methylation levels between the groups as the cutoff, since this gave less than 5% false positive signal in the permutation comparison. In order to further examine the validity of the hyper methylated site, we summed the number of methylated and unmethylated CpG’s in controls and Foxa1/2 deficient mice and performed proportional test on each of these sites. 99.9% of these sites were significantly different (p<0.05) between controls and mutants after correction for multiple testing. WGBS data for additional tissues was obtained from (Hon et al., 2013). For postnatal demethylation only 0.4% of FoxA2 sites were hypermethylated, which is at background levels.
RRBS analysis
Single-end RRBS runs were trimmed with trim galore (v.0.3.3), then we employed diversity trimming and filtering with NuGENs diversity trimming script trimRRBSdiversityAdaptCustomers.py.
Read alignment (genome build mm9) and extraction of methylation levels were carried out by BSMAP v.2.74 (Xi and Li, 2009) using the following commands:
bsmap -a sample_R1_val_1.fq.gz -d mm9_AllGenome.fa -o bam_file -R -D C-CGG
python methratio.py -i “no-action” -p -g -z -o sample_trim_galore_mm9.fa.meth -d mm9_AllGenome.fa bam_file
Percent methylation was calculated for 100 bp tiles with a minimum coverage of 10 CpGs.
In order to examine methylation levels at hypermethylated sites in developmental FoxA double null of hepatocytes isolated from newborns, Tet2/3 ko, partial hepatectomy samples and FoxA triple null, we determined methylation levels of 100 bp tiles overlapping with these hypermethylated sites and took only tiles in which score was achieved among compared samples. We also rescored WGBS samples with the same parameters in order to get a comparable value. Heatmaps and dendrograms were generated with R library heatmap.2 and density plot were generated with stata – software for statistics and data science.
ChIP-seq analysis
Single-end sequencing reads were trimmed with Cutadapt and aligned to mouse genome (genome build mm9) using Bowtie2 version 2.3.4.1. PCR duplicates were removed using picard.jar tool and the command MarkDuplicates with the following flags:”REMOVE_DUPLICATES=true VALIDATION_STRINGENCY=LENIENT”. In order to compare differential binding between controls and FoxA double nulls in hyper- or isomethylated sites, we used DiffBind version 2.10.0 (Ross-Innes et al., 2012). Peaks were defined as ±250 base pairs from peak center. Normalization was done with DBA_SCORE_RPKM_FOLD and DB.DESeq2 was used to find statistically significant differences between groups. We took only binding sites with an RPKM average larger than 10 in controls or FoxA triple null and counted as significant only sites with FDR < 0.05. The same parameters were used for HNF4a binding comparison and H3K27ac.
Bam files were converted to Bedgraph files after normalizing to 1 million reads per library using BEDtools (“genomecov”) and then converted to bigwig format using UCSC toolkit (“bedGraphToBigWig”). For control and FoxA triple null groups, an average bigwig file was also generated from the replicates (“bigWigMerge“).
Analyzing effect on gene expression
1.5-fold differences in gene expression between FoxA1/2 Cre Alfp and controls were taken from Li et al (Li et al. 2012). Figure 3B represent DNA methylation scores of intragenic FoxA2 peaks (±200 bp from peak center) were calculated as described above. Each FoxA site was assigned with a single score and methylation scores in all intragenic sites in down- or up-regulated genes were grouped and compared between mutants and controls.
Supplementary Material
Acknowledgments:
We like to thank Dr. Yuval Dor and Dr. Adam Zahm as well as other members of the Kaestner lab for critical discussions of the manuscript. This study was supported by the National Institutes of Health (R01-DK102667 to K.H.K.) and the Functional Genomics Core of the Penn Diabetes Research Center (P30-DK19525).
Footnotes
The authors declare no competing financial interests. Readers are welcome to comment on the online version of the paper.
References
- Boller S, Ramamoorthy S, Akbas D, Nechanitzky R, Burger L, Murr R, Schübeler D, and Grosschedl R (2016). Pioneering Activity of the C-Terminal Domain of EBF1 Shapes the Chromatin Landscape for B Cell Programming. 44, 527–541. [DOI] [PubMed] [Google Scholar]
- Brock MV, Hooker CM, Ota-Machida E, Han Y, Guo M, Ames S, Glöckner S, Piantadosi S, Gabrielson E, Pridham G, et al. (2008). DNA Methylation Markers and Early Recurrence in Stage I Lung Cancer. 358, 1118–1128. [DOI] [PubMed] [Google Scholar]
- Waddington CH (1957). The Strategy of the Gene.
- Cheung WL, Briggs SD, and Allis CD (2000). Acetylation and chromosomal functions. Current Opinion in Cell Biology 12, 326–333. [DOI] [PubMed] [Google Scholar]
- Donaghey J, Thakurela S, Charlton J, Chen JS, Smith ZD, Gu H, Pop R, Clement K, Stamenova EK, Karnik R, et al. (2018). Genetic determinants and epigenetic effects of pioneer-factor occupancy. Nature Genetics 50, 250–258. [DOI] [PMC free article] [PubMed] [Google Scholar]
- Dor Y, and Cedar H (2018). Principles of DNA methylation and their implications for biology and medicine. The Lancet 392, 777–786. [DOI] [PubMed] [Google Scholar]
- Hon GC, Rajagopal N, Shen Y, McCleary DF, Yue F, Dang MD, and Ren B (2013). Epigenetic memory at embryonic enhancers identified in DNA methylation maps from adult mouse tissues. 45, 1198–1206. [DOI] [PMC free article] [PubMed] [Google Scholar]
- Iwafuchi-Doi M, Donahue G, Kakumanu A, Jason, Mahony S, Lee B, Klaus D, and Kenneth (2016). The Pioneer Transcription Factor FoxA Maintains an Accessible Nucleosome Configuration at Enhancers for Tissue-Specific Gene Activation. 62, 79–91. [DOI] [PMC free article] [PubMed] [Google Scholar]
- Iwafuchi-Doi M, and Zaret KS (2016). Cell fate control by pioneer transcription factors. Development 143, 1833–1837. [DOI] [PMC free article] [PubMed] [Google Scholar]
- Jadhav U, Cavazza A, Banerjee KK, Xie H, O’Neill NK, Saenz-Vash V, Herbert Z, Madha S, Orkin SH, Zhai H, et al. (2019). Extensive Recovery of Embryonic Enhancer and Gene Memory Stored in Hypomethylated Enhancer DNA. Molecular Cell 74, 542–554.e545. [DOI] [PMC free article] [PubMed] [Google Scholar]
- Lee CS, Friedman JR, Fulmer JT, and Kaestner KH (2005). The initiation of liver development is dependent on Foxa transcription factors. Nature 435, 944–947. [DOI] [PubMed] [Google Scholar]
- Li Z, Gadue P, Chen K, Jiao Y, Tuteja G, Schug J, Li W, and Klaus (2012). Foxa2 and H2A.Z Mediate Nucleosome Depletion during Embryonic Stem Cell Differentiation. Cell 151, 1608–1616. [DOI] [PMC free article] [PubMed] [Google Scholar]
- Li Z, White P, Tuteja G, Rubins N, Sackett S, and Kaestner KH (2009). Foxa1 and Foxa2 regulate bile duct development in mice. Journal of Clinical Investigation 119, 1537–1545. [DOI] [PMC free article] [PubMed] [Google Scholar]
- Mayran A, Khetchoumian K, Hariri F, Pastinen T, Gauthier Y, Balsalobre A, and Drouin J (2018). Pioneer factor Pax7 deploys a stable enhancer repertoire for specification of cell fate. Nature Genetics 50, 259–269. [DOI] [PubMed] [Google Scholar]
- Mitchell C, and Willenbring H (2014). Addendum: A reproducible and well-tolerated method for 2/3 partial hepatectomy in mice. 9. [DOI] [PubMed] [Google Scholar]
- Mukherjee S, Chellappa K, Moffitt A, Ndungu J, Dellinger RW, Davis JG, Agarwal B, and Baur JA (2017). Nicotinamide adenine dinucleotide biosynthesis promotes liver regeneration. Hepatology 65, 616–630. [DOI] [PMC free article] [PubMed] [Google Scholar]
- Orlanski S, Labi V, Reizel Y, Spiro A, Lichtenstein M, Levin-Klein R, Koralov SB, Skversky Y, Rajewsky K, Cedar H, et al. (2016). Tissue-specific DNA demethylation is required for proper B-cell differentiation and function. Proceedings of the National Academy of Sciences 113, 5018–5023. [DOI] [PMC free article] [PubMed] [Google Scholar]
- Pastor WA, Aravind L, and Rao A (2013). TETonic shift: biological roles of TET proteins in DNA demethylation and transcription. Nature Reviews Molecular Cell Biology 14, 341–356. [DOI] [PMC free article] [PubMed] [Google Scholar]
- Reizel Y, Sabag O, Skversky Y, Spiro A, Steinberg B, Bernstein D, Wang A, Kieckhaefer J, Li C, Pikarsky E, et al. (2018). Postnatal DNA demethylation and its role in tissue maturation. Nature Communications 9. [DOI] [PMC free article] [PubMed] [Google Scholar]
- Ross-Innes CS, Stark R, Teschendorff AE, Holmes KA, Ali HR, Dunning MJ, Brown GD, Gojis O, Ellis IO, Green AR, et al. (2012). Differential oestrogen receptor binding is associated with clinical outcome in breast cancer. Nature 481, 389–393. [DOI] [PMC free article] [PubMed] [Google Scholar]
- Sheaffer KL, Kim R, Aoki R, Elliott EN, Schug J, Burger L, Schubeler D, and Kaestner KH (2014). DNA methylation is required for the control of stem cell differentiation in the small intestine. Genes & Development 28, 652–664. [DOI] [PMC free article] [PubMed] [Google Scholar]
- Xi Y, and Li W (2009). BSMAP: whole genome bisulfite sequence MAPping program. BMC Bioinformatics 10, 232. [DOI] [PMC free article] [PubMed] [Google Scholar]
- Zhang L, Rubins NE, Ahima RS, Greenbaum LE, and Kaestner KH (2005). Foxa2 integrates the transcriptional response of the hepatocyte to fasting. 2, 141–148. [DOI] [PubMed] [Google Scholar]
- Zhu H, Wang G, and Qian J (2016). Transcription factors as readers and effectors of DNA methylation. Nature Reviews Genetics 17, 551–565. [DOI] [PMC free article] [PubMed] [Google Scholar]
Associated Data
This section collects any data citations, data availability statements, or supplementary materials included in this article.