

Abstract
Introduction: This effort investigated formaldehyde vapor characteristics under various environmental conditions by the analyses of air samples collected over a time-course. This knowledge will help responders achieve desired formaldehyde exposure parameters for decontamination of affected spaces after a biological contamination incident.
Methods: Prescribed masses of paraformaldehyde and formalin were sublimated or evaporated, respectively, to generate formaldehyde vapor. Adsorbent cartridges were used to collect air samples from the test chamber at predetermined times. A validated method was used to extract the cartridges and analyze for formaldehyde via liquid chromatography. In addition, material demand for the formaldehyde was evaluated by inclusion of arrays of Plexiglas panels in the test chamber to determine the impact of varied surface areas within the test chamber. Temperature was controlled with a circulating water bath connected to a radiator and fan inside the chamber. Relative humidity was controlled with humidity fixed-point salt solutions and water vapor generated from evaporated water.
Results: Low temperature trials (approximately 10°C) resulted in decreased formaldehyde air concentrations throughout the 48-hour time-course when compared with formaldehyde concentrations in the ambient temperature trials (approximately 22°C). The addition of clear Plexiglas panels to increase the surface area of the test chamber interior resulted in appreciable decreases of formaldehyde air concentration when compared to an empty test chamber.
Conclusion: This work has shown that environmental variables and surface-to-volume ratios in the decontaminated space may affect the availability of formaldehyde in the air and, therefore, may affect decontamination effectiveness.
Keywords: paraformaldehyde, formalin, formaldehyde, material demand, environmental, air sampling
Introduction
The use of formaldehyde (H2CO; CAS No. 50-00-0) vapor as an effective sterilant and decontaminant for indoor enclosures, especially against persistent biological select agents and toxins (BSAT), has been documented for decades.1,2 Although there is a voluminous amount of data with respect to decontamination efficacy using H2CO vapor,3,4 little information is available with respect to the impact of environmental conditions on H2CO air concentrations and partitioning among air and surfaces within an enclosure. To conduct effective full-scale response or remediation of malicious, accidental, or natural releases of BSAT, data are needed to better understand the impact of environmental conditions on critical H2CO fumigation parameters.
To achieve the project goals, reliable methods are required to determine H2CO air concentrations. Some previous efforts have relied on theoretical H2CO air concentrations based on the mass of sublimated paraformaldehyde (PF) or heated (evaporated) formalin.5 A systematic study to examine H2CO air concentrations at specified time points over a prolonged duration is needed to provide the data to develop predictive vapor profiles. A previous effort by Ngabo et al5 demonstrated that lower H2CO air concentrations (752 parts per million [ppm] theoretical concentration) resulted in lower decontamination efficacies (less than 6-log reduction) when Bacillus atrophaeus spores inoculated onto nonporous stainless steel material coupons were exposed for 2 hours. When Ngabo et al extended the contact time to 6 hours in the same small test chamber (0.59 m3), a greater than 6-log reduction was achieved, but the confirmatory liquid broth assessments resulted in positive cultures, thereby showing that some B atrophaeus spores survived the treatment and remained viable. Higher H2CO air concentrations (ie, higher formalin volumes; greater than or equal to 1521 ppm theoretical concentration) resulted in greater than or equal to 6-log reduction of B atrophaeus with negative growth in the liquid broth at relatively short exposure times (30 minutes, 1 hour). Beswick et al6 observed less than 6-log reduction of Geobacillus stearothermophilus spores inoculated onto stainless steel discs after a 3-hour exposure to 600 ppm H2CO vapor (theoretically calculated, not actually measured) generated from formalin in a relatively large enclosure (35 m3). When H2CO vapor was generated in a larger enclosure (150 m3) in the Beswick et al study, a much higher H2CO concentration was used (1400 ppm theoretical concentration) that achieved the complete inactivation within the detectable limit (6-log reduction). Taylor et al7 described heating (ie, depolymerizing) PF to generate a contaminant-free, dry H2CO gas, whereas the H2CO gas generated from formalin may contain methanol and formic acid. Rogers et al4 sublimated 10.5 g/m3, approximately 5 times the amount of PF needed to reach the vapor phase equilibrium concentration reported by Ackland et al8 (when exceeding this concentration, surface condensation occurs) over a 10-hour time-course study and showed that excess H2CO had condensed onto the interior surfaces. Ackland et al determined that the H2CO vapor phase equilibrium was 2.0 g/m3 (1628 ppm) at 20°C. Condensation or sorption of H2CO on surfaces can limit the amount of formaldehyde that can be distributed as a vapor. However, higher decontamination efficacies on porous materials, compared to nonporous materials, have been observed with H2CO fumigations and may be due to latent effects of surface-associated formaldehyde, as porous materials offer more surface area for sorption or condensation.9,10
The purpose of the current study was to determine if H2CO vapor profiles are affected under various environmental conditions and as a function of surface area available for sorption and/or condensation. The results of this effort may be used to reduce the cost and time required to mitigate a biological contamination incident by enhancing our understanding of method performance outside ideal conditions and potentially expanding the options for effective decontamination. A better understanding of this fumigant is needed for prescription of real-world decontamination approaches.
Materials and Methods
Test Materials
The results of the current study were part of a larger study that evaluated efficacy of H2CO vapor against Bacillus spores inoculated onto surfaces, as well as H2CO vapor characteristics under varied environments. For this reason, material coupons were present inside the test chamber for 6 of the 11 trials described here (efficacy trials as shown in Table 1; Trial Nos. 1, 3, 8-11). Two indoor surfaces were used for testing: cinder block concrete (Wellnitz Concrete Products) painted with water-based epoxy paint (Sherwin Williams, product code K46W1151) and bare pine wood (Lowe's Home Improvement, general molding). Test materials (1.9 x 7.5 cm) were cut from larger pieces of stock material.
Table 1.
Test conditions for each trial a
| Trial No. | H2CO Vapor Source | Targeted PF Mass Sublimated Into Chamber Air (g) | Temperature | RH (method) | Efficacy or H2CO Characteristic |
|---|---|---|---|---|---|
| 1 | Paraformaldehyde | 5.2 | Ambient (21°C-22°C) | 75% starting (saltsb) | Efficacy |
| 2 | Paraformaldehyde | 5.2 | Ambient | 70%-75% controlled (salts) | Characteristic |
| 3 | Paraformaldehyde | 5.2 | 10°C controlled | 75% starting (salts) | Efficacy |
| 4 | Paraformaldehyde | 5.2 | 10°C controlled | 70%-75% controlled (salts) | Characteristic |
| 5 | Paraformaldehyde | 5.2 | Ambient | 75% starting (vaporc) | Characteristic (x1d) |
| 6 | Paraformaldehyde | 5.2 | Ambient | 75% starting (vapor) | Characteristic (x5e) |
| 7 | Paraformaldehyde | 5.2 | Ambient | 75% starting (vapor) | Characteristic (x20f) |
| 8 | Paraformaldehyde | 1 | Ambient | 70% starting (vapor) | Efficacy |
| 9 | Formalin | 1 | Ambient | 70%-80% starting (vapor) | Efficacy |
| 10 | Formalin | 5.2 | 10°C controlled | 75% starting (vapor) | Efficacy |
| 11 | Formalin | 1 | 10°C controlled | 75% starting (vapor) | Efficacy |
g, gram or grams; PF, paraformaldehyde; RH, relative humidity.
salts, RH generated with saturated salt in containers.
vapor, RH generated with water vapor (boiled).
x1, surface area of test chamber during normal setup.
x5, test chamber surface area increased x5 versus normal setup with 20 clear Plexiglas panels.
x20, test chamber surface area increased x20 versus normal setup with 85 clear Plexiglas panels.
Test Chamber
A 498 L static glovebox (Plas-Labs Model No. 830-ABB) was modified with high-efficiency particulate air (HEPA) filters to allow for the rapid evacuation of H2CO gas from the test chamber via ducts to the laboratory air-scrubbing system (Figure 1). Due to the ability to rapidly evacuate H2CO from the test chamber interior, neutralization of the H2CO with ammonium carbonate11 was not needed to reduce H2CO air concentration at the terminus of experimental trials. Therefore, removal of the resulting hexamethylenetetramine residue on all surfaces, a byproduct of the ammonium carbonate neutralization reaction with H2CO, was not required. A radiator-fan unit (Alphacool Model No. 14215) was mounted and operated inside the test chamber for efficient air mixing. A circulating water-bath (Thermo Scientific Model No. NESLAB RTE7), filled with automotive anti-freeze solution, was used to achieve low air temperature conditions when prescribed. The test chamber was pressure-tested before each trial to confirm the absence of leaks. A data logger (Onset Cat. No. HOBO MX1101) was placed in the sealed test chamber and collected both temperature and relative humidity (RH) measurements every minute for the 48-hour duration of testing. For some trials, before trial initiation, the RH was adjusted with a fixed-point salt solution (ie, saturated salt solution) according to ASTM International Designation E104-02 to the targeted 70% to 75% level but not controlled over the duration of testing.12 Other trials involved the evaporation of water using a hot-plate, also not controlled to achieve the targeted 70% to 75% level.
Figure 1.

Test chamber configuration. (1) HEPA filters for rapid evacuation of H2CO, (2) radiator-fan unit to circulate air and control test chamber temperature, (3) circulating water-bath to cool test chamber air temperature, and (4) HOBO data-logger.
Paraformaldehyde and Formalin
For each PF trial, a prescribed mass of PF solid (ie, prill, Sigma Cat. No. 441244), which consisted of 95% H2CO, was placed on an aluminum pan (McMaster-Carr Cat. No. 17805T82) and heated to 170°C using a hot-plate (Corning Model No. Scholar 170), to sublimate the prill into H2CO vapor.8 The sublimation process was ≤40 minutes in duration, depending on PF mass. To simulate field-use conditions, the RH inside of the test chamber was not adjusted after achieving the targeted level (minimum 70%). After no visible PF remained in the pan, the hot-plate was turned off, and the first air sample was collected to establish the concentration of H2CO at time-point 0 hour.
For each formalin trial (Table 1), a formaldehyde-equivalent mass of formalin (Sigma Cat. No. F1635), which consisted of 37% H2CO (10%-15% methanol, water), was placed in an aluminum pan (McMaster-Carr Cat. No. 17805T82). Per the European standard (BS EN 12469:2000), an equivalent volume of water to formalin was added to the pan and mixed. The formalin-water mixture was then evaporated with a hot-plate (170°C) to generate H2CO vapor. After no formalin-water mixture remained in the pan (≤1 hour to achieve complete evaporation), the hot-plate was turned off, and the first air sample was collected to establish time-point 0 hour.
Air Sampling and Extraction Methods to Determine Formaldehyde Concentration
At time-point 0 hour (ie, the first time-point immediately after H2CO vapor generation) and at each of the remaining 5 time-points for every trial, air samples were collected. Once collected, the air samples were further processed to remove the captured aldehyde compound from a coated silica bed inside the cartridge. The EPA's Compendium Method TO-11A13 was used as an active sampling methodology to determine H2CO air concentrations. Air samples were collected on 2,4-dinitrophenylhydrazine (DNPH) impregnated silica cartridges (Supelco LpDNPH H300 cartridges, Sigma Cat. No. 505331). A calibrated digital flow controller device (Sierra Model No. Smart-Trak100) was used to precisely meter the volume of air through the DNPH cartridge at 0.5 L/min for 2 minutes (1 L total) per sample. The configuration allowed air to be pulled from the test chamber; through a flow controller, pump, and cartridge; then circulated back into the test chamber. During the collection of the air samples, the H2CO in the air was collected on a DNPH cartridge that had sufficient capacity to capture the available H2CO (ie, no H2CO was exhausted out of the cartridge). After the 2-minute collection, the DNPH cartridge was immediately capped and stored no more than 2 weeks at 2°C to 8°C until extracted. Cartridges were extracted with high-performance liquid chromatography (HPLC)–grade acetonitrile (100 mL, Fisher Scientific Cat. No. A998). An aliquot of the extract was analyzed with a Shimadzu Nexera Ultra High-Performance Liquid Chromatography system equipped with an ultraviolet detector at 360 nm. The dual Supelcosil LC-18 reverse phase columns (4.6 mm x 15 cm, Supelco Part No. 58230-U) were used with an isocratic mobile phase of 70% acetonitrile in water to separate the chromatogram peaks. The calibration range was set between 0.03 to 15 μg/mL, and a calibration curve of a minimum of 6 points was used to calculate the H2CO concentration in the extract.
Material Demand Tests
To determine the adsorption or condensation (ie, “material demand”) of H2CO onto the interior test chamber materials, a set of tests was conducted with various surface area-to-volume ratios. Clear Plexiglas (American Plastics) sheets were laser cut into 9 ft2 total surface area (ie, bulk measurement, front-and-back), 0.125-in thick, panels that precisely fit inside the test chamber (Figures 2A and 2B). Twenty panels (9 ft2 total surface area each) were used to achieve a total interior surface area x5 (Figure 2C) that of the base tests (empty chamber), and 85 panels were used to achieve x20 surface area. The distance between each panel was 0.25 in for both x5 and x20 assessments. New panels, uncleaned and untreated with chemical before testing, were used in each test. Also, spacers on the test chamber floor were added to lift each panel off the surface to allow air circulation and mixture by the radiator-fan unit. A smoke-test was conducted before the generation of H2CO vapor to visually confirm uniform mixing of the test chamber air, including between the panels.
Figure 2.

Test chamber design. (A) Clear Plexiglas panels for x20 test chamber interior surface area for material demand evaluation. (B) Scaled illustration of clear Plexiglas panel configuration inside test chamber. (C) Clear Plexiglas panels for x5 test chamber interior surface area for material demand evaluation (prior to placement inside test chamber). Panel array assembled using threaded rods, and the 0.25-in distance between each panel achieved with washer spacers.
Sampling Interval
Air samples were collected at 6 time-points for all trials: 0 hour, +16 hours, +24 hours, +32 hours, +40 hours, and +48 hours after H2CO vapor generation. Air samples collected at the time-point 0 hour (immediately after generation) for each trial represented the time-point where the highest H2CO concentration was anticipated.
Results
Formaldehyde generated from 5.2 g PF at room (ambient) temperature with 70% to 75% RH (Trial No. 1, Table 1) resulted in the highest concentrations of H2CO at 1811 ppm at time-point 0 hours (Figure 3). A repeat trial using the same conditions (Trial No. 2, Table 1) resulted in 1602 ppm measured at time-point 0 hours (Figure 3). At 16 to 48 hours, the concentrations from each trial remained relatively consistent (641, 677, 583, 647, and 585 ppm for 16, 24, 32, 40, and 48 hours, respectively, for Trial 1; 215, 170, 172, 163, and 158 ppm for 16, 24, 32, 40, and 48 hours, respectively, for Trial 2), which suggests that an equilibrium was reached at some point before 16 hours for these test conditions. The difference in concentrations between the 2 trials may be attributed to how the RH was introduced. In Trial No. 1, the RH was adjusted with a fixed-point salt solution (ie, saturated salt solution) to the targeted 70% to 75% level but not controlled over the duration of testing. Therefore, the saturated salt solution container was closed before PF sublimation. Due to the observation of Trial No. 1 that RH decreased over time, the saturated salt solution container was left open for Trial No. 2 throughout PF sublimation, as well as the exposure time-course. As a result, the saturated salt solution may have absorbed some of the H2CO vapor and reduced the levels available in the air. Indeed, formaldehyde hydration has been described previously.14
Figure 3.
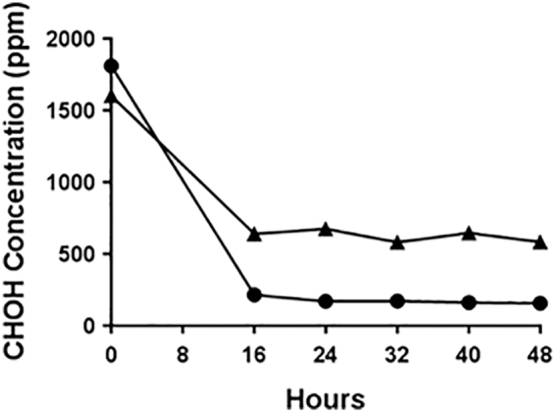
Formaldehyde air concentrations after sublimation of 5.2 g PF at ambient temperature. Trial No. 1 sublimation of 5.2 g PF at ambient temperature (•) and targeted 70% to 75% RH with time-point 0-hour H2CO vapor concentration at 1811 ppm. Trial No. 2 repeat sublimation of 5.2 g PF at ambient temperature (▴) and targeted 70% to 75% RH with time-point 0-hour H2CO vapor concentration at 1602 ppm.
These air concentrations were indicative of approaching the vapor phase equilibrium concentration, as described by Rogers et al.4 When the temperature was decreased to approximately 10°C with a targeted 70% to 75% RH inside the test chamber, the H2CO vapor concentrations at time-point 0 hours were also lower in 2 separate trials (Trial Nos. 3 and 4, Table 1) at 128 ppm and 98 ppm, respectively (Figure 4). At 16 to 48 hours, the concentrations from each trial remained relatively consistent.
Figure 4.

Formaldehyde air concentrations after sublimation of 5.2 g PF at 10°C. Trial No. 3 sublimation of 5.2 g PF at approximately 10°C test chamber temperature (•) and targeted 70% to 75% RH with time-point 0-hour H2CO vapor concentration at 128 ppm. Trial No. 4 sublimation of 5.2 g PF approximately 10°C test chamber temperature (▴) and targeted 70% to 75% RH with time-point 0-hour H2CO vapor concentration at 98 ppm.
During the material demand trials conducted at ambient temperature with a targeted 70% to 75% RH, the x1 surface area (ie, test chamber with normal setup and no Plexiglas panels; Trial No. 5, Table 1) resulted in the highest starting H2CO concentration of the 3 trials, at 1602 ppm (time-point 0 hour). The x5 surface area (ie, test chamber contained 20 panels; Trial No. 6, Table 1) and x20 surface area (ie, test chamber contained 85 panels; Trial No. 7, Table 1) resulted in H2CO concentrations of 938 ppm and 807 ppm, respectively, at time-point 0 hour, a noticeable decrease compared to the x1 surface area trial (Figure 5). At 16 to 48 hours, the concentrations from each trial remained relatively consistent, which suggests that an equilibrium was reached at some point before 16 hours for these test conditions.
Figure 5.

Evaluation of surface area-to-volume ratio on formaldehyde air concentrations. Trial No. 5, sublimation of 5.2 g PF at x1 total test chamber interior surface area (•) at ambient temperature and targeted 70% to 75% RH with time-point 0-hour H2CO vapor concentration at 1602 ppm. Trial No. 6, x5 total surface area (▴) at ambient temperature and targeted 70% to 75% RH with time-point 0-hour H2CO vapor concentration at 938 ppm. Trial No. 7, x20 total surface area (▪) at ambient temperature and targeted 70% to 75% RH with a time-point 0-hour H2CO vapor concentration of 807 ppm.
The PF-equivalent mass of formalin for 1 g PF (2.5 g formalin or 2.3 mL; Trial No. 8, Table 1) resulted in a time-point 0-hour H2CO concentration of 667 ppm versus 1341 ppm from PF (Trial No. 9, Table 1; Figure 6) conducted at ambient temperature with a targeted 70% to 75% RH. For the first time, the concentrations from each trial decreased over the 16- to 48-hour time course.
Figure 6.

Formaldehyde air concentrations over time when molar equivalent quantities of 1 g PF and formalin (2.5 g) are released at ambient temperature. Trial No. 8, sublimation of 1 g PF at ambient temperature and targeted 70% to 75% RH (•) with time-point 0-hour H2CO vapor concentration at 1341 ppm. Trial No. 9, sublimation of 2.5 g formalin, 1 g-equivalence of PF at ambient temperature and targeted 70% to 75% RH (▴) with time-point 0-hour H2CO vapor concentration at 667 ppm.
The PF-equivalent mass of formalin for 5.2 g PF (13.2 g formalin or 12.5 mL; Trial No. 10, Table 1) conducted at approximately 10°C with a targeted 70% to 75% RH resulted in a time-point 0-hour H2CO concentration of 532 ppm (Figure 7) versus 128 ppm and 98 ppm, respectively, from PF (Trials No. 3 and 4, Table 1; Figure 4). Evaporation of 2.5 g formalin and 13.2 g formalin resulted in similar starting concentrations and concentration profiles over the 48-hour time course (Figure 7). At 16 to 48 hours, the concentrations from these trials remained relatively stable. In contrast, the PF-equivalent mass of formalin for 1 g PF (Trial No. 9, Table 1) and 1 g PF (Trial No. 8, Table 1) showed decreasing concentrations throughout the entire time course (Figure 5). Testing at approximately 10°C, with 5.2 g PF (Trials 3 and 4) and the mass-equivalent of formalin (Trial 10) resulted in lower H2CO concentrations when compared to trials that used 1 g PF (Trial 8) and the PF-equivalent mass of formalin (Trial 9) at ambient temperature.
Figure 7.

Formaldehyde air concentrations over time when 2.5 g or 13.2 g formalin are released at 10°C. Trial No. 11, sublimation of 2.5 g formalin, 1.0 g-equivalence of PF at approximately 10°C test chamber temperature and targeted 70% to 75% RH (•) with time-point 0-hour H2CO vapor concentration at 398 ppm. (The time-point 24-hour sample was not collected.) Trial No. 10, sublimation of 13.2 g formalin, 5.2 g-equivalence of PF (▴) at approximately 10°C test chamber temperature and targeted 70% to 75% RH with time-point 0-hour H2CO vapor concentration at 532 ppm.
Discussion
Munro et al3 showed that the optimal decontamination parameters when using H2CO for B anthracis spores were 66% RH, a minimum temperature of 28°C, and 10.5 g PF/m3. The test chamber used for this effort was 0.5 m3; therefore, the maximum mass of PF used was 5.2 g (10.5 g PF/m3; Trial Nos. 1-7 and 10, Table 1). In other trials, 1 g PF or 2.5 g of formalin (Trial Nos. 8 and 9, Table 1) was used in the test chamber to assess formaldehyde air concentrations when less than 10.5 g/m3 is released. Regardless of the environmental conditions or amount of PF or formalin released, a decrease in formaldehyde air concentration consistently occurred from time-point 0 to 16 hours. At 16 to 48 hours, the concentrations remained relatively consistent for all environmental conditions when using the 5.2 g, which suggests that an equilibrium may have been reached at some point before 16 hours for this test chamber configuration. Rogers et al4 showed a slower decline in H2CO air measurements out to 10 hours after vapor generation (measurements ceased after 11 hours). The generation methods between the work described in Rogers et al4 and this effort were similar (ie, both generation methods used PF heated in a container, only at the initiation of each test). Several mechanisms could account for the more rapid loss of H2CO air concentrations in the current study, including photolysis, surface reactions, and sorption to or condensation onto surfaces.
Condensation loss to surfaces occurs as the result of formaldehyde phase change when excess formaldehyde vapor is introduced in the system, beyond the concentration that can be achieved as dictated by temperature. For the current study, declines in H2CO vapor concentrations over time were observed for all tests, regardless of the amount of H2CO released. According to the study by Ackland et al,8 the equilibrium vapor concentration at 20°C was determined as approximately 1628 ppm in a simple test apparatus. In the current test apparatus, the equilibrium vapor concentration may differ slightly, however, due to inherent differences in the 2 test chambers. Interestingly, maximum H2CO air concentrations measured during the 1 g and 5.2 g releases were 1341 ppm (Trial 8, 1 g), 1811 ppm (Trial 1, 5.2 g), and 1602 ppm (Trial 2, 5.2 g). These measured maximum vapor concentrations from all 3 trials, regardless of the initial amount released, approximated the 1628 ppm vapor concentration at 20°C to 21°C. However, this study could not confirm whether these values are equivalent to the Ackland et al equilibrium vapor concentration due to different formaldehyde detection methods. Losses to surfaces during the formaldehyde emission process are also possible. While force-evaporating formaldehyde and formalin, localized air concentrations above the dissemination device may reach the vapor equilibrium concentration and limit further transfer of H2CO to the air. This phenomenon may result in excess H2CO depositing onto surfaces.
Formaldehyde vapor may sorb onto the available surfaces and may go through reversible and irreversible reactions, and sorption can account for reductions in vapor concentration.15 In the current study, one potential indicator that H2CO sorption/desorption occurred inside the test chamber was that it took several days (up to 6 days in some cases) to clear the test chamber of H2CO (as measured with a low-level sensor, Drager Gas Detection Tubes, Cole-Parmer Cat. No. EW-86514-34) for safe reentry after H2CO evacuation (0.75 ppm permissible exposure limit measured as an 8-hour time-weighted average, 29 CFR 1910.1048) in preparation for the next trial.16 Chemical reactions may change the physical appearance of materials, especially their surfaces. However, no discoloration from H2CO vapor of the material coupons or test chamber components was observed.
Material demand trials that involved the increase of the test chamber interior surface area with clear Plexiglas panels (Trial Nos. 6 and 7, Table 1) showed similar H2CO concentration profiles, indicating that losses to surfaces were relatively similar between x5 and x20 interior surface area trials (Figure 5). It is possible that the x5 condition achieved maximum sorption or condensation rate for that temperature and H2CO concentration and that x20 added no additional effect. However, the trials did show a trend of decreasing maximum H2CO air concentrations as surface area increased once the volumes that the Plexiglas panels occupied inside the test chamber were considered in the calculation.
Re-polymerization of H2CO, following condensation or sorption on surfaces, would likely result in an effective sink for H2CO from the air fraction. Polymerized H2CO, unlike free H2CO, could be relatively stable at room temperature conditions. In addition, H2CO is highly water-miscible; thus, any exposure to water could result in H2CO vapor losses.17,18
Degradation of H2CO vapor by photolysis may also have occurred during tests; however, this mechanism of removal was not directly measured or decoupled from other removal mechanisms. Previous reports have suggested rates of H2CO photolysis by indoor lights are between 106 and 107 molecules cm−3 s−1.19 At the reported highest rate, less than 0.001% of the sublimated H2CO would have been degraded over the entire 48-hour tests where 5.2 g PF was sublimated, and approximately 0.004% of PF in tests where 1.0 g PF was sublimated. Actual rates of photolysis in the current study were likely lower than those reported previously, as visible and ultraviolet light intensity in the chamber would be reduced when passing through the enclosure walls. Further, light intensities in the current study are likely similar to those of the Rogers et al4 study, where low rates of H2CO decomposition were observed over 11 hours, as the tests were conducted using the same laboratories. Nonetheless, further work is needed to understand the relative importance of all H2CO vapor degradation and scavenging/partitioning processes. The above-mentioned mechanisms will influence the vapor concentration of formaldehyde, and depending on the conditions of targeting buildings or structures, the level of formaldehyde loss may differ. Others have demonstrated that relationships between formaldehyde sources, sinks, and air concentrations are complex in complex environments.15,20 Losses to air exchange and interaction with surfaces and liquids could pose a significant challenge to maintaining target concentrations when fumigating an indoor built environment, other than those designed for routine fumigation such as Biosafety Level 3 laboratories.
Trials conducted at 10°C internal air temperatures (Trial Nos. 3, 4, 10, and 11, Table 1) resulted in a precipitous drop in H2CO air concentrations. Air measurements taken immediately after sublimation of 5.2 g PF at 10°C resulted in concentrations between 128 and 532 ppm H2CO, much lower than the concentrations measured at room temperature. One possible explanation is there was an appreciable amount of surface area inside the test chamber due to the radiator-fan unit (ie, consisting of tubing made from heat-conductive aluminum that snaked throughout the unit) being present. The circulating water-bath that was connected to the radiator-fan unit was set at approximately 3°C to attain a test chamber air temperature of 10°C ± 2°C. Since the dew point with the low-temperature test chamber configuration was calculated at 4.8°C, water likely condensed on the radiator-fan aluminum tubing. H2CO readily solubilizes in water.17 Therefore, the condensate formed on the aluminum tubing may have scavenged H2CO from the air, thereby reducing the air concentrations during testing.
The total surface area of each painted concrete and bare pine wood coupon was 42.6 and 40.5 cm2, respectively. A typical test included replicates of 5 coupons for each of the 2 materials for 5 of 6 air sampling intervals, for a total of 50 coupons per spore type. Since 2 spore types were concurrently run during a typical test, there were as many as 100 coupons available inside the test chamber. The combined surface area of the 100 coupons was 8310 cm2 or 22.1 % of the total surface area created by the acrylic test chamber interior (37,533 cm2). From a surface area perspective, what impact the coupons had in terms of measured H2CO concentrations and whether there was an appreciable effect that resulted from H2CO reacting with the paint or absorbing into the wood are unknown. Lastly, other potential losses of H2CO such as polymerization and other chemical reactions were not explored in the current study yet may be important factors in predicting achievable H2CO vapor concentrations and, ultimately, decontamination success. Further work is warranted to characterize all potential effectors of formaldehyde and formalin use for decontamination operations.
Variable and unpredictable environmental conditions are expected in the field. Responders who plan on deploying H2CO vapor in a field setting will prescribe a process and predict results based on the data generated in a laboratory at the bench-scale. The bench-scale data presented here support predictions of environmental impacts on H2CO air concentrations and decontamination efficacy.
Acknowledgments
The authors would like to thank Morgan Q.S. Wendling, Lukas Oudejans, and David Bright for their review of this manuscript, as well as Brian J. O'Shea and Addie E. Moore for their meaningful input on safety practices.
Ethical Approval Statement
Not applicable to this study.
Statement of Human and Animal Rights
Not applicable to this study.
Statement of Informed Consent
Not applicable to this study.
Declaration of Conflicting Interests
The authors declared no potential conflicts of interest with respect to the research, authorship, and/or publication of this article.
Disclaimer
The US Environmental Protection Agency through its Office of Research and Development funded and directed the research described herein under EP-C-16-014 with Battelle Memorial Institute. It has been subject to an administrative review but does not necessarily reflect the views of the Agency. No official endorsement should be inferred. EPA does not endorse the purchase or sale of any commercial products or services.
Funding
The authors disclosed receipt of the following financial support for the research, authorship, and/or publication of this article: The US Environmental Protection Agency through its Office of Research and Development funded and directed the research described herein under EP-C-16-014 with Battelle Memorial Institute.
ORCID iD
M. Worth Calfee  https://orcid.org/0000-0001-6544-329X
References
- 1. Lach VH. A study of conventional formaldehyde fumigation methods. J Appl Bacterial. 1990;68(5):471-477. [DOI] [PubMed] [Google Scholar]
- 2. Spotts Whitney EA, Beatty ME, Taylor TH Jr, et al. Inactivation of Bacillus anthracis spores. Emerg Infect Dis. 2003;9(6): 623-627. [DOI] [PMC free article] [PubMed] [Google Scholar]
- 3. Munro K, Lanser J, Flower R. A comparative study of methods to validate formaldehyde decontamination of biological safety cabinets. Appl Environ Microbiol. 1999;65(2):873-876. [DOI] [PMC free article] [PubMed] [Google Scholar]
- 4. Rogers JV, Choi YW, Richter WR, et al. Formaldehyde gas inactivation of Bacillus anthracis, Bacillus subtilis, and Geobacillus stearothermophilus spores on indoor surface materials. J Appl Microbiol. 2007;103(4):1104-1112. [DOI] [PubMed] [Google Scholar]
- 5. Ngabo D, Pottage T, Bennett A, Parks S. Cabinet decontamination using formaldehyde. Appl Biosaf. 2017;22(2):60-67. [Google Scholar]
- 6. Beswick AJ, Farrant J, Makison C, et al. Comparison of multiple systems for laboratory whole room fumigation. Appl Biosaf. 2011; 16(3):139-157. [Google Scholar]
- 7. Taylor LA, Barbeito MS, Gremillion GG. Paraformaldehyde for surface sterilization and detoxification. Appl Microbiol. 1969; 17(4):614-618. [DOI] [PMC free article] [PubMed] [Google Scholar]
- 8. Ackland NR, Hinton MR, Denmeade KR. Controlled formaldehyde fumigation system. Appl Environ Microbiol. 1980;39(3): 480-487. [DOI] [PMC free article] [PubMed] [Google Scholar]
- 9. Spiner DR, Hoffmann RK. Effect of relative humidity on formaldehyde decontamination. Appl Microbiol. 1971;22(6): 1138-1140. [DOI] [PMC free article] [PubMed] [Google Scholar]
- 10. Braswell JR, Spiner DR, Hoffman RK. Adsorption of formaldehyde by various surfaces during gaseous decontamination. Appl Microbiol. 1970;20(5):765-769. [DOI] [PMC free article] [PubMed] [Google Scholar]
- 11. Luftman HS. Neutralization of formaldehyde gas by ammonium bicarbonate and ammonium carbonate. Appl Biosaf. 2005;10(2): 101-106. [Google Scholar]
- 12. ASTM International. Standard Practice for Maintaining Constant Relative Humidity by Means of Aqueous Solutions. Vol E104. ASTM International; 2012. [Google Scholar]
- 13. US Environmental Protection Agency. Determination of Formaldehyde in Ambient Air Using Adsorbent Cartridge Followed by High Performance Liquid Chromatography. US Environmental Protection Agency; 1999. [Google Scholar]
- 14. Zavitsas AA, Coffiner M, Wiseman T, Zavitsas LR. Reversible hydration of formaldehyde: thermodynamic parameters. J Phys Chem. 1970;74(14):2746-2750. [Google Scholar]
- 15. Matthews TG, Hawthorne AR, Thompson CV. Formaldehyde sorption and desorption characteristics of gypsum wallboard. Environ Sci Technol. 1987;21(7):629-634. [DOI] [PubMed] [Google Scholar]
- 16. Occupational Safety and Health Administration. Formaldehyde standard. 29 CFR 1910.1048 (2013). [Google Scholar]
- 17. Dong S, Dasgupta PK. Solubility of gaseous formaldehyde in liquid water and generation of trace standard gaseous formaldehyde. Environ Sci Technol. 1986;20(6):637-640. [DOI] [PubMed] [Google Scholar]
- 18. Ishida SI. Polymerization of formaldehyde and the physical-properties of the polymerization products: 1. J Appl Polym Sci. 1981;26(8):2743-2750. [Google Scholar]
- 19. Kowal SF, Allen SR, Kahan TF. Wavelength-resolved photon fluxes of indoor light sources: implications for HOx production. Environ Sci Technol. 2017;51(18):10423-10430. [DOI] [PubMed] [Google Scholar]
- 20. Gunschera J, Mentese S, Salthammer T, Andersen JR. Impact of building materials on indoor formaldehyde levels: effect of ceiling tiles, mineral fiber insulation and gypsum board. Build Environ. 2013;64:138-145. [Google Scholar]