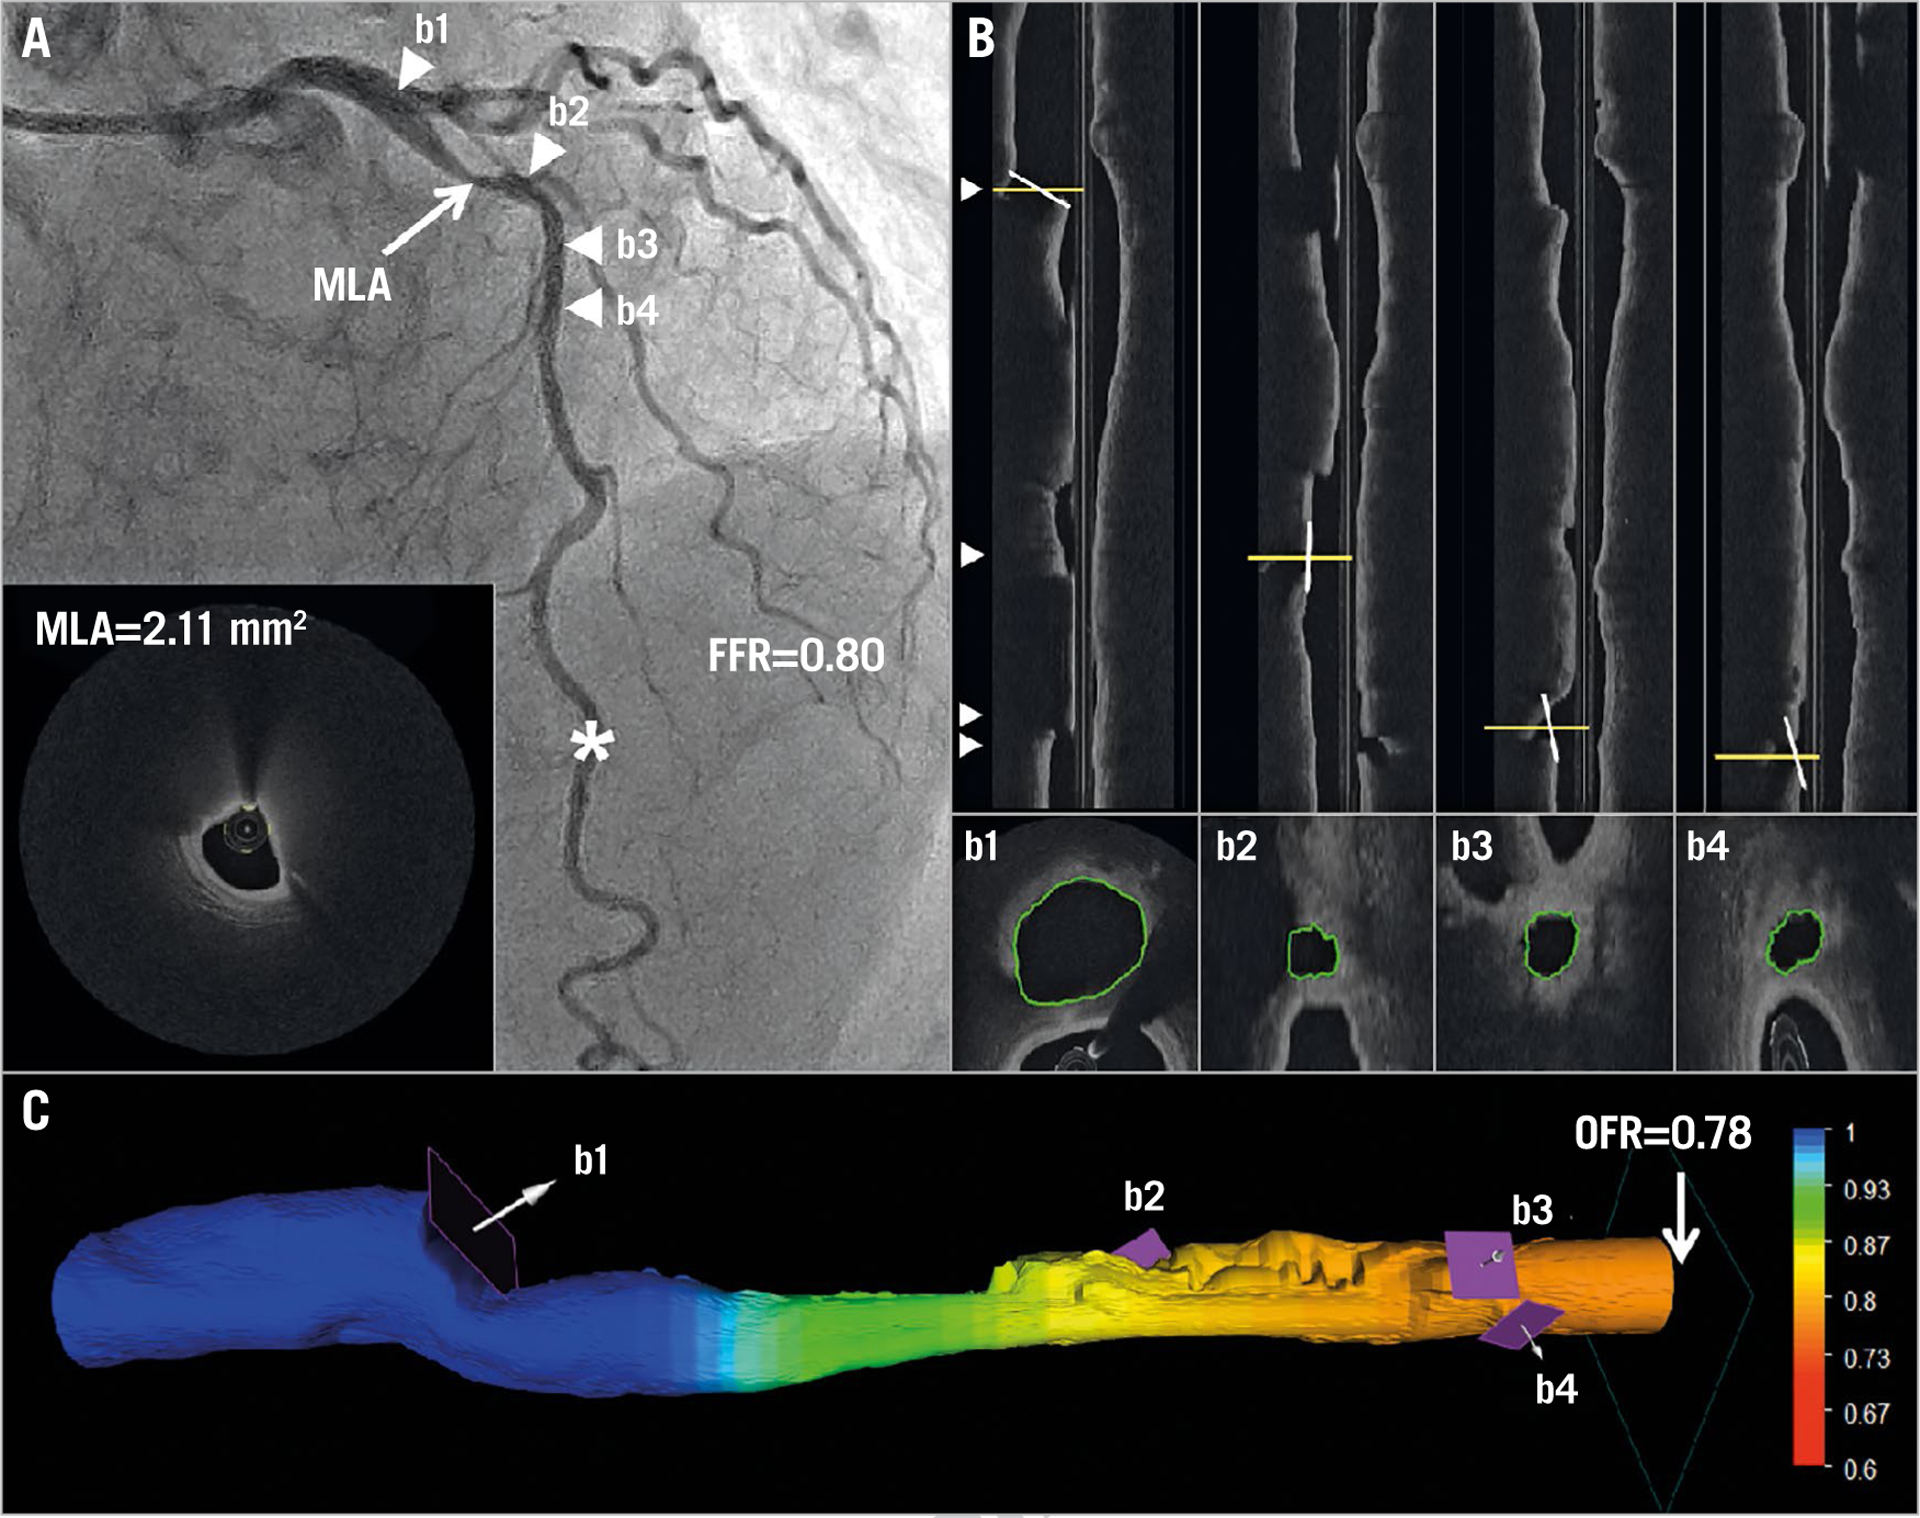
Figure 4.

Computation of OFR by OCT on a LAD with physiologically significant stenosis. A) Coronary angiography shows a LAD lesion; MLA by OCT is 2.11 mm². FFR measured by pressure wire at asterisk was 0.80. Four white triangles point to the positions of four side branches, which correspond with b1–b4 in panel B and in panel C. B) The four white lines in the OCT longitudinal views show the angulations of the cut-planes (b1–b4) perpendicular to the side branch centreline. The cut-planes were automatically reconstructed and the lumen of the side branch ostia in the cut-planes was automatically delineated. C) The computed OFR value was colour-coded and superimposed on the 3D reconstructed artery. In this case, the computed OFR was 0.78. FFR: fractional flow reserve; LAD: left anterior descending artery; MLA: minimal lumen area; OCT: optical coherence tomography; OFR: OCT-based FFR
