Abstract
The coordination of a carbonyl to a Lewis acid represents the first step in a wide range of catalytic transformations. In many reactions it is necessary for the Lewis acid to discriminate between starting material and product, and as a result, how these structures behave in solution must be characterized. Herein, we report the application of computational modeling to calculate properties of the solution interactions of acetone and benzaldehyde with FeCl3. Using these chemical models, we can predict spectral features in the carbonyl region of infrared (IR) spectroscopy. These simulated spectra are then directly compared to experimental spectra generated via titration-IR. We observe good agreement between theory and experiment, in that, between 0 and 1 equiv carbonyl with respect to FeCl3, a pairwise interaction dominates the spectra. When >1 equiv carbonyl is present, our theoretical model predicts two possible structures composed of 4:1 carbonyl to FeCl3, for acetone as well as benzaldehyde. When these predicted spectra are compared with titration-IR data, both structures contribute to the observed solution interactions. These findings suggest that the resting state of FeCl3-catalyzed carbonyl-based reactions employing simple substrates starts as a Lewis pair, but this structure is gradually consumed and becomes a highly ligated, catalytically less active Fe-centered complex as the reaction proceeds. An analytical model is proposed to quantify catalyst inhibition due to equilibrium between 1:1 and 4:1 carbonyl:Fe complexes.
Keywords: carbonyl–olefin metathesis, iron catalysis, byproduct inhibition, carbonyl:Fe complexes
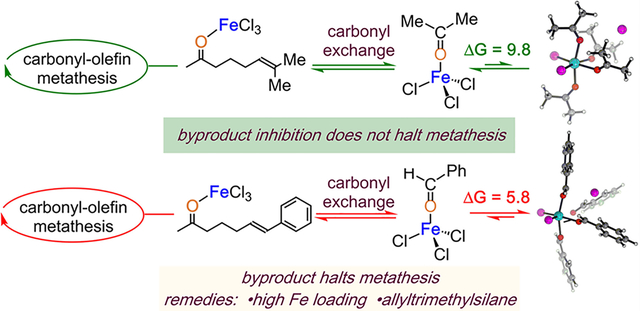
Graphical Abstract
INTRODUCTION
Historically, transformations involving carbonyl compounds have played a crucial role in synthetic organic chemistry. Lewis acids (LA) have been employed ubiquitously to activate carbonyl-containing compounds in synthetic organic methods.1–4 The underlying principle of LA activation operates via its ability to modify the electronic distribution of organic functionalities (e.g., carbonyls) that are capable of electron donation. Although the commonly accepted notion is that either the complex derived from a 1:1 Lewis pair (1)5–13 or a 2:1 carbonyl-Lewis acid complex (2)6,13–20 enables the reaction (Scheme 1a), the actual mode/structure that is responsible for the activation is not always obvious. For instance, Schindler et al. invoked alternative modes (3, 4) of LA activation of aliphatic ketones via a singly bridged homobimetallic dimer (4, Scheme 1b).21 Additionally, investigations involving simple carbonyls and LA carried out by the Devery lab revealed instances where LA can form complexes beyond the traditional 1:1 or 2:1 carbonyl-Lewis acid complexes (5, Scheme 1c).22 Taken together, these findings guide our understanding of the mechanistic intricacies associated with LA-promoted reactions such as Diels–Alder reactions,23 aldol reactions,1,24,25 ene reactions,26,27 and photochemical reactions.28,29
Scheme 1.
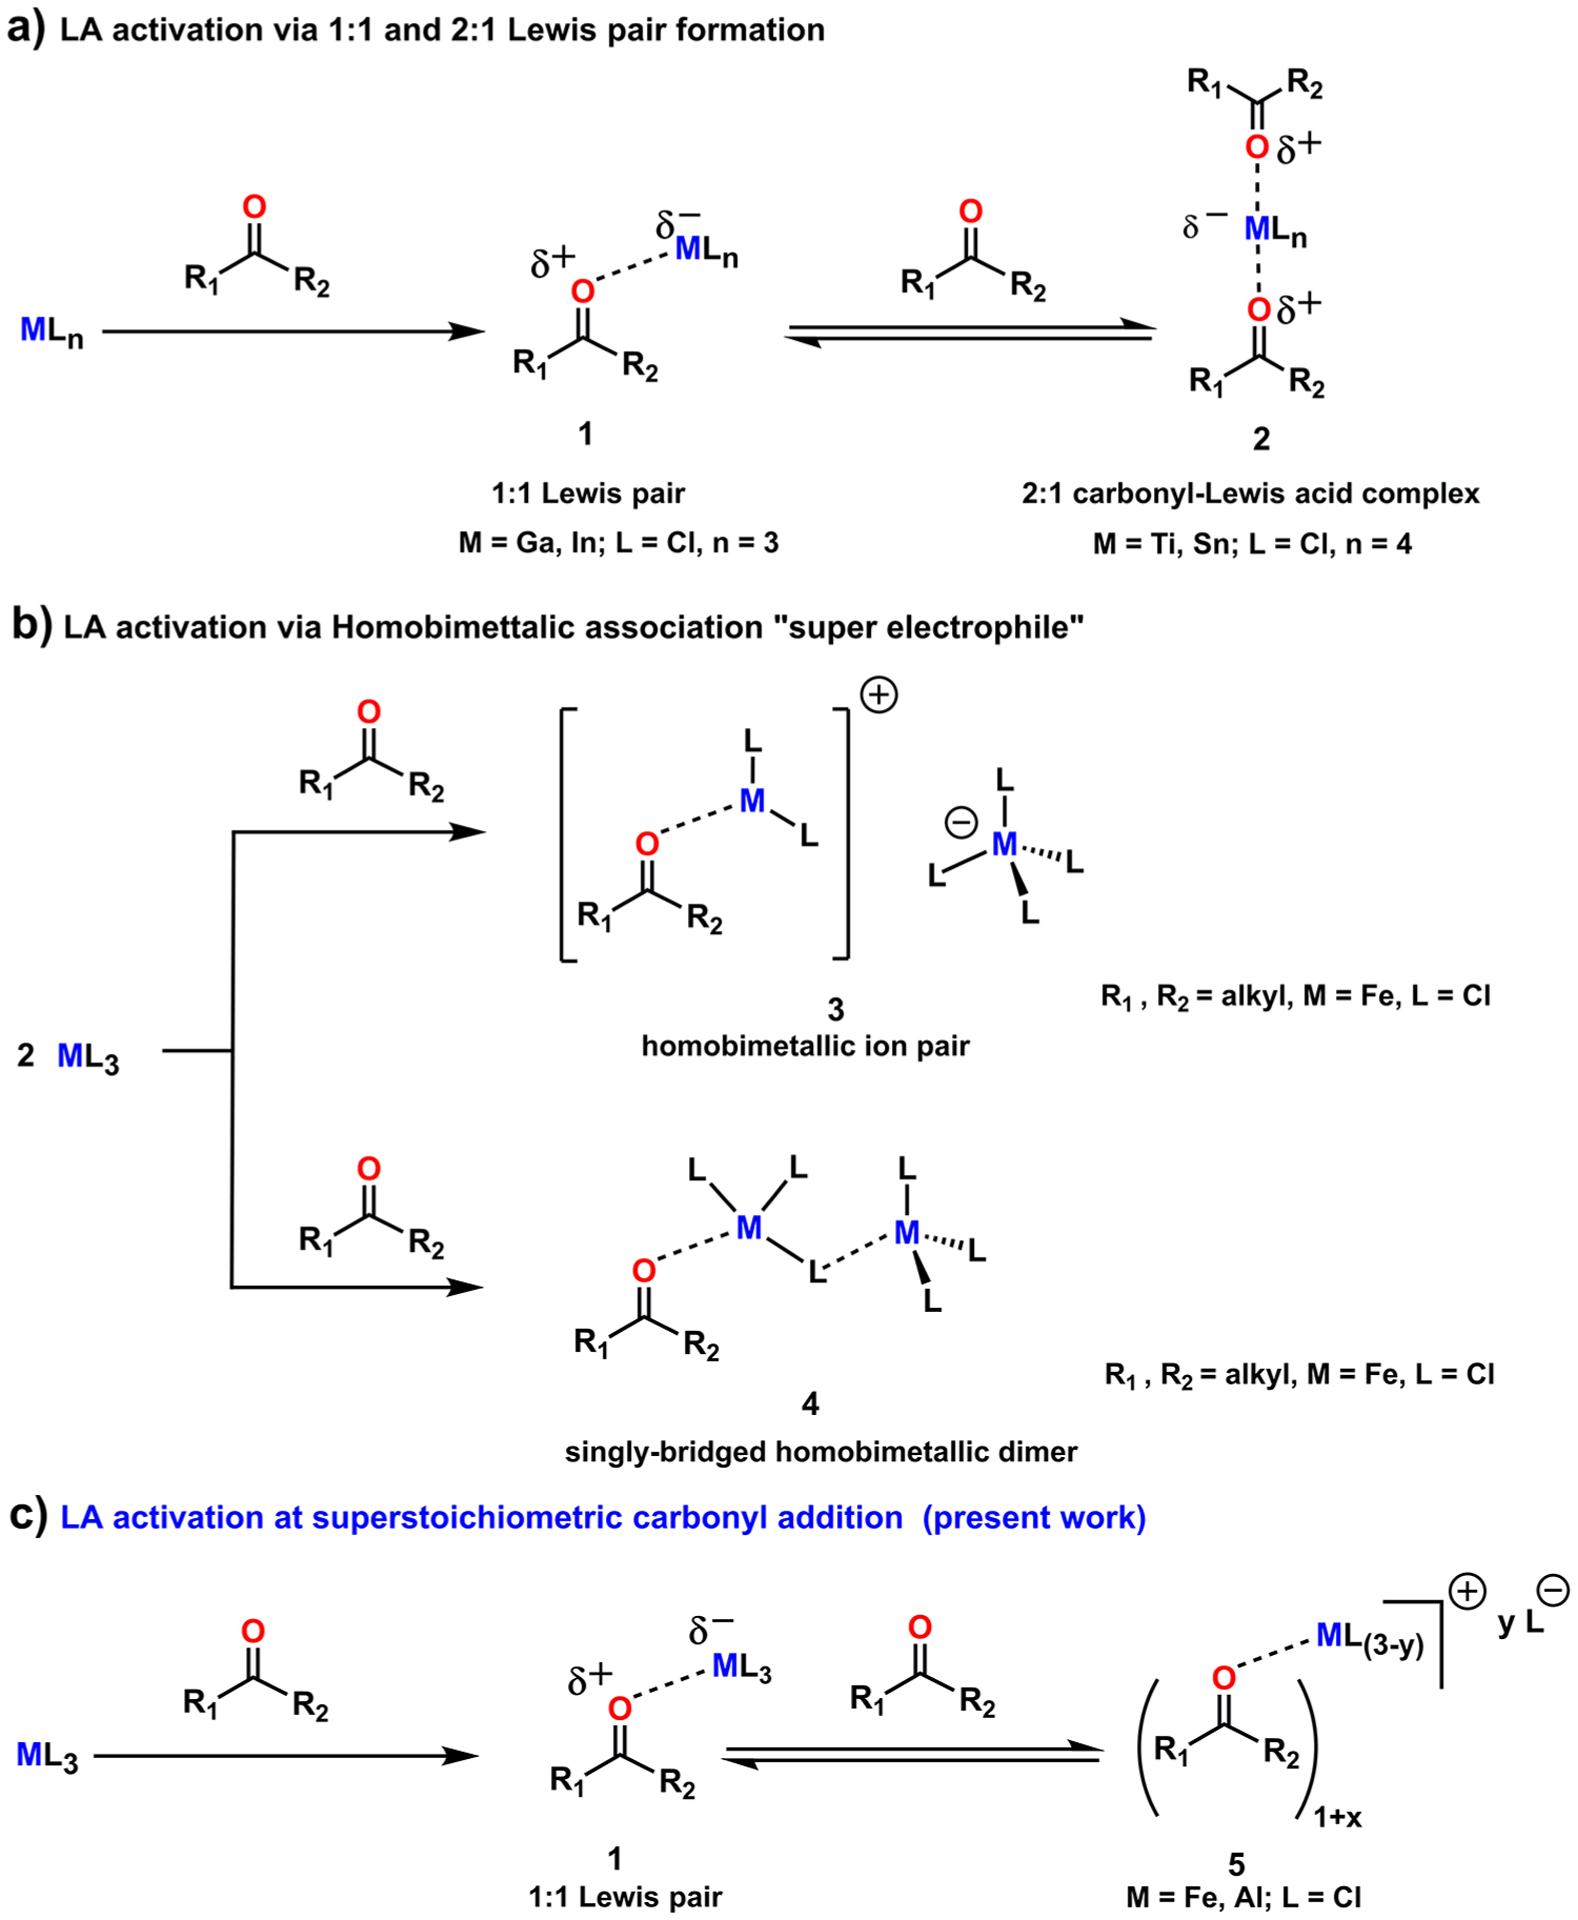
Different Modes of LA Activation of Carbonyl Substrate: (a) Classic Understanding of LA Activation via 1:1 and 2:1 Lewis Acid Complex Formation, (b) LA Activation via Homobimetallic Association, (c) LA Activation in the Presence of Superstochiometric Carbonyl in Solution
FeCl3-mediated carbonyl-olefin metathesis is an efficient method to construct complex molecular scaffolds starting from simple molecular building blocks involving carbonyl and olefin functionalities.30 In particular, this method has been successfully utilized in the synthesis of many cyclic motifs involving di- and trisubstituted cyclopentenes and cyclohexenes, polycyclic aromatic hydrocarbons,31 and 2,5-dihydropyrroles.32,33 Since then, a multitude of synthetic developments have expanded the utilization of Fe(III),21,31–35 as well as employing Ga(III),36,37 BF3·OEt2,38 montmorillonite, and I2.39 Mechanistic investigations conducted by the Schindler, Zimmerman, and Devery groups identified that the catalytic cycle (Scheme 2) initiates through the generation of activated coordination complex 7 via interaction of the iron(III) chloride with the Lewis basic carbonyl moiety of 6.40 Complex 7 then isomerizes into oxetane intermediate 8 through a turnover limiting asynchronous, concerted [2 + 2]-cycloaddition. Subsequently, 8 fragments into cycloalkene product 9 and carbonyl byproduct-Fe(III)-complex (1) via a retro-[2 + 2] cycloaddition. Finally, carbonyl exchange turns the catalyst over. This last crucial step, while seemingly simple, has tremendous implications on the success of the catalytic mechanism: byproduct 10 is itself a Lewis base (LB) which can potentially bind to the LA catalyst. Indeed, our group and others have witnessed that byproduct inhibition hinders catalysis via inefficient carbonyl exchange and through the formation of alternative catalyst structures (5) that potentially remain catalytically active to a different degree.41 Therefore, a detailed understanding of the solution behavior of the LA catalyst in the presence of substrate and carbonyl byproducts is needed to find reaction conditions that facilitate conversion of recalcitrant metathesis substrates.
Scheme 2.
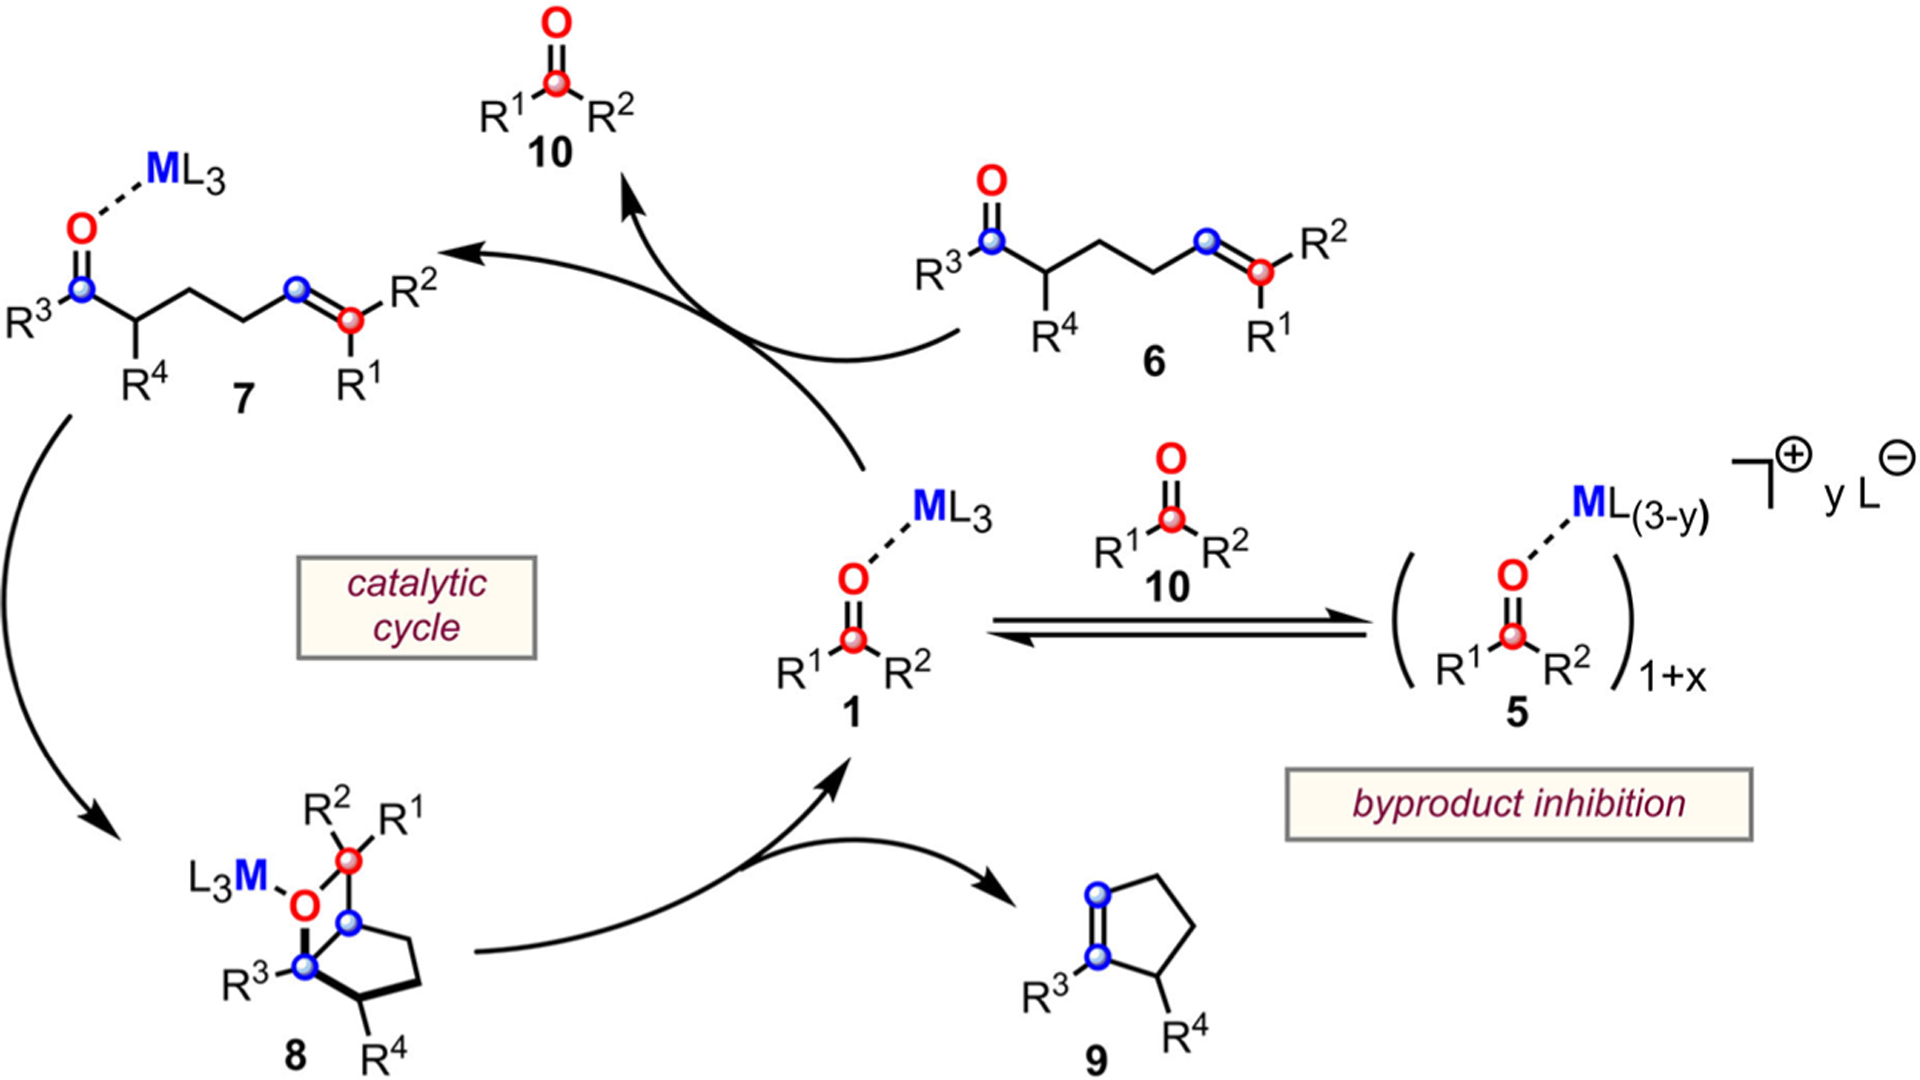
Proposed Mechanism of Carbonyl-Olefin Metathesis and Byproduct Inhibition
Studying the solution behavior of the catalyst in a mixture of metathesis substrates and typical carbonyl byproducts is inherently complex due to potential competitive binding to the catalyst center. Although techniques like solid-state infrared (IR) spectroscopy and X-ray crystallography have proven useful in characterizing the interactions of LA and LB under stoichiometric conditions in the solid phase, experimental methods to characterize carbonyl-LA interactions in solution via in situ NMR are even more limited for paramagnetic Lewis acids. Recently, the Devery group developed a method relying on in situ solution-phase IR spectroscopy and solution conductivity to investigate the solution interactions between metal halide LA and simple carbonyl compounds such as acetone, benzaldehyde, and acetophenone.22,41,42 With these detection methods, titrations into DCE containing LA as either a homogeneous solution (BF3, BCl3, InCl3, GaCl3, TiCl4, and SnCl4) or a heterogeneous slurry (FeCl3, AlCl3, and ZrCl4), facets of the Lewis pair interactions were observed. For instance, while no ground state complexation for ZnCl2 and CeCl3 was detected, 1:1 classic Lewis pairs involving BF3, BCl3, InCl3, and GaCl3 were detected. Alternatively, 2:1 coordination complexes (2, Scheme 1a) were observed when simple carbonyl compounds were added to TiCl4 and SnCl4. Interestingly, highly ligated complexes (5, Scheme 1c) were formed when superstoichiometric amounts of carbonyl were added to FeCl3 and AlCl3. Additionally, these highly ligated structures resulted in an increase in the solution conductivity, consistent with some number of the chloride ligands being displaced from the metal center to the outer sphere. This effect had the consequence of allowing additional equivalents of carbonyl to add to the metal center. Importantly, these data suggest that the system under consideration has an appreciable equilibrium concentration of a new cationic species (5) that can potentially alter the metathesis reaction mechanism. This removal of chloride from the inner sphere of Fe(III) is similar to the behavior of homobimetallic association; however, unlike the LA-mediated chloride removal in the homobimetallic system, conditions leading to LB-mediated removal of chloride result in a decrease in reaction rate.
Because of this dichotomous complexity, an in-depth understanding of the thermodynamics of the superstoichiometric carbonyl addition and associated kinetics for the ligand displacement is still lacking. Further investigation is therefore warranted to achieve systematic guiding principles for efficient catalysis involving carbonyls and metal halides. Computational modeling is a powerful tool in investigating probable structures for LA complexes and their spectral features. Herein, careful computational modeling and IR deconvolution studies provide structural insight into the formation of the complexes that result from the addition of simple carbonyls (acetone and benzaldehyde) to LA (FeCl3). We have chosen FeCl3 as the model LA due to its high utility in carbonyl-olefin metathesis, and of equal importance, its unusual solution behavior in the presence of simple carbonyl compounds. In particular, we report that two possible structures composed of 4:1 carbonyl to FeCl3 exist in the presence of superstoichiometric carbonyl, both of which contribute to the observed solution spectra. Furthermore, the implications of this highly ligated Fe-centered complex in inhibiting the catalytic activity are illustrated through an analytical model. This fundamental understanding of how the carbonyl specifically interacts with the LA in solution will promote the ability of synthetic chemists to develop efficient catalysis resulting in high yielding procedures.
Computational Details.
All quantum chemical calculations utilize density functional theory (DFT) as implemented in the Q-Chem 5.1 electronic structure program.43 Geometry optimizations were carried out using the B97-D44 density functional employing the double-ζ, 6–31+G* basis set. Initial transition state (TS) searches were performed using the reaction discovery tools of the Zimmerman group, in particular, the double-ended Growing String Method (GSM).45–47 GSM locates minimum energy reaction paths and the associated transition states, without requiring detailed prior knowledge of the transition state structures. To ascertain the true nature of all stationary points, normal-mode analysis was conducted at the B97-D/6–31+G* level of theory. These frequency computations were further used to assign theoretical IR spectra of the predicted structures. Following this, single-point solvent phase calculations on the gas phase optimized geometries were performed using the SMD48 solvent model, with 1,2-dichloroethane (DCE) as the solvent. SMD energies were computed using the ωB97X-D349 density functional and the def2-TZVP basis set in the ORCA quantum chemical package.50 The solvent-phase free energies, G(l), were obtained by scaling the corresponding vibrational frequencies and gas-phase entropies S(g), in order to account for the rotational and translational degrees of freedom in the solvent phase. Noncovalent interaction (NCI) analysis was performed using the NCIPLOT program.51,52 The high spin sextet state was found to be always lower in energy compared to other possible spin states (quartet, doublet) for all of the Fe3+ complexes investigated here. Reported energies for intermediates and activation barriers are solvent phase (DCE) free energies obtained using the ωB97X-D3/def2-TZVP level of theory in the sextet spin state (see S2 in the Supporting Information (SI) for full computational details).
RESULTS AND DISCUSSIONS
FeCl3–Acetone System.
Titration-IR provides the ability to compare the relative amount of free carbonyl compound with the complex formed between acetone (Ac) and LA (FeCl3, Fc). Under anhydrous conditions, Fc is largely insoluble in DCE, so Ac was titrated to a 12 mL slurry of Fc (2 mmol, Figure 1a) to bring Fc into solution. As Ac is added to the slurry, a concentration-dependent progression of observations occurs. Beginning from 0 to 1 equiv of Ac, a single vibration at 1633 cm−1 (Figure 1b) appears. Additionally, the system undergoes a phase transition from heterogeneity to homogeneity upon the addition of 1 equiv Ac, consistent with the formation of Lewis pair A in solution (see S3 in the SI for details).
Figure 1.
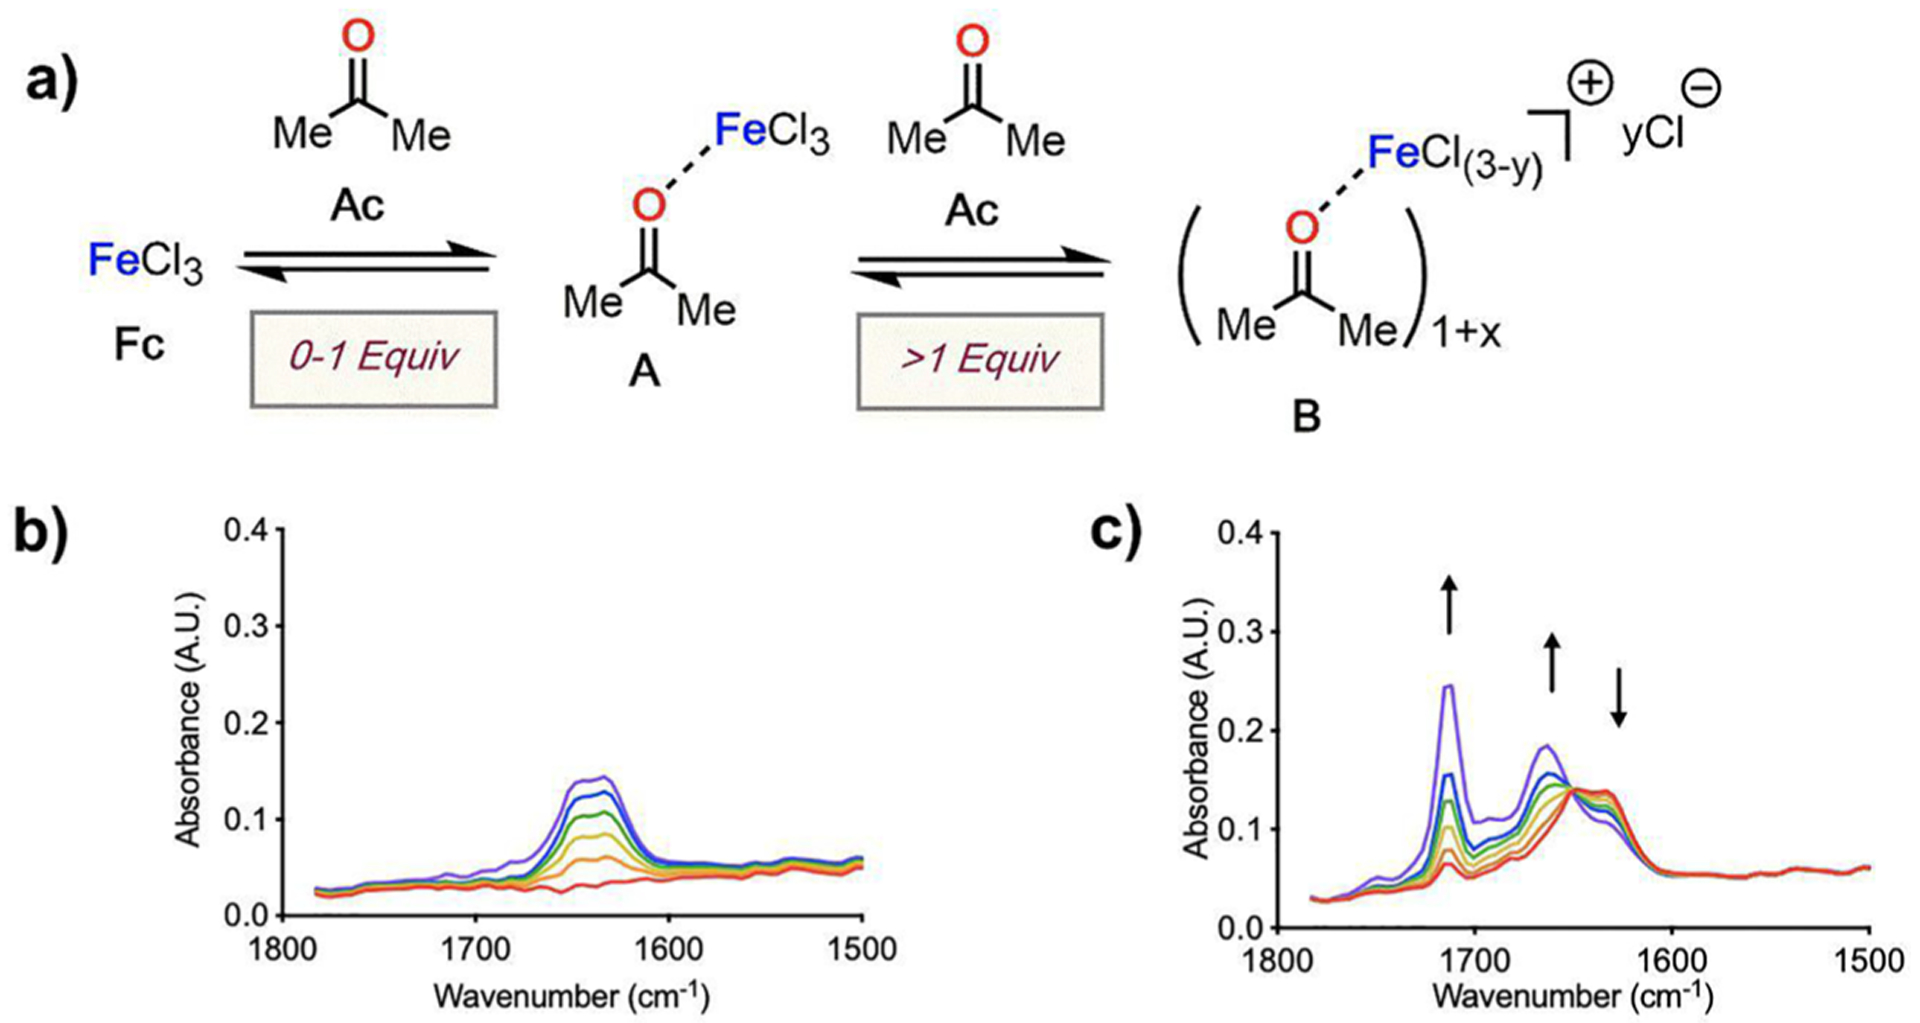
(a) Proposed concentration-dependent interactions between Fc (2 mmol in 12 mL DCE) and Ac. (b) Solution IR spectra at 0–1 equiv Ac and (c) beyond 1 equiv Ac addition.
Continued titration beyond 1 equiv Ac yields an isosbestic point at 1648 cm−1, a decrease in the peak at 1633 cm−1, an increase in the peak at 1714 cm−1 (free/unbound Ac), and the addition of a collection of vibrations intermediate between Ac and A (Figure 1c). These observations are consistent with the possible formation of a new species B beyond 1 equiv Ac. Inspection of the titration data suggests that the formation of species B requires three additional equivalents Ac to consume A, displacing a chloride to the outer sphere, which is consistent with conductivity measurements performed on the titration in parallel.41 The system at 1 equiv Ac, however, displays similar spectral features as the system at 5 equiv Ac, suggesting that complex A is proceeding to a mixture of A, Ac, and B via a single observed transition about one isosbestic point.
To better understand the structure and characteristics of the Fc and Ac combination, quantum chemical modeling was carried out (see S4 in the SI). The investigations reveal that the formation of the tetrahedral 1:1 complex (11) from Fc and Ac is thermodynamically favorable (ΔG = −25.8 kcal/mol, ΔH = −29.9 kcal/mol) in DCE. Consistent with the large enthalpy of complex formation, the C=O stretching frequency of 11 is predicted to be significantly lower (1639 cm−1) than that in free Ac (1738 cm−1; Figure 2a, left). The stoichiometric composition and the C=O stretching frequency of 11 is consistent with the experimental observations in the region of 0–1 equiv of Ac (Figure 1b). Thus, it is reasonable to assign 11 as the structure of the 1:1 complex A (Figure 1a).
Figure 2.
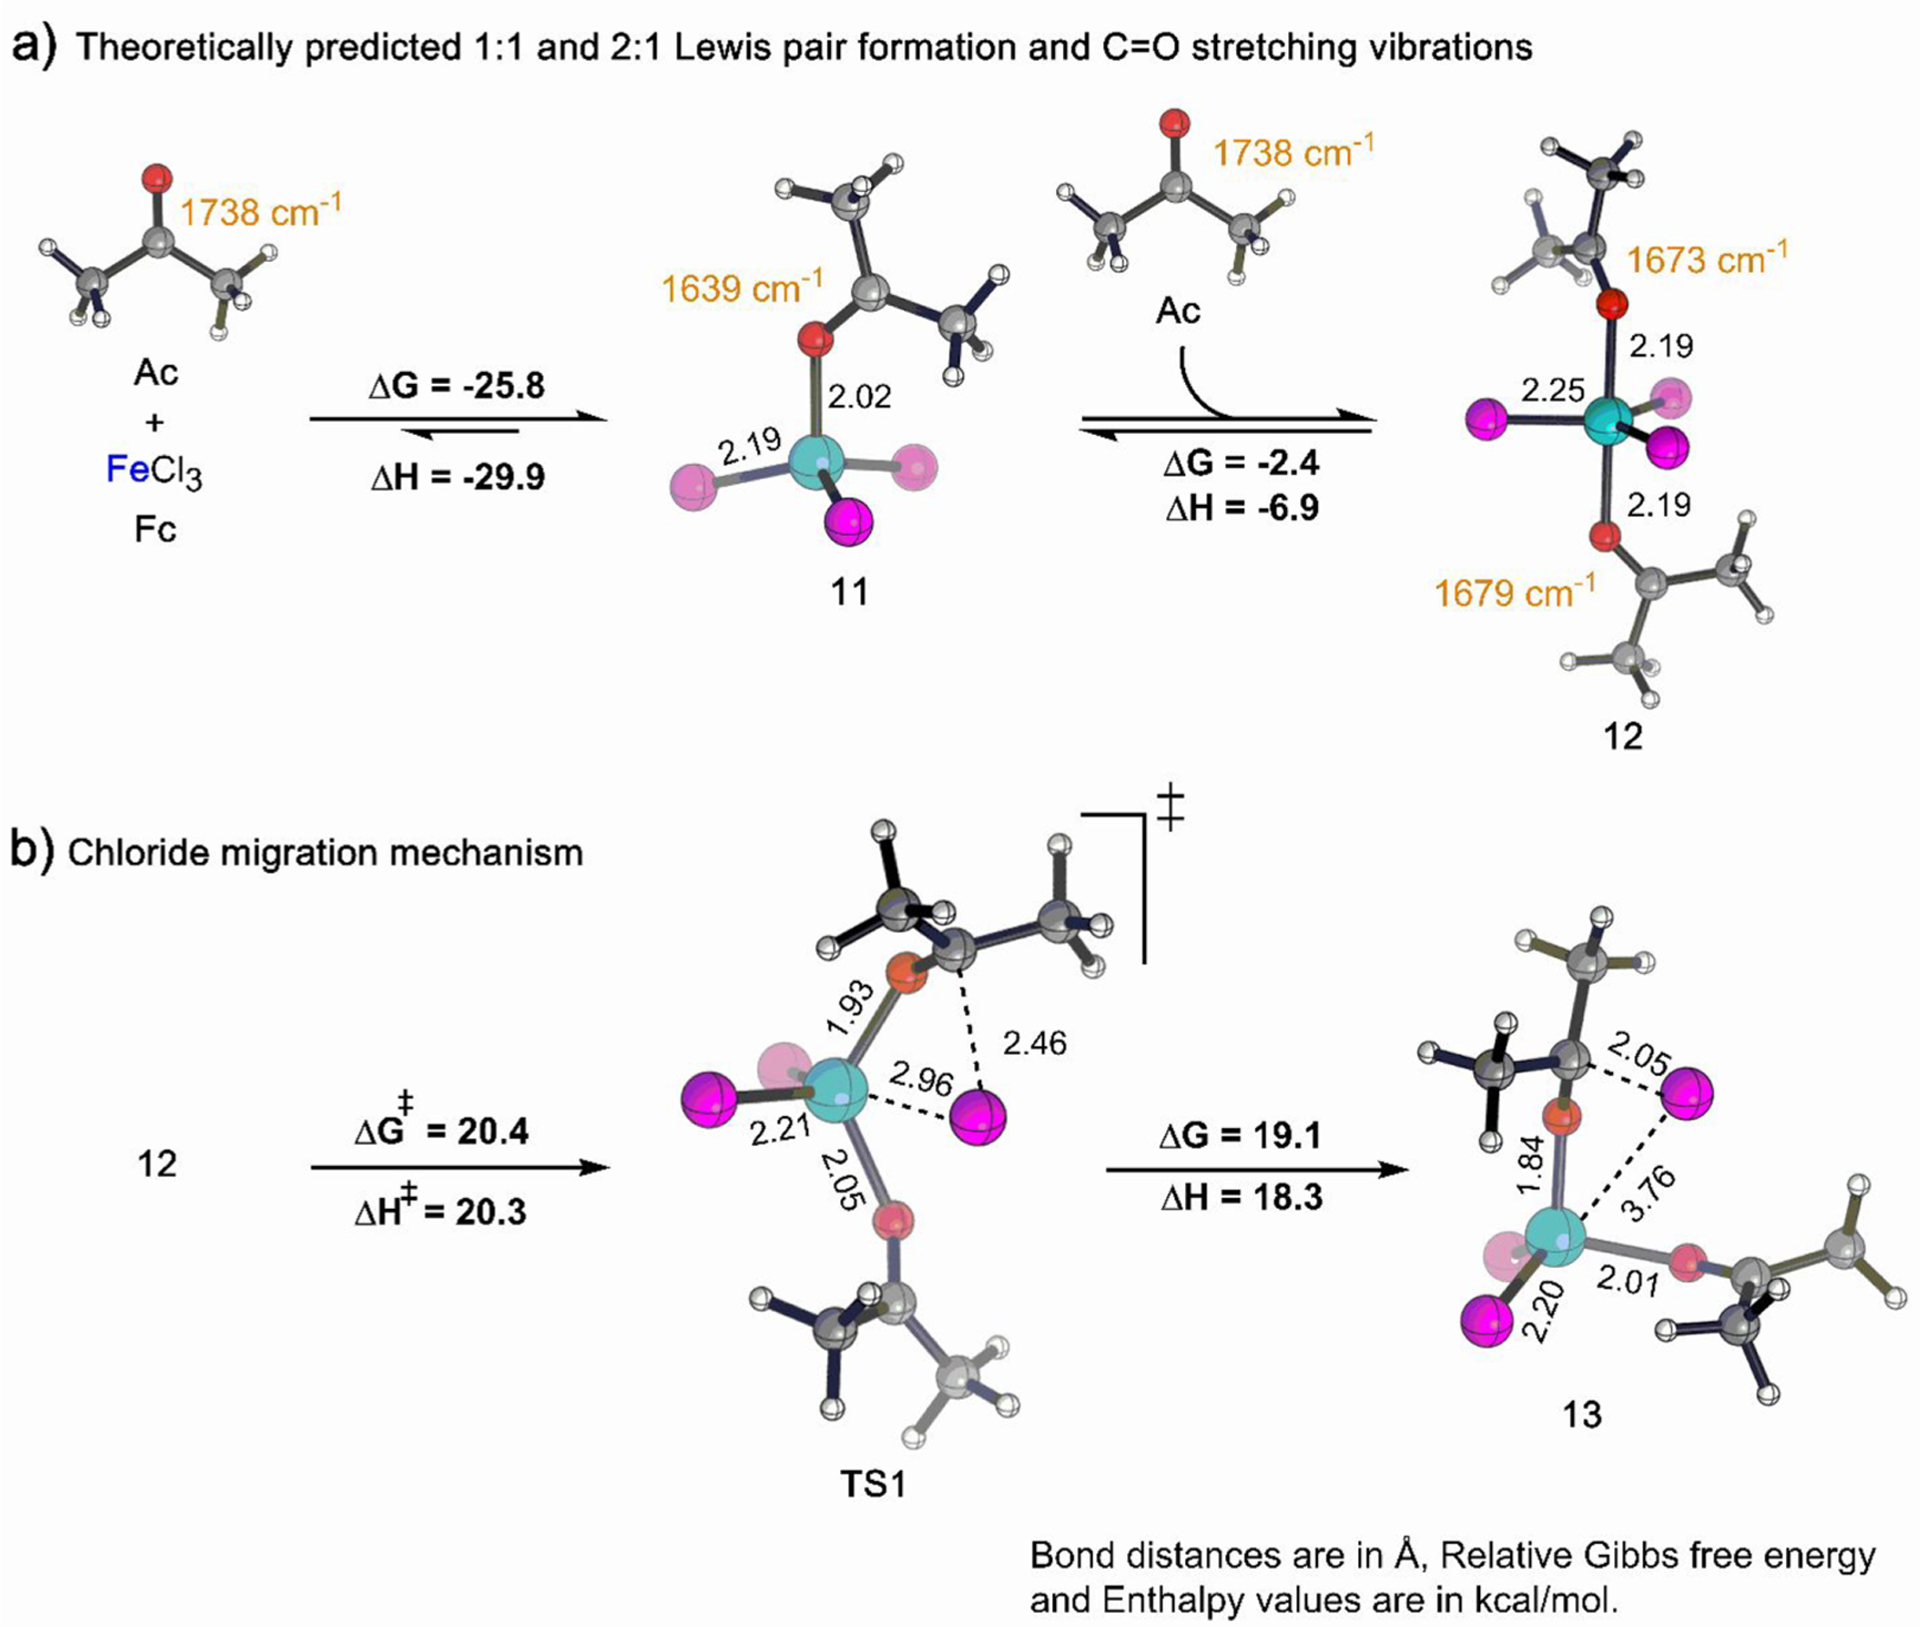
Theoretically predicted thermodynamics and C=O IR stretching frequency (cm−1) of (a) 1:1 and 2:1 complex formed from Fc and Ac and (b) thermodynamics of chloride migration. Reaction energies (kcal/mol) were obtained at ωb97X-D3/def2-TZVP/SMD(DCE) level of theory. Color code: Fe, cyan; Cl, magenta; O, red; C, gray; H, white.
Next, reactions of 11 in the presence of higher equivalents of Ac were examined. Quantum chemical modeling suggests a trigonal bipyramidal 2:1 complex (12) is in equilibrium with 11. The ΔG of formation of 12 from 11 is predicted to be only −2.4 kcal/mol (ΔH = −6.9 kcal/mol). The simulated C=O stretching frequencies in 12 are predicted to be at 1673 and 1679 cm−1 (Figure 2a, right).
Octahedral iron complexes with 3:1 Ac:Fc stoichiometry were then examined. Here, an octahedral iron complex where the third Ac lies trans to one of the chlorides was envisioned. No species of this type was found to be a stable intermediate, indicating that 12 cannot simply bind the third equivalent of Ac. To form a 3:1 Ac:Fc complex, simulations show that one of the chlorides needs to be detached from the inner coordination sphere of 12, creating space for the third equiv of Ac in the inner coordination sphere of Fe. The migration of a chloride ion from the Fe center proceeds through TS1 with an associated free energy barrier of 20.4 kcal/mol (ΔH‡ = 20.3 kcal/mol) and results in the tetrahedral complex 13 (see S5 in the SI), which is 19.1 kcal/mol uphill from 12 (ΔH = 18.3 kcal/mol, Figure 2b). Intermediate 13 is accessible mechanistically but not thermodynamically as its direct formation from 12 is significantly endoergic. However, the complexation process can pass through this intermediate to access more highly Ac-ligated Fe species that appear later on. Overall, the predicted mobility of chloride is consistent with the experimentally observed increase in solution conductivity beyond 1 equiv of Ac addition.41
Thus, our simulation shows that the 3:1 trigonal bipyramidal complex (14) lies 16.9 kcal/mol above 11 and free Ac in the free energy landscape (ΔH = 7.5 kcal/mol, Figure 3a). The theoretically simulated C=O stretching frequencies in 14 are predicted to be at 1669 and 1683 cm−1 (Figure 3a). Contrastingly, the third equiv of Ac in 14 results in a vibration appearing at 1318 cm−1 (see S6 in the SI), which is considerably red-shifted from the C=O vibration seen in free Ac (1738 cm−1). This shift suggests that the strength of the C=O π bond of the third Ac ligand is significantly reduced, most likely due to substantial charge transfer from the nearby chloride ion (C−Cl distance 2.14 Å, Figure 3a) to the antibonding C=O π* orbital.
Figure 3.
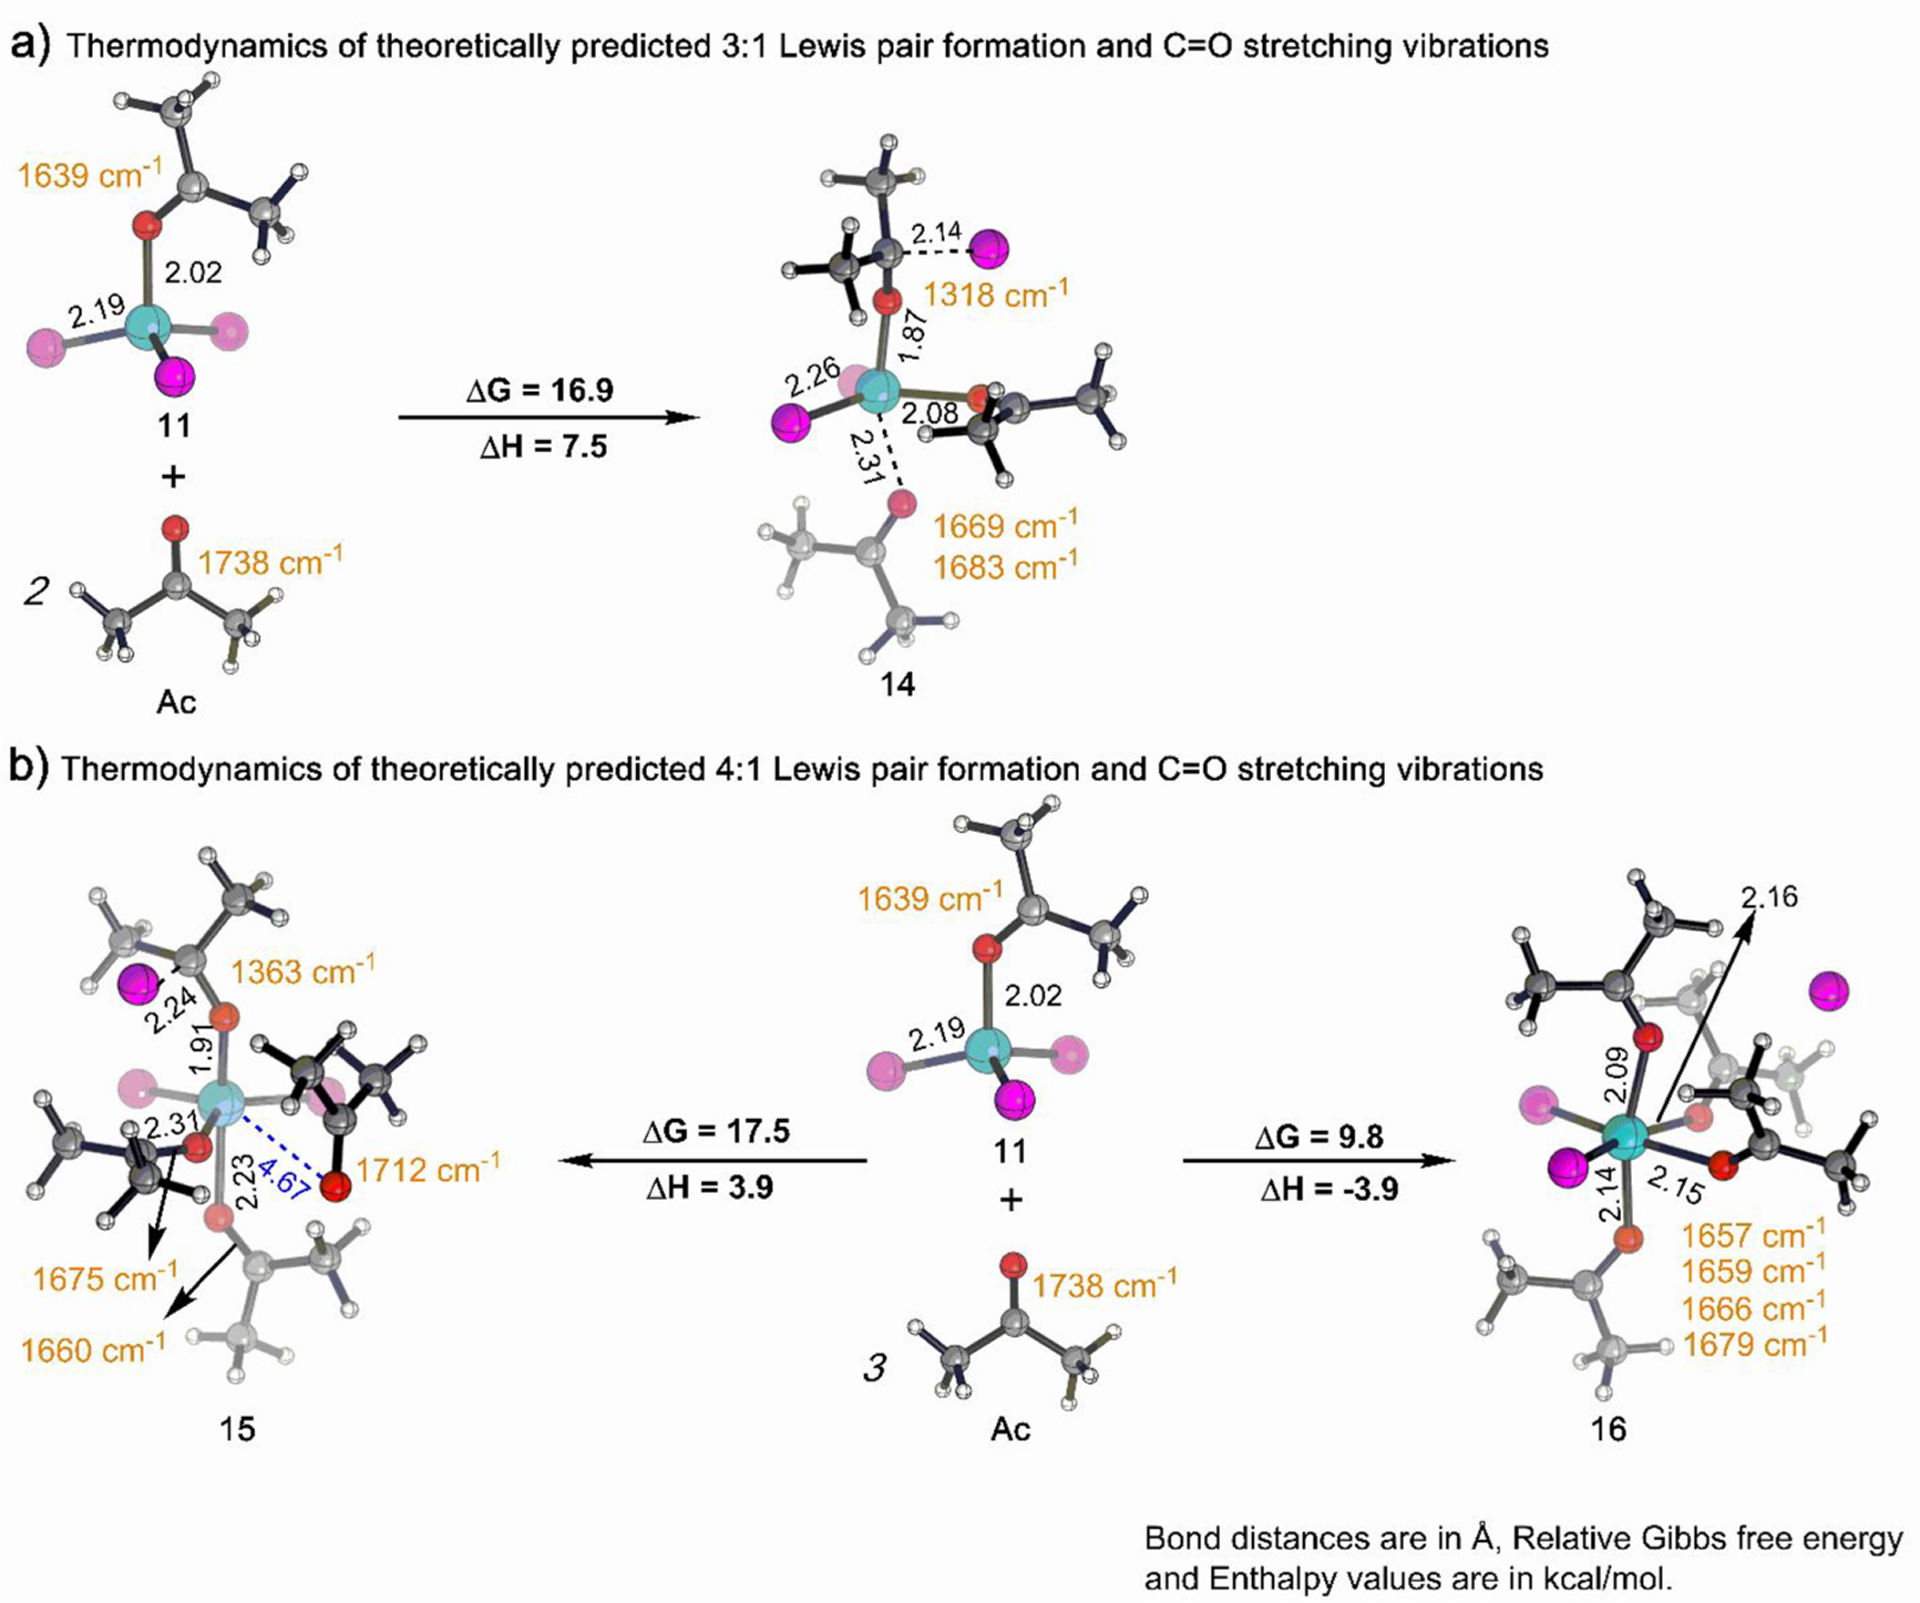
Theoretically predicted thermodynamics and C=O IR stretching frequency (cm−1) of (a) 3:1 and (b) 4:1 complex formed from Fc and Ac. Reaction energies (kcal/mol) were obtained at ωb97X-D3/def2-TZVP/SMD(DCE) level of theory. Color code: Fe, cyan; Cl, magenta; O, red; C, gray; H, white.
The quantum chemical modeling studies predicted two possible structures (15 and 16) for the 4:1 Lewis complex. Species 15 is essentially a trigonal bipyramidal complex with a weakly associated Ac (see S4 in the SI). 15 is predicted to lie 17.5 kcal/mol above from 11 and Ac in the free energy landscape (Figure 3b, left). The weak coordination of the fourth Ac to the Fe center is evident from the longer bond distance (4.67 Å; Figure 3b, left) compared to the other three molecules of Ac (bond distances are 1.93, 2.23, and 2.31 Å). Noncovalent interaction (NCI) analysis of 15 indicates that the fourth Ac fits in the coordination pocket of Fe via dispersion interactions; whereas, the other three equiv of Ac are attached via strong interactions through lone-pair donation as displayed by green isosurfaces and blue disks, respectively, in Figure 4a. This inequivalency in the attachment of each Ac ligand is also reflected in the simulated IR spectra, where C=O stretching peaks exist at 1363, 1660, 1675, and 1712 cm−1 (Figure 3b, left). The appearance of the peak at 1712 cm−1 is consistent with the fourth equivalent of Ac being weakly bound. The remaining peak at 1363 cm−1 is associated with the strongly perturbed Ac by the nearby chloride ion (C−Cl distance 2.24 Å, Figure 3b, left) which is similar to that of species 14 (see S6 in the SI).
Figure 4.
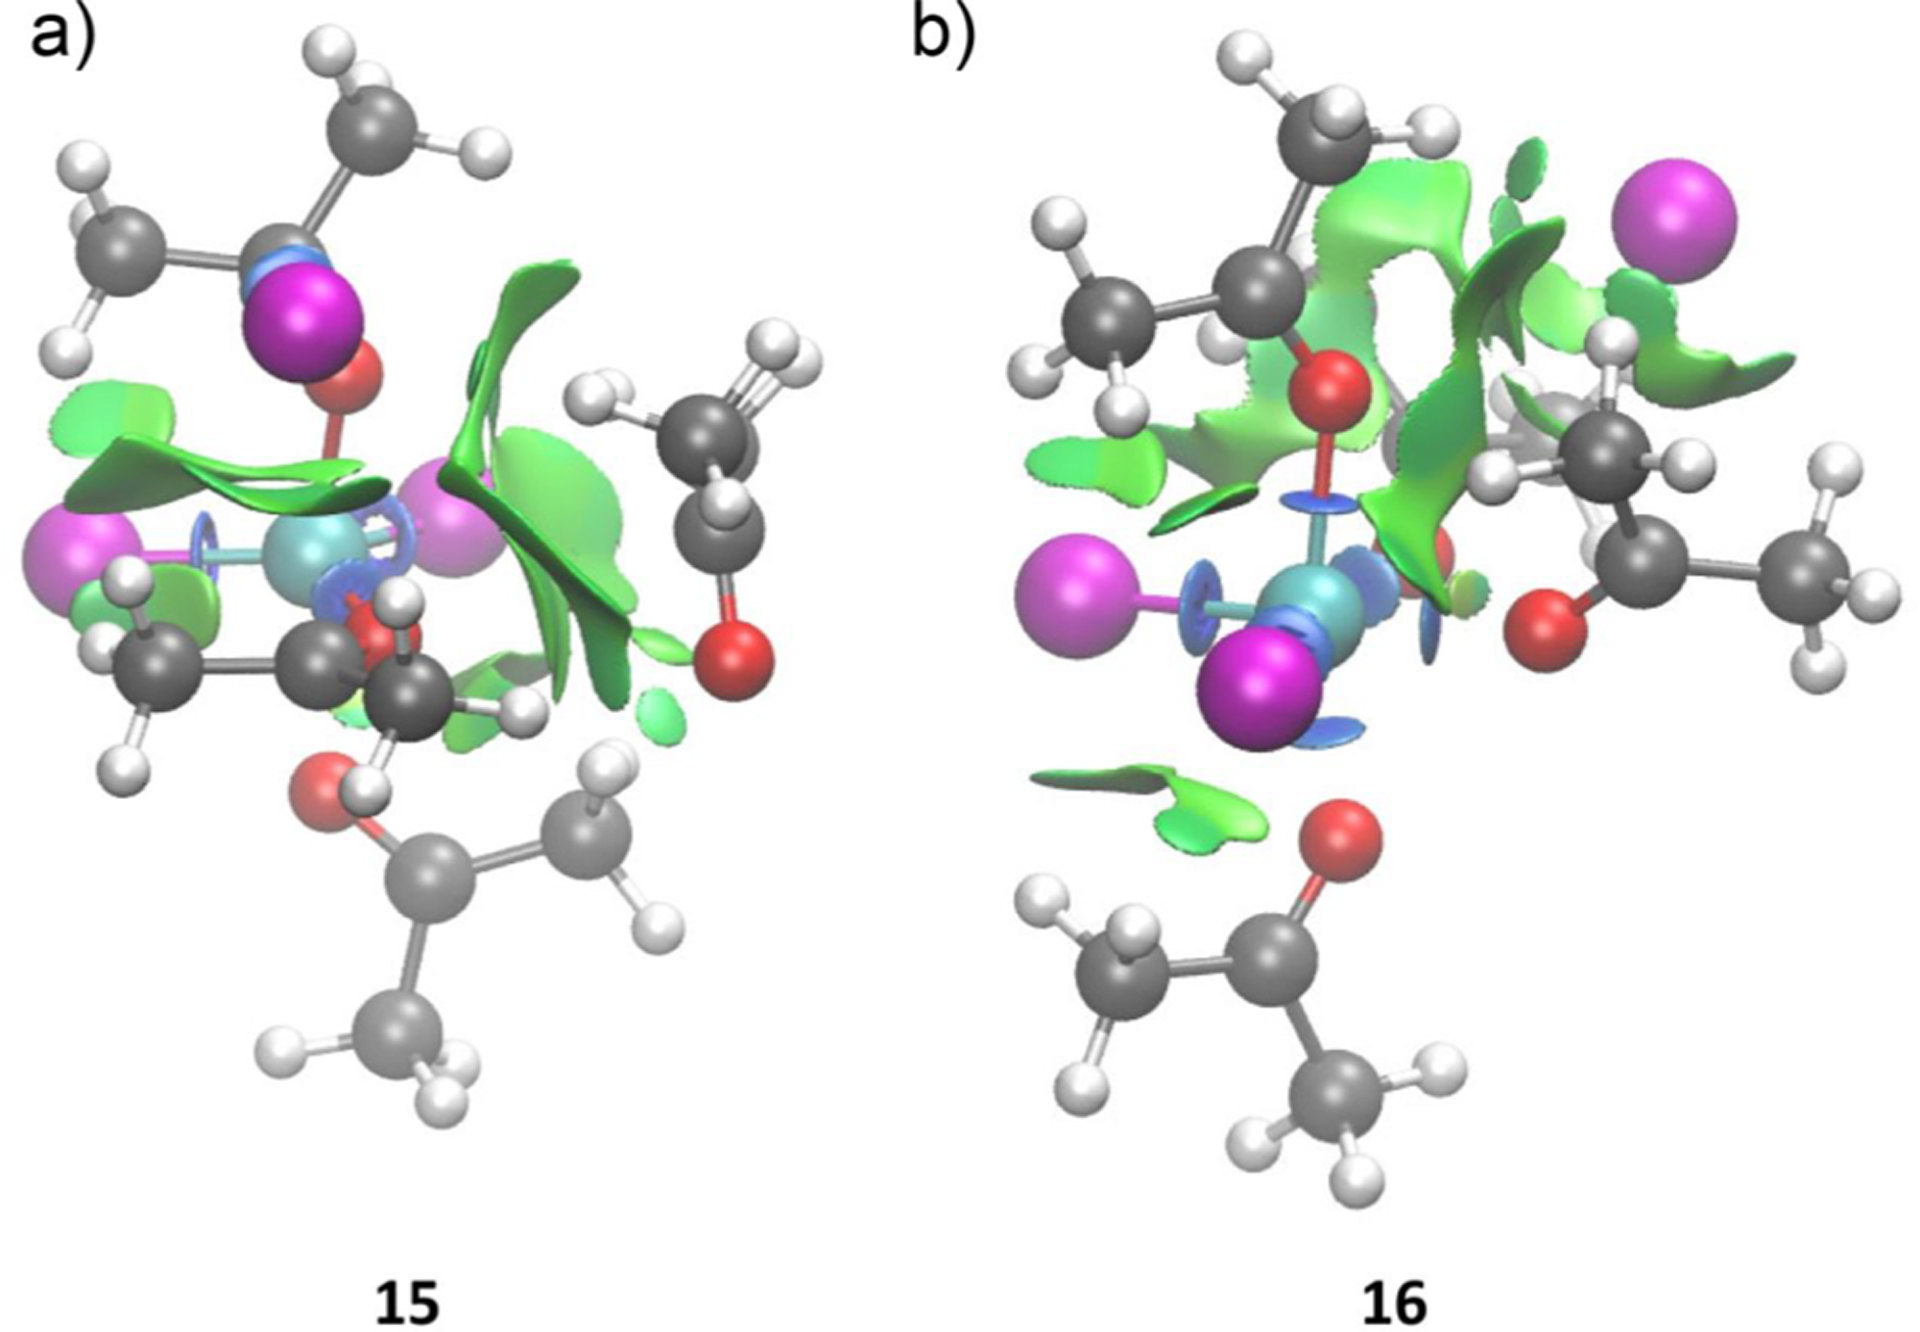
NCI surfaces of species (a) 15 and (b) 16. Color code: Fe, cyan; Cl, magenta; O, red; C, gray; H, white.
Alternatively to 15, a second 4:1 complex (16) is octahedral and 7.7 kcal/mol more stable than 15 (Figure 3b, right). This observation is consistent with the NCI analysis of 16 which indicates that all four Ac ligands are coordinated to the Fe center via strong interactions through lone-pair donation as depicted by the blue disks in Figure 4b. Moreover, in sharp contrast to 15, all four Ac ligands in 16 are in similar chemical environments indicated by their predicted C=O stretching peaks at 1657, 1659, 1666, and 1679 cm−1 (Figure 3b, right). Furthermore, the chloride ion in 16 is not bound to any particular chemical moiety, but instead is bound to the Fe complex by electrostatics. This predicted separation is consistent with the experimentally observed increase in solution conductivity upon superstoichiometric Ac addition. Note that although the predicted free energies indicate that there should be 12 present in the reaction mixture, its discrete identification in the experiments is challenging as there is a significant overlap between theoretically simulated peaks of 12 (1673 and 1679 cm−1) and 15+16 (1657, 1659, 1660, 1666, 1675, and 1679 cm−1; see discussion S14 in SI).
FeCl3–Benzaldehyde System.
Complexes generated from the interaction between Fc and the LB benzaldehyde (Be) were the next focus of our investigations. Titration-IR enabled comparison of the relative amount of free carbonyl compound with the complex formed from Fc and Be (Figure 5a). When 0–1 equiv of Be was added to a slurry of Fc (2 mmol) in DCE (12 mL), a single species with vibrations at 1610, 1592, and 1569 cm−1 was observed, and no unbound Be at 1704 cm−1 was detected (Figure 5b). Just like the combination of Fc and Ac, the system transitions from heterogeneity to homogeneity upon the addition of 1 equiv Be, suggesting the formation of 1:1 Lewis pair C (Figure 5a).
Figure 5.
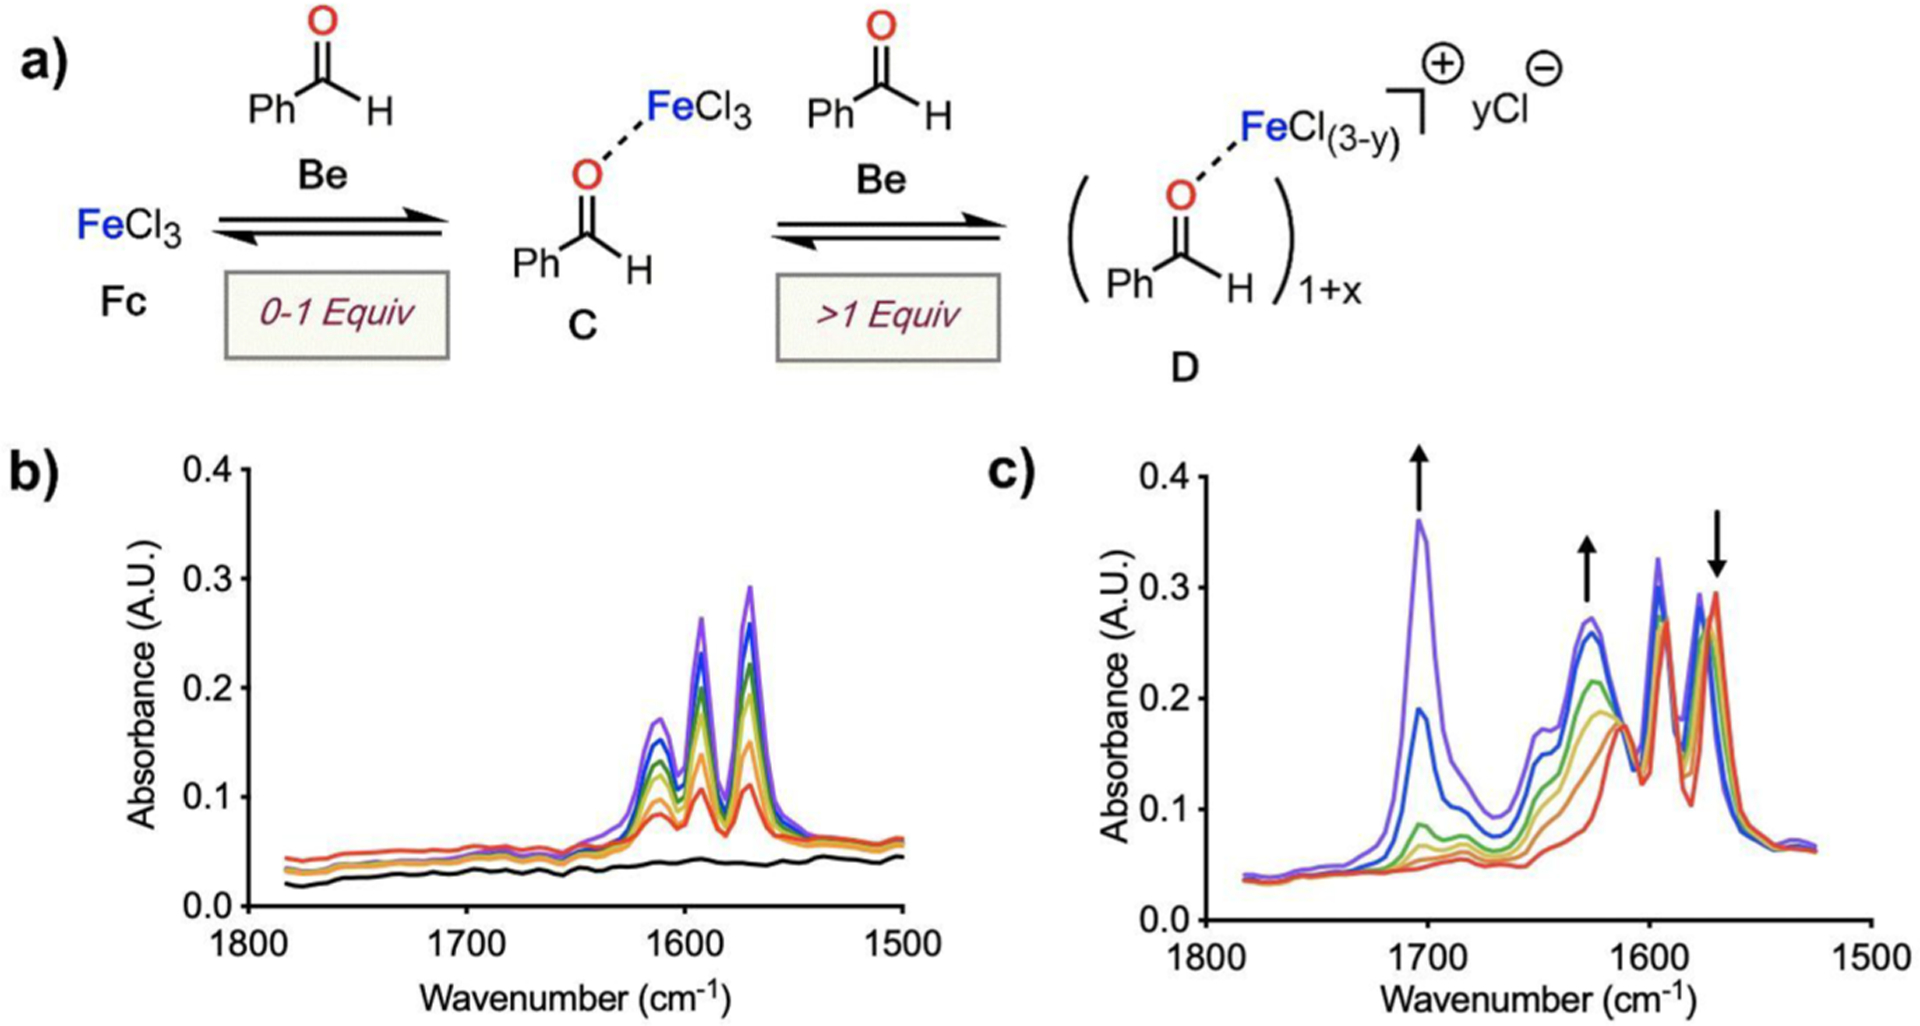
(a) Proposed concentration-dependent interactions complexes between Fc (2 mmol in 12 mL DCE) and Be. (b) Solution IR spectra at 0–1 equiv Be and (c) beyond 1 equiv Be addition.
Complicated behavior was noted for titrations beyond 1 equiv of carbonyl. Continuation yields an isosbestic point at 1574 cm−1, a decrease in the peak at 1569 cm−1, and growing intensity in the peaks at 1577 and 1626 cm−1. Simultaneously, the intensity of the signal for free/unbound Be grows at 1704 cm−1 and an additional collection of vibrations intermediate between C and Be appears (Figure 5c). A new species (D) is likely formed beyond 1 equiv Be (Figure 5a). Inspection of the titration data suggests that formation of species D requires three additional equiv Be to consume C, displacing a chloride to the outer sphere, which is consistent with conductivity measurements performed on the titration in parallel.41 At 1 equiv Be the system displays similar spectral features as at 5 equiv Be, suggesting that complex C is proceeding to a mixture of C, Be, and D via a single transition with at least one isosbestic point at 1574 cm−1.
Quantum chemical modeling provides further insights into the structure and characteristics of the complexes involving Fc and Be. The investigations reveal that the formation of tetrahedral 1:1 complex 17 from Fc and Be is highly thermodynamically favorable (ΔG = −21.8 kcal/mol, ΔH = −26.2 kcal/mol) in DCE. In unbound Be, along with the C=O vibration at 1716 cm−1, there are two weakly absorbing peaks at 1600 and 1581 cm−1 due to C=C stretching vibrations in the aromatic ring. In the 1:1 Lewis pair 17, however, these aromatic C=C peaks mix with the red-shifted C=O stretch. Therefore, unlike the Lewis pair complexes of Ac, three vibrations in the region of 1700–1500 cm−1 were observed for complexes involving Be. The three vibrations of 17 are predicted to be 1628, 1599, and 1569 cm−1, and are generally lower in energy than those of free Be (1716, 1600, and 1581 cm−1; Figure 6, left). The stoichiometric composition and the C=O stretching frequency of 17 is consistent with experimental observations in the region of 0–1 equiv of Be (Figure 5a). Thus, it is reasonable to assign 17 as 1:1 complex C (Figure 5a).
Figure 6.
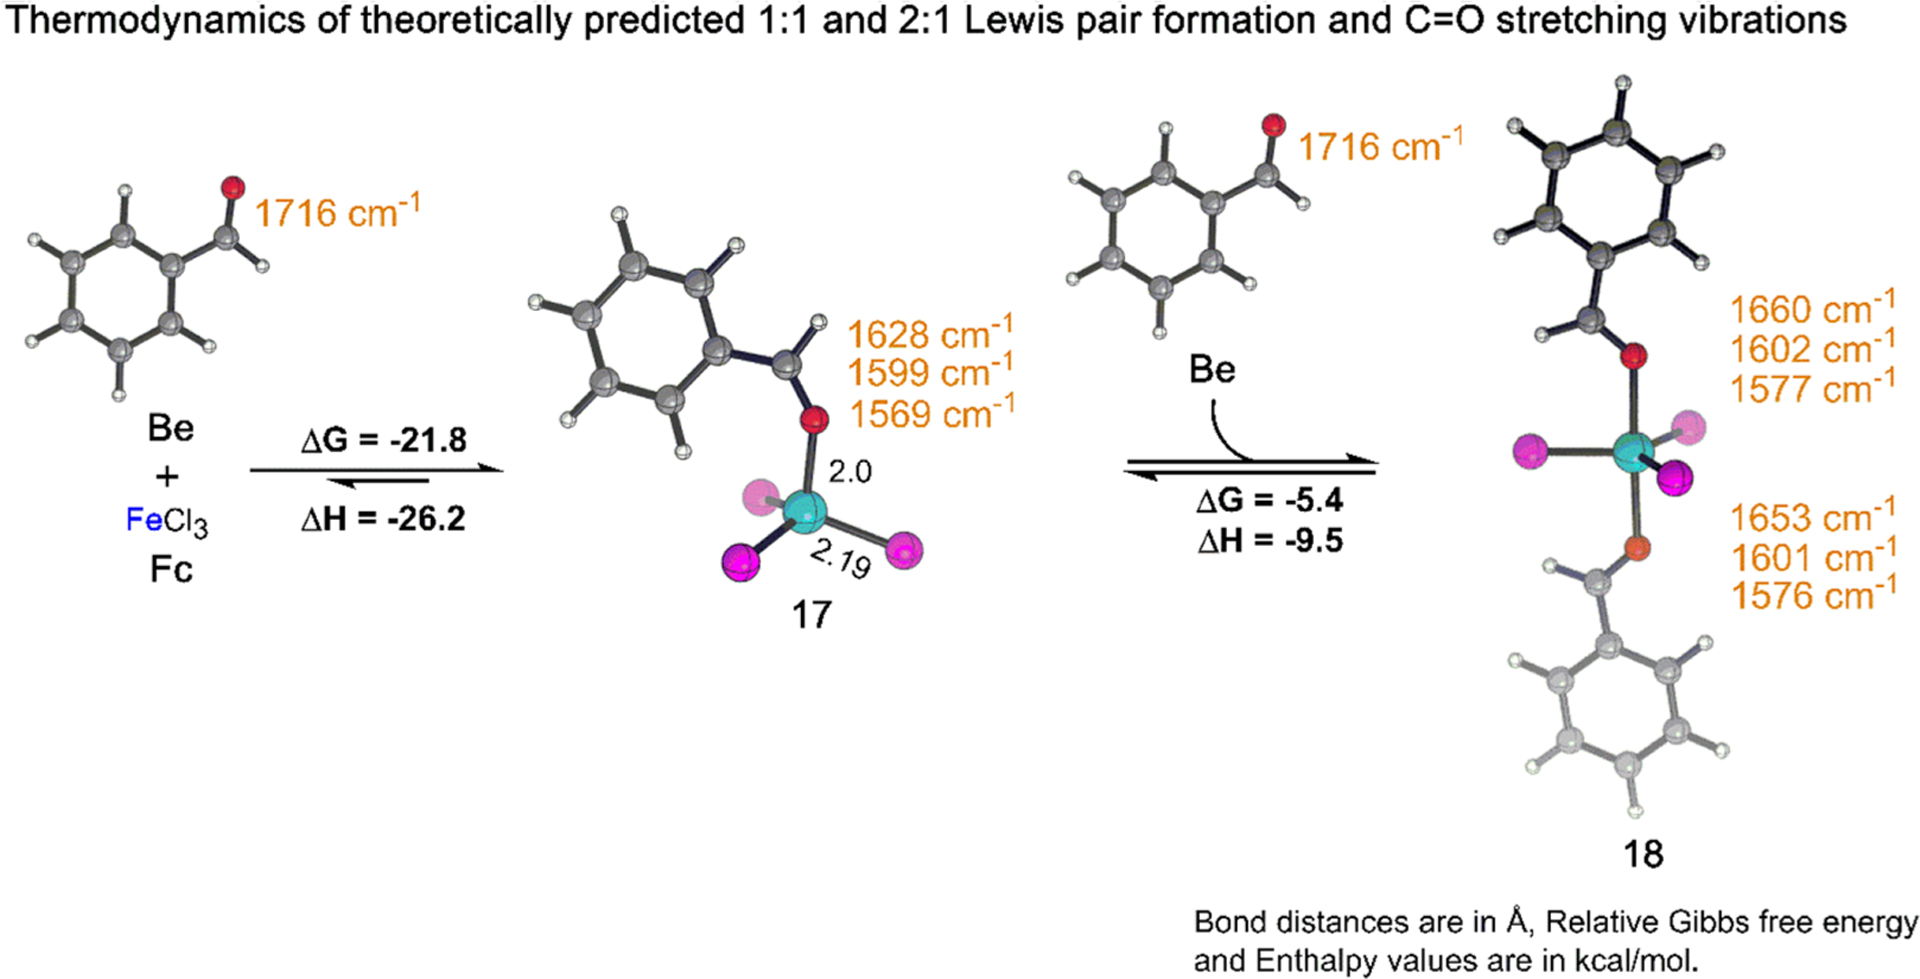
Theoretically predicted thermodynamics and C=O IR stretching frequency (cm−1) of 1:1 and 2:1 complex formed from Fc and Be. Reaction energies (kcal/mol) were obtained at ωb97X-D3/def2-TZVP/SMD(DCE) level of theory. Color code: Fe, cyan; Cl, magenta; O, red; C, gray; H, white.
Reactions of 17 in the presence of higher equivalents of Be were considered next. Modeling suggests 17 transforms into a trigonal bipyramidal 2:1 complex (18) by addition of one Be with an associated ΔG of −5.4 kcal/mol (ΔH = −9.5 kcal/mol). The simulated C=O stretching frequencies in 18 are predicted to be 1660, 1653, 1602, 1601, 1577, and 1576 cm−1 (Figure 6, right). The close proximity of the theoretically predicted peaks, however, means these will not necessarily be individually resolvable in the experimental spectra.
Similar to Ac, simulation shows that species 18 can transform into a trigonal bipyramidal 3:1 complex (19), upon chloride migration from the inner sphere followed by coordination of the third equivalent of Be to the iron center. Species 19 lies 9.8 kcal/mol above 17 and free Be in the free energy landscape (ΔH = 1.1 kcal/mol, see S5 in the SI).
Just like with complexation of Fc with multiple equiv of Ac, quantum chemical modeling predicts two possible structures (20 and 21) for the 4:1 complex formed from 17 and Be. The complex (20) is analogous to species 15 and estimated to be 15.9 kcal/mol uphill in free energy (ΔH = 2.5 kcal/mol) from 17 and free Be (Figure 7, left). Interestingly, the other 4:1 complex (21) is analogous to species 16 and is 11.1 kcal/mol more stable than 20 (Figure 7, right). This observation is consistent with the NCI analysis of 21 which indicates that all four Be ligands are coordinated to the Fe center via lone-pair donation (blue disks in Figure 8). Moreover, in contrast to 20, all four molecules of Be in 21 are coupled, indicated by their sequence of C=O stretching peaks between 1662 and 1552 cm−1. Similar to 16, the chloride ion in 21 is bound to the Fe complex by electrostatics, which is consistent with the experimentally observed increase in solution conductivity upon superstoichiometric addition of Be. Additionally, species 21 closely resembles the crystal structure obtained for Fc in the presence of excess Be.41 The cationic Fe complex is balanced by in the crystal structure. However, formation would result in the composition of carbonyl:Fe to be 4:2, inconsistent with solution-phase stoichiometric observations (4:1) determined from component analysis of the titration-IR data. Moreover, the theoretically simulated IR spectra of the 4:1 complex involving the displays a significant mismatch between the simulated and experimental spectra (see S15 in the SI for details). Overall, the counteranion can be attributed to the crystallization process and is inconsistent with our solution-phase results.
Figure 7.
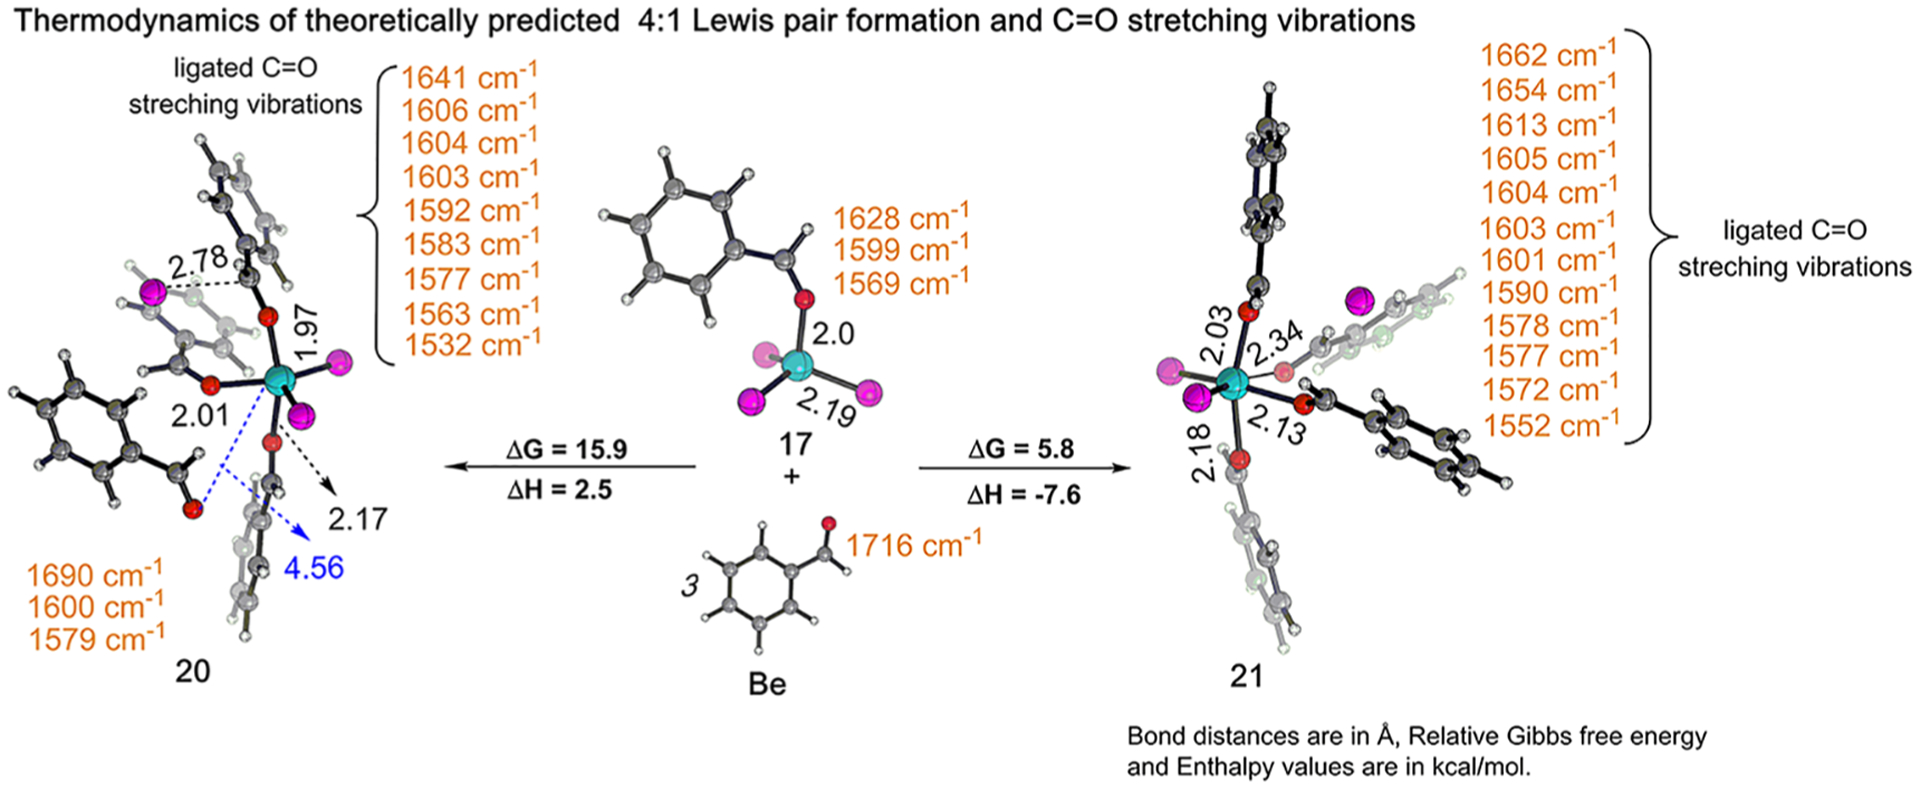
Theoretically predicted thermodynamics and C=O IR stretching frequency (cm−1) of 4:1 complex formed from Fc and Be. Reaction energies (kcal/mol) were obtained at ωb97X-D3/def2-TZVP/SMD(DCE) level of theory. Color code: Fe, cyan; Cl, magenta; O, red; C, gray; H, white.
Figure 8.
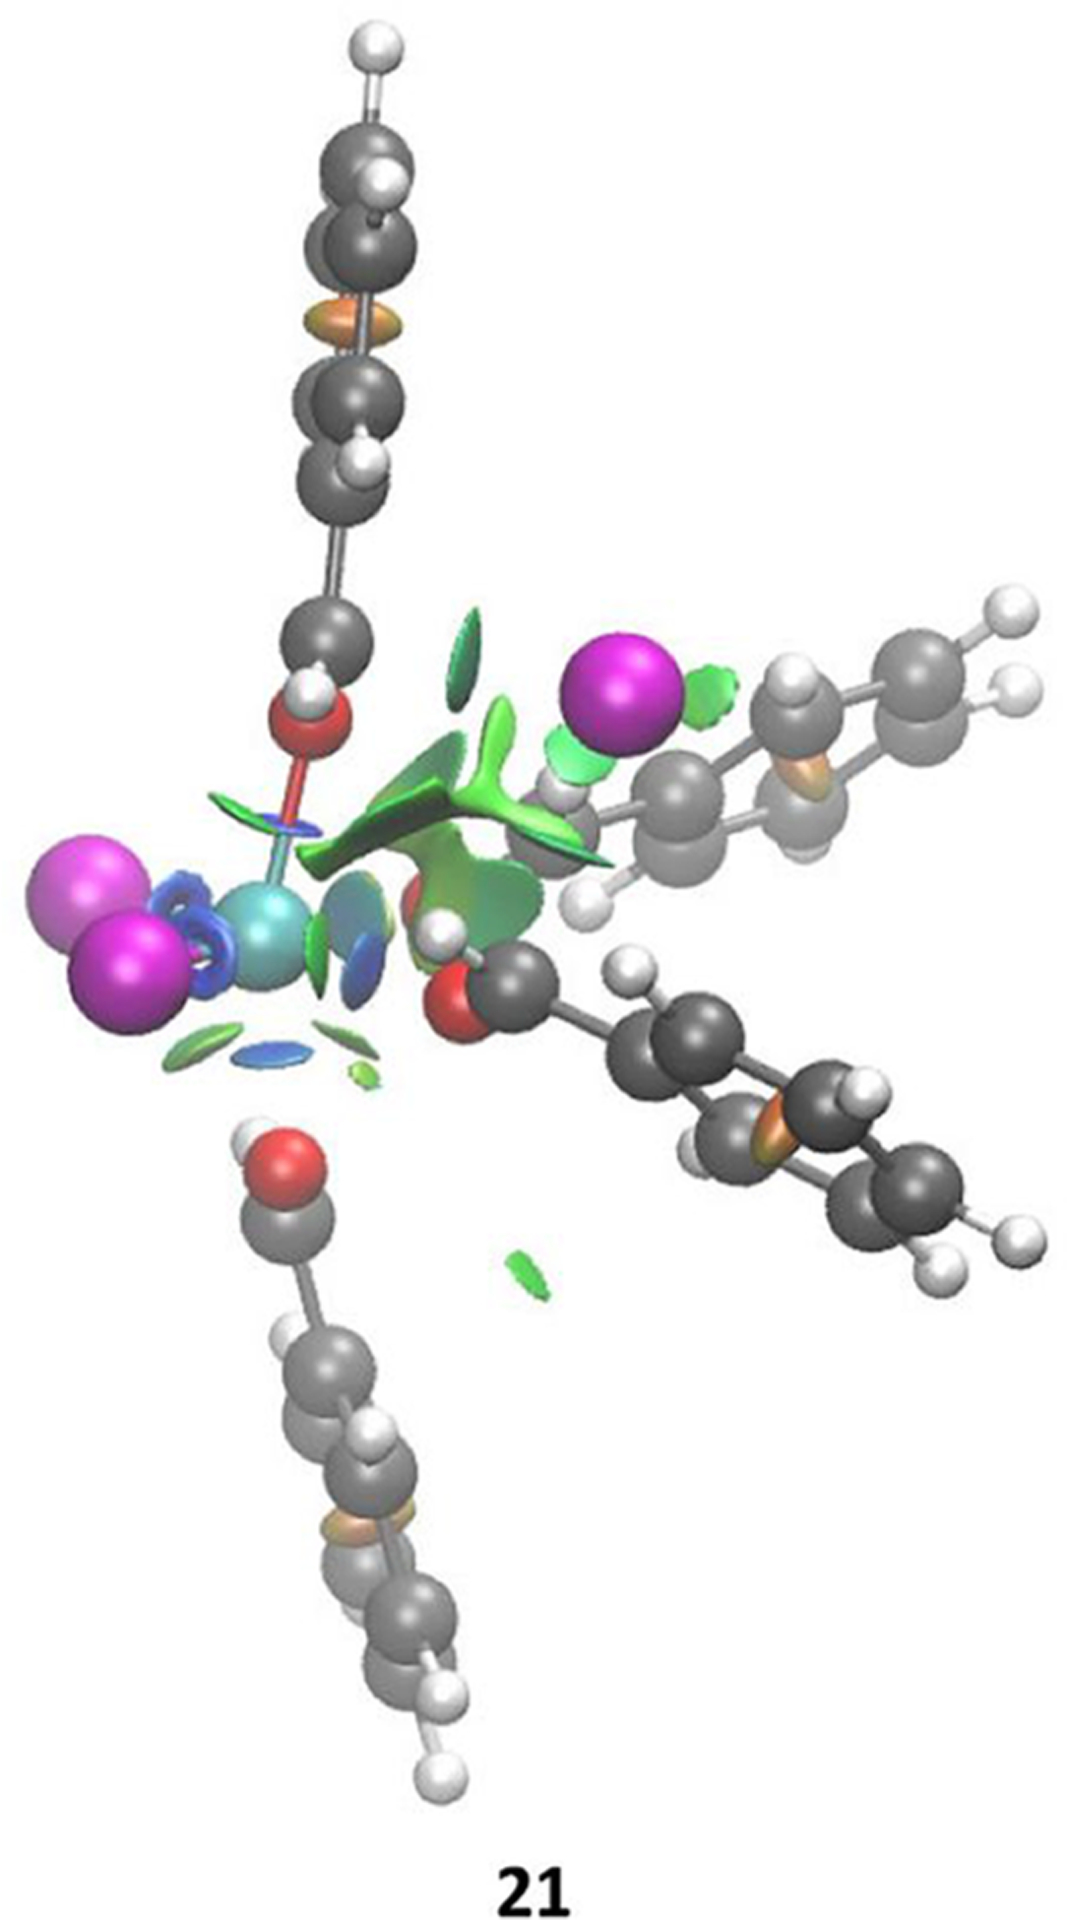
NCI surfaces of 21. Color code: Fe, cyan; Cl, magenta; O, red; C, gray; H, white.
Similar to Ac, we anticipate that the reaction system will be largely populated by species 21 at superstochiometric Be addition, since 21 is 11.1 kcal/mol more stable than 20. Good agreement between the experimental results (ΔG = +5.2 kcal/mol) and the theoretically predicted Gibbs free energy (ΔG = +5.8 kcal/mol, Figure 7, right) for the formation of 21 from its precursor (see S11 in the SI for details) gives evidence that the computational modeling is an accurate representation of the possible solution structures formed in these systems.
Spectral Deconvolution of Titration-IR.
With a theoretical model in hand, we can corroborate our experimental observations with quantum chemical results. In order to interrogate the spectral results, it is necessary to determine which vibrations result in the observed spectra. For titration of Fc with Ac, from 0 to 1 equiv added Ac, a single band is observed in the carbonyl region at 1633 cm−1. Alternatively, the incremental addition of Be to Fc yielded three bands in the carbonyl region at 1610, 1596, and 1573 cm−1 between 0 and 1 added Be. When titrations proceed beyond 1 equiv added carbonyl, analysis of the resulting more complex spectra is less straightforward.
To accomplish the task of identifying bands in more complex spectra, spectral deconvolution was applied to the systems when >1 equiv carbonyl is present (Figure 9, top). The deconvolution of the experimental spectra is displayed as stacked plots, which contain an experimental spectrum (solid black), the spectrum that results from the combination of simulated peaks (dashed black), and the simulated components. Taking one of the spectra from Figure 1c, four individual components (I–IV) add together to a simulated spectrum in agreement with the original spectra, in this case where 0.265 M Ac is present in solution (Figure 9a). Deconvolution of spectra generated in the presence of 0.319, 0.383, 0.447, and 0.593 M Ac yielded the same peak centers for the four components within 1 cm−1. Spectral bands I–III grow in intensity as the [Ac] increases. Band IV, which manifests at amounts of Ac less than 1 equiv with respect to Fc (Figure 1b), is consistent with Lewis pair 11 and decreases in intensity as [Ac] increases. Band I, at 1714.3 ± 0.3 cm−1, is consistent with unbound Ac.
Figure 9.
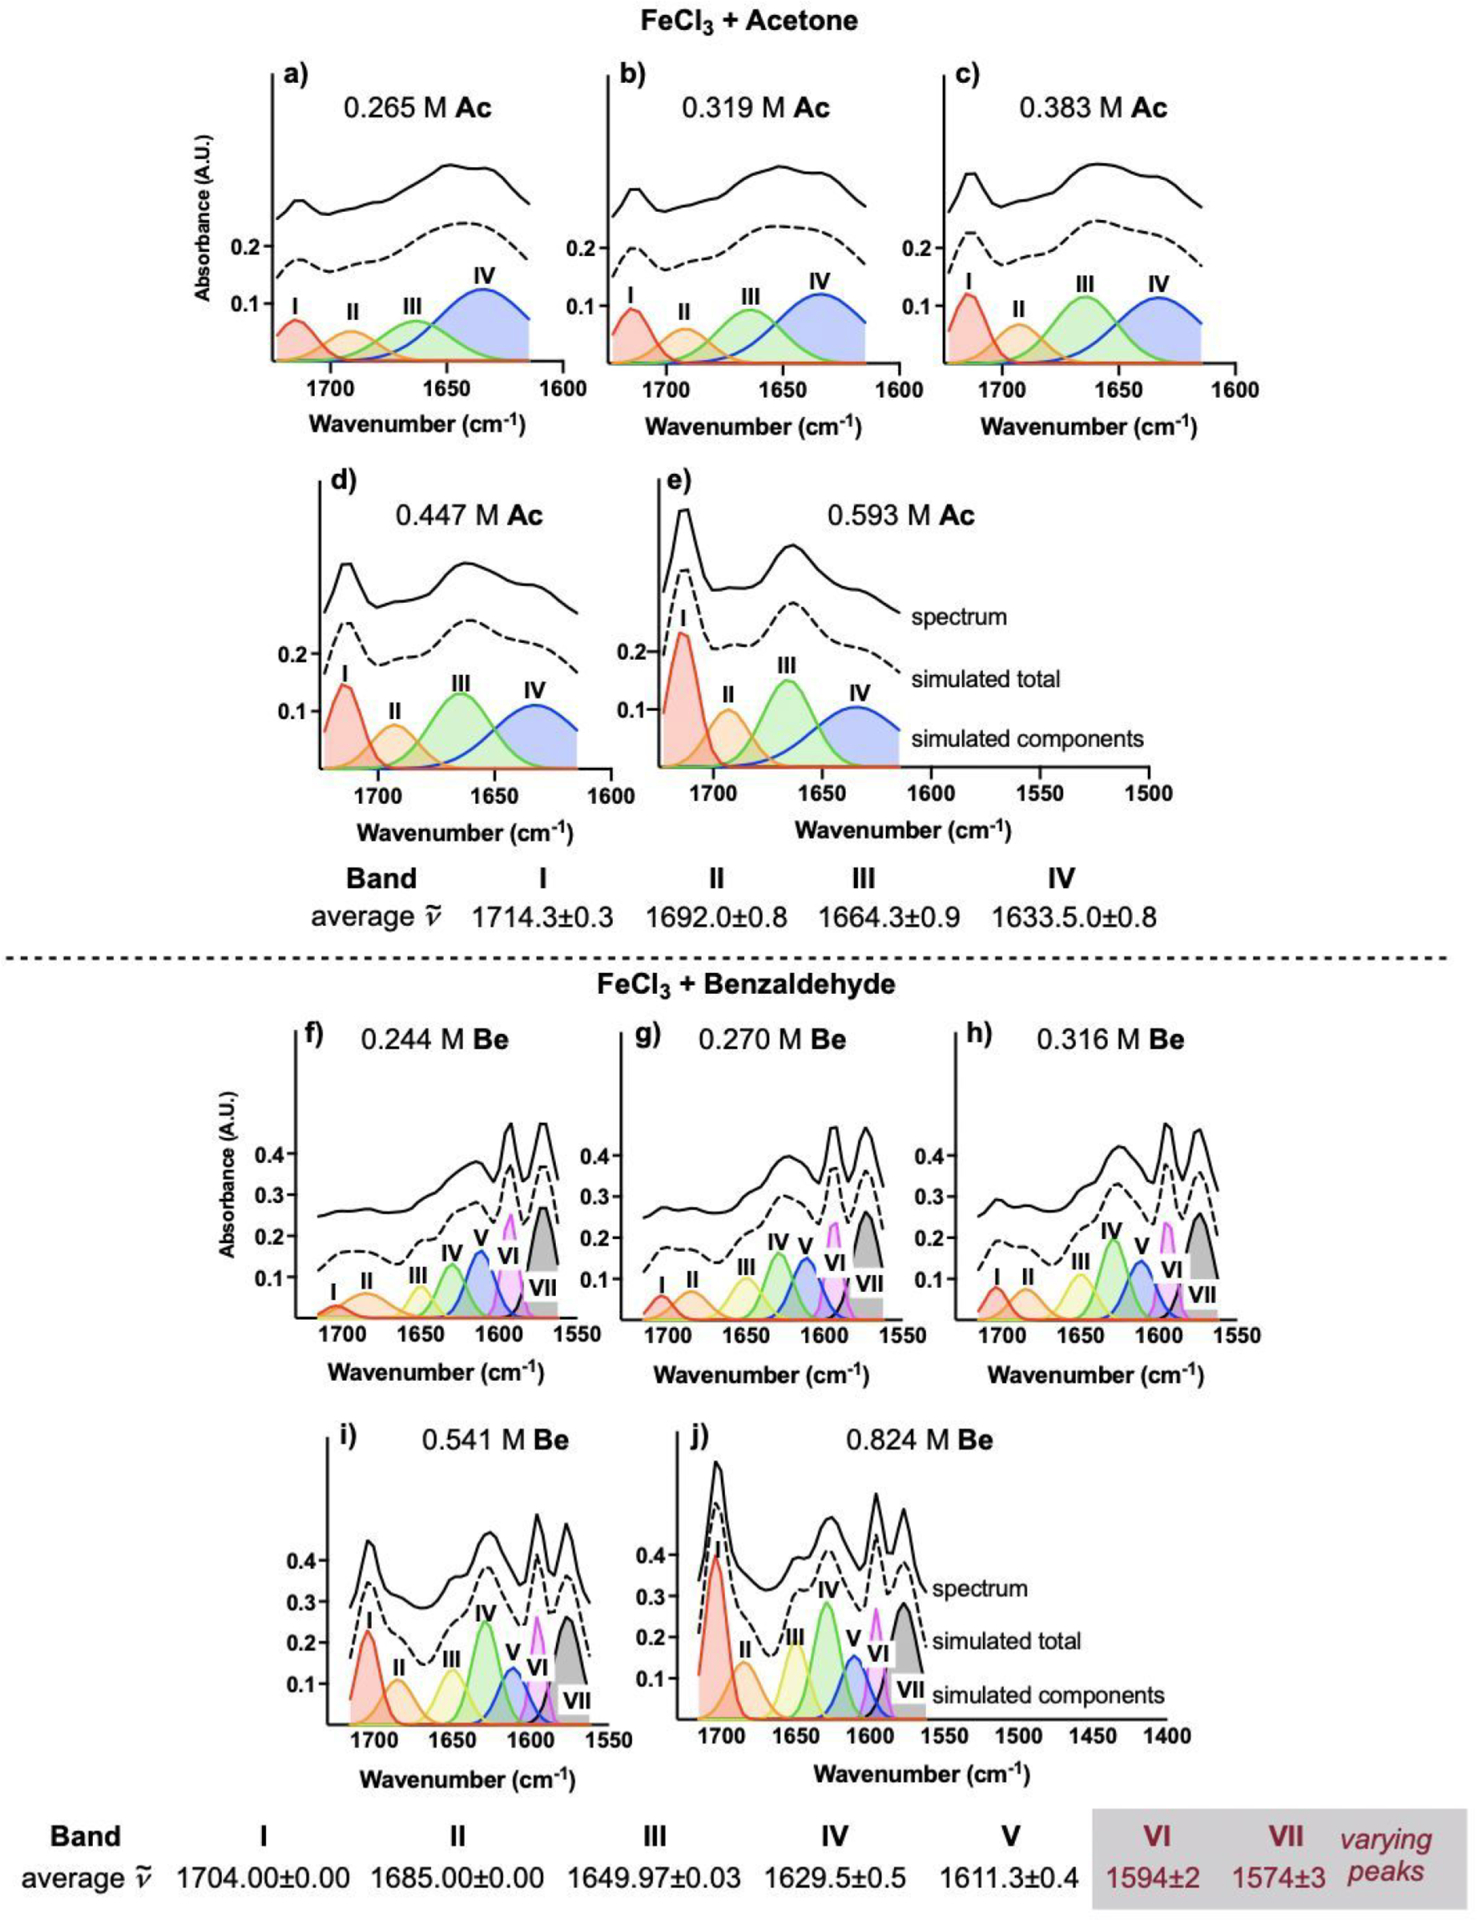
Stacked plots of spectral deconvolution of titration of Fc (2 mmol in 12 mL DCE) with Ac (top) and titration of Fc (2 mmol in 12 mL DCE) with Be (bottom). Depicted y-axes list absorbance for simulated components.
Spectral analysis on titration of Fc with Be (Figure 9, bottom) was also performed. In the carbonyl region of the IR (Figure 5c), 7 bands are required to approximate the spectrum (Figure 9f). Further, bands V–VII are present at amounts of Be less than 1 equiv with respect to Fc (Figure 5b) and are consistent with 17. Band I is consistent with unbound Be. As the [Be] increases, bands I–IV increase in intensity and band V decreases, while maintaining the same peak centers at 1704.00 ± 0.00, 1685.00 ± 0.00, 1649.97 ± 0.03, 1629.5 ± 0.5, and 1611.3 ± 0.4 cm−1, respectively. The peak centers of bands VI and VII shift to higher wavenumbers as [Be] increases, however, suggesting that the vibrations VI and VII in Figure 9f are different from those in Figure 9j.
Comparison of Theory and Experiment.
Having analyzed the individual vibrational components of the observed spectra, we then moved to compare these to the quantum chemical results. Since the absolute value of theoretically simulated peaks for the carbonyls and their corresponding 1:1 Lewis complex differs ~6–24 cm−1 from the experimentally observed spectra, the trend between theoretically predicted spectra and that of experiments was analyzed instead.
The predicted IR peaks based on the computed C=O vibrations for Ac, 11, 15, and 16 are therefore compared with the deconvoluted experimental spectra in Figure 10. In order to determine if there is a correlative agreement between our predicted and observed spectra, we began by assigning peaks. The predicted spectrum for Ac yields one peak which we assign to what is observed by titration-IR. The simulated spectrum for 11 predicts a single carbonyl vibration that is shifted to lower wavenumbers, which we observe in titration-IR. Between these two points are the vibrations for the structures that form at >1 equiv Ac. The two peaks our simulation predicts for 15 are consistent with bands II and III from our deconvoluted IR data. The simulated spectrum for 16 is also consistent with band III. Plotting the predicted IR vibration as a function of experimentally observed vibration yields a linear correlation with an R2 = 0.9754 (Figure 10a). This correlation provides a mathematical relationship for direct comparison of both data sets (Figure 10c). Bands I and IV are consistent with spectra predicted for Ac and 11, respectively. Complex 16, which our calculations predict is the more stable of the two possible 4:1 complexes, is consistent with band III. However, 16 does not align with band II, but complex 15 aligns with bands II and III. Though 16 is predicted to be the more stable than 15, the combined theoretical and experimental results suggest that we are observing a mixture of 15 and 16 in solution at >1 equiv Ac addition, where band II is consistent with 15 and band III represents a combination of 15 and 16.
Figure 10.
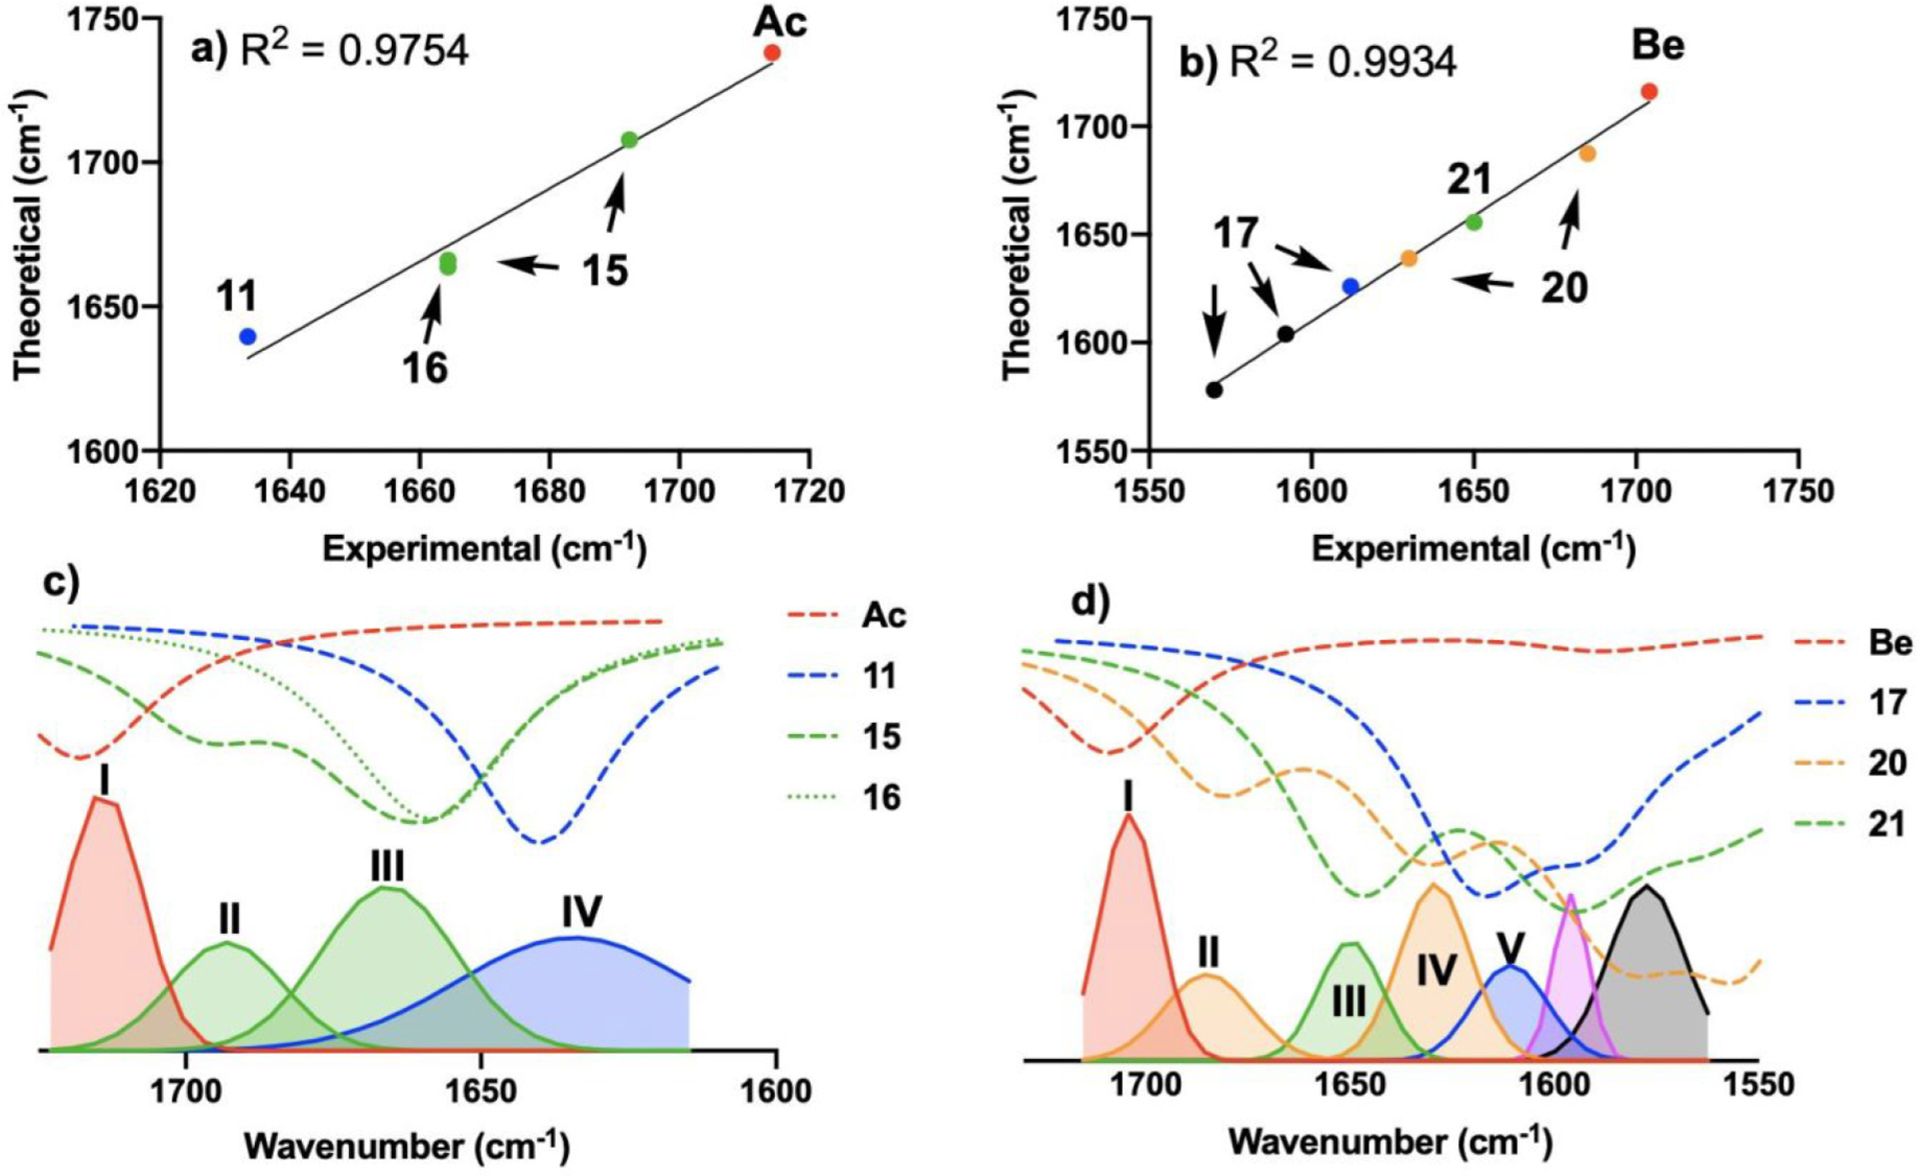
(a) Correlation of theoretical IR vibrations with deconvoluted experimental vibrations for complexes of Fc and Ac. (b) Correlation of theoretical IR vibrations with deconvoluted experimental vibrations for complexes of Fc and Be. (c) Comparison of deconvoluted vibrations (solid lines) with correlation-corrected simulated spectra (dashed lines) for a mixture of Fc and 0.593 M Ac. (d) Comparison of deconvoluted vibrations (solid lines) with correlation-corrected simulated spectra (dashed lines) for a mixture of Fc and 0.824 M Be.
Titration of Fc with Be displays more complex spectral behavior, which can be related to the quantum chemical model by focusing on the vibrations we can specifically identify. The simulated spectrum for Be is consistent with the C=O vibration observed for Be (Figure 10b). The prediction for 17 yields three IR peaks at lower wavenumbers relative to Be, which is consistent with titration-IR data, when Fc is in excess with respect to Be. For 20 and 21, significant overlap exists between these predicted spectra, as well as the predicted spectrum for 17, which is still present in the solution. This overlap is located between 1550 and 1625 cm−1. However, spectral overlap decreases in the region between 1625 and 1690 cm−1. In this region, 21 is predicted to have a vibration that is consistent with band III. Additionally, our prediction for 20 is consistent with bands II and IV. Like with the Ac data, plotting the predicted IR vibrations as a function of experimentally observed vibrations for the Be data yields a linear correlation with an R2 = 0.9934 (Figure 10b). Again, the observed correlation assists in the direct comparison of both data sets (Figure 10d). Using this comparison, band I is consistent with Be. During our titrations, bands VI and VII shift as the [Be] increases. As a result, positive identification of these bands when Be is present in excess with respect to Fc is difficult. However, band V is consistent with the prediction of one of the vibrations of 17. Similar to analysis of the Ac-based data, both 4:1 complexes are required to explain the observed IR bands. Thermodynamically more stable complex 21 is consistent with only band III, while 20 is consistent with both bands II and IV. Analogous to the Ac system, the combined theoretical and experimental results suggest there exists a mixture of 20 and 21 in solution with superstoichiometric Be addition. Previously, we were able to obtain a crystal of a complex from a solution of Fc and excess Be.41 The X-ray crystal structure is consistent with the predicted structure of 21, and the solid-state IR for the crystal is consistent with the spectrum predicted for 21. This spectrum includes band III, but neither band II nor band IV is present (see S8 and S9 in the SI for more detail).
DISCUSSION
The combination of experiment and simulation yields the following model for complexation of carbonyls with Fc: (1) When Fc is present in excess with respect to Ac, the 1:1 Lewis pair 11 results. (2) The observed spectrum for 11 is in good agreement with the predicted spectrum. (3) When more Ac is added to a solution of 11, Lewis pair 11 is consumed and converted to one or more structures with higher coordination numbers. (4) The predicted spectra for both 15 and 16 are required to assign all observed bands in the titration-IR data. (5) Titration of Fc with Be yields analogous results. Additionally, the kinetic examination of carbonyl-olefin metathesis shows that (6) Ac-producing 22 reaches full conversion with as little as 5 mol % Fc (Figure 11a); whereas, 50 mol % Fc, is required for Be-producing reaction of 25 (Figure 11d).41 (7) The addition of 50 mol % Ac or Be at the onset of the metathesis reaction of 22 or 25, respectively, inhibits catalytic turnover. (8) The addition of 50 mol % Be (open red squares, Figure 11e) at the onset of the metathesis reaction of 25 resulted in relatively less product than when Ac is introduced to the reaction of 22 (open green squares, Figure 11b). (9) The ratio of Ac to Fc in the reaction of 22 is 10:1; whereas the ratio of Be to Fc at the onset of the reaction of 25 is 1:1. Taken together, these observations allow us to address how superstoichiometric amounts of Ac and Be impact the catalytic cycle of carbonyl-olefin metathesis by transforming the 1:1 complex into highly ligated carbonyl complex (16, 21).
Figure 11.
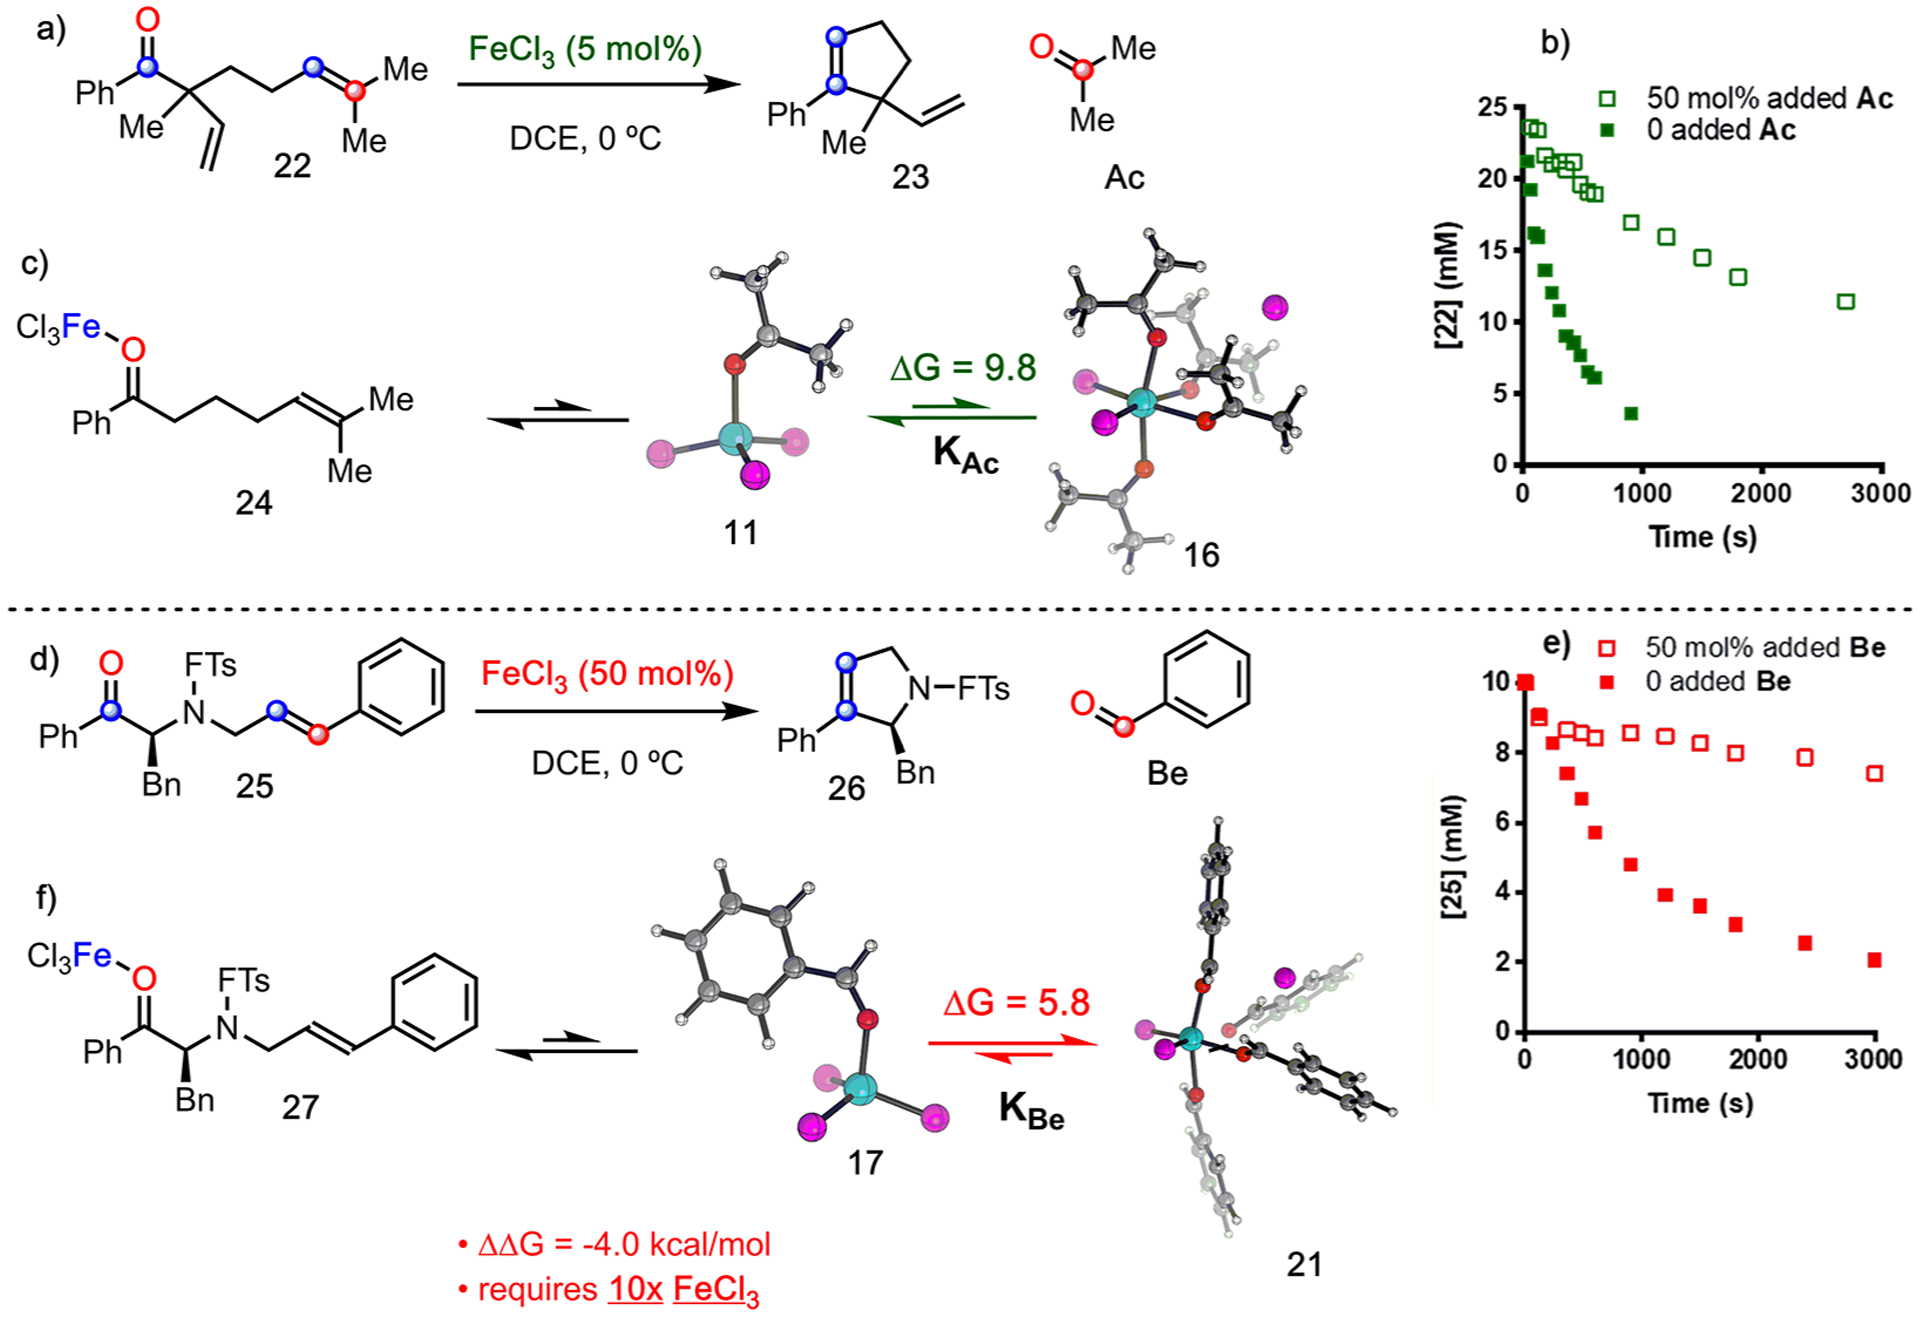
(a) Carbonyl-olefin metathesis reaction of 22. (b) [22] vs time for reaction of 22 (green ■). [22] vs time for reaction of 22 with 50 mol % Ac (green □).41 (c) Efficient carbonyl-exchange in catalytic carbonyl-olefin methathesis when the byproduct is Ac. (d) Carbonyl-olefin metathesis reaction of 15. (e) [25] vs time for reaction of 25 (red ■). [25] vs time for reaction of 25 with 50 mol % Be (red □).41 (f) catalyst inhibition when the byproduct is Be. Free energies (kcal/mol) were obtained at ωb97X-D3/def2-TZVP/SMD(DCE) level of theory. Color code: Fe, cyan; Cl, magenta; O, red; C, gray; H, white.
We have previously demonstrated that modification of the olefin partner in carbonyl-olefin metathesis-active substrates changes the mechanism of the reaction.40 Further, we showed that changing the olefin of the substrate from one that produces Ac to one that produces Be can significantly decrease the yield. Li33 and Schindler21 have shown that the addition of allyltrimethylsilane to Be-producing reactions improves reaction outcomes by scavenging Be out of the reaction mixture. The reason for these alterations is likely to improve the efficiency of the ultimate step of the metathesis cycle: carbonyl exchange. Under stoichiometric conditions, metathesis substrate 22 can displace Ac from 24 (Figure 11c).21 However, this exchange becomes difficult in the presence of superstoichiometric amounts of Ac, which inhibits the catalytic cycle. Likewise, the presence of Be inhibits catalytic turnover (Figure 11f). One question remains: what causes Be-producing reactions to require these procedural alterations?
EQUILIBRIUM MODEL FOR ACTIVE CATALYST CONCENTRATION
To understand the answer to this question, we first recognize that atomistic simulations predict that the conversion of Lewis pair 11 to tetra-ligated complex 16 (Figure 11c) is less favorable than conversion of 17 to 21 (Figure 11f) by 4.0 kcal/mol. Under equivalent conditions, metathesis reactions that produce Be can more easily access 21, thus removing Fc from the active catalytic cycle and inhibiting product formation. To more precisely elucidate how activity varies with carbonyl byproduct formation, we fit an analytical model (see equilibrium expression in Figure 12 and S10 in the SI for details) to experimental data under the assumption that metathesis reactivity terminates when 99% of catalyst is consumed. For reaction of 28 with Ac byproduct (Figure 12), 56% yield at 1 mol % Fc and 99% yield at 5 mol % Fc30 are consistent with an equilibrium constant of KAc = 0.00063 mol−3 L3. Using KAc, the effective catalyst concentration [Fe]total can be determined as a function of substrate conversion (Figure 12a), where [Fe]total is the sum of all catalytically active Fe(III) species, including Fc, the Fc-28 complex, and 11. The plots for 1 mol % Fc (Figure 12a, blue) and 5 mol % Fc (Figure 12a, orange) show how catalyst loading impacts the relationship of [Fe]Total and conversion. When Ac byproducts are formed at 5 mol % catalyst loading, a significant amount of active catalyst is still left even after 99% conversion.
Figure 12.
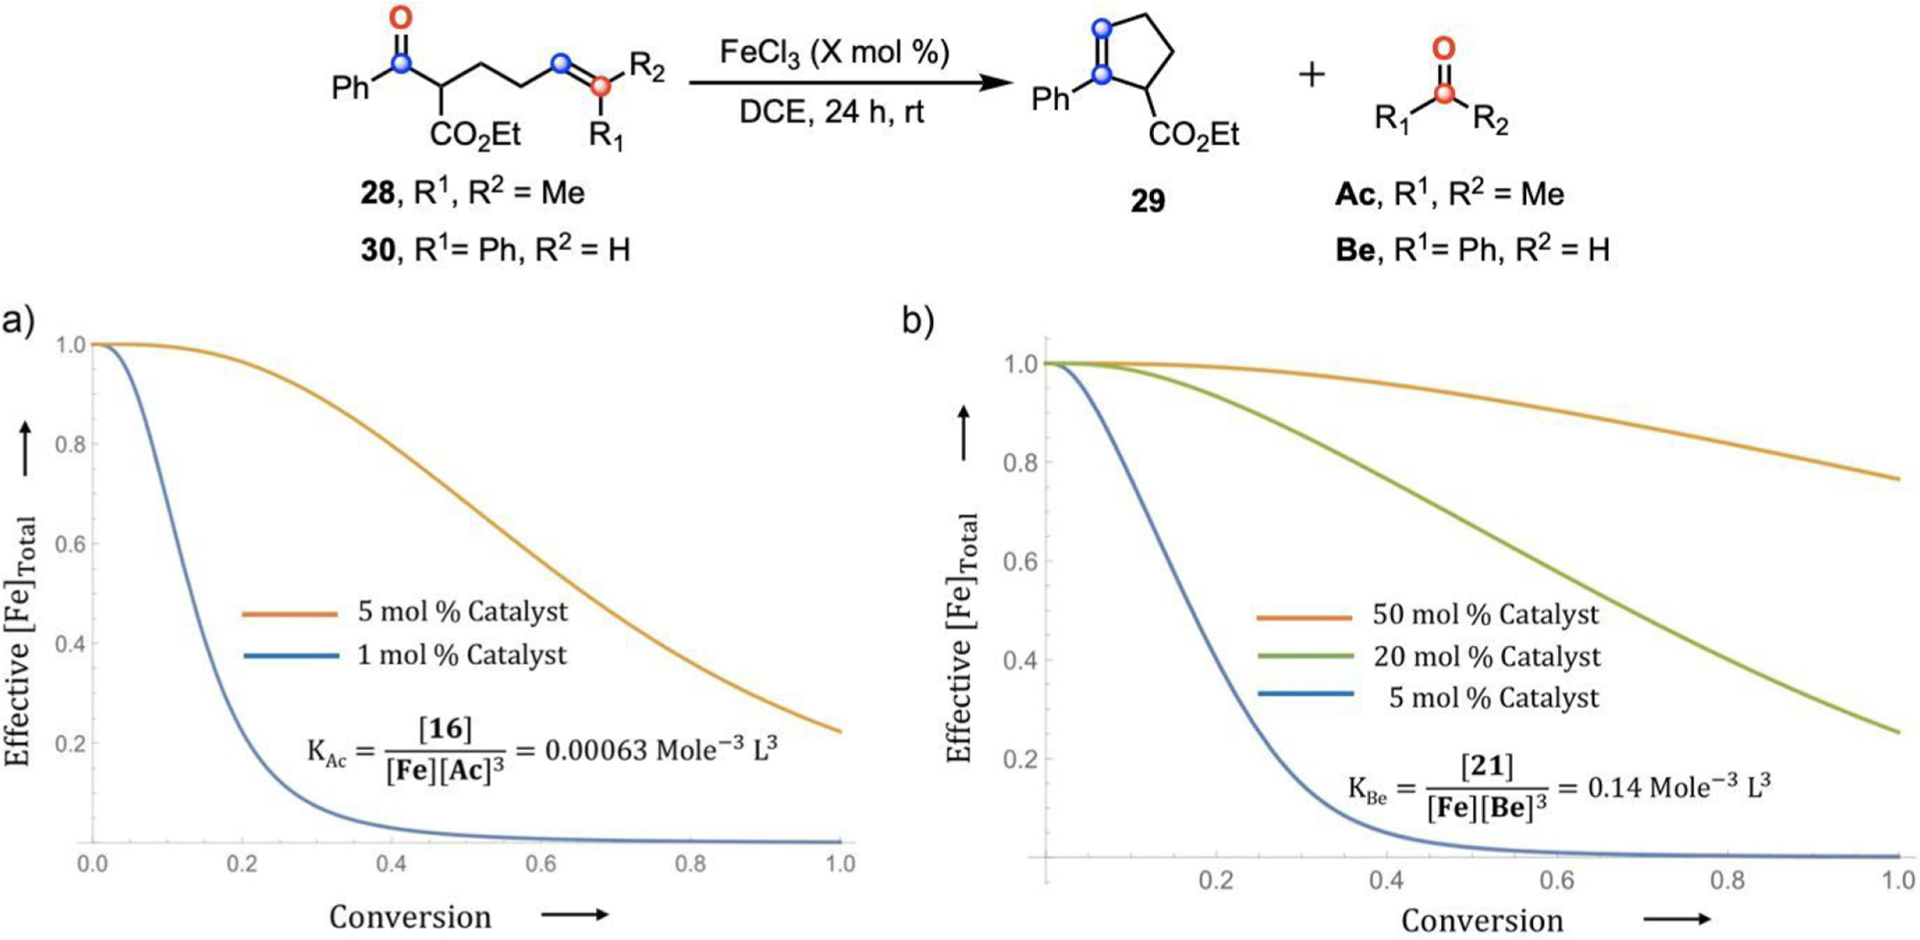
Comparative catalyst inhibition in carbonyl-olefin metathesis involving (a) Ac producing substrate (28) and (b) Be producing substrate (30) with varied catalyst loading.
This analysis was applied to the reaction of 30 with Be byproducts.40 We again calculate the equilibrium constant for formation of 21, KBe = 0.14 mol−3 L3, applying the assumption that a 60% yield for the 5 mol % catalyst loading corresponds with 99% consumption of complex 17 (Figure 12b, blue).40 This model shows negligible consumption of Fc at a loading of 50 mol % (Figure 12b, orange), which is adequate to complete the reaction. The model also determines that a catalyst loading of 20 mol % Fc in the Be-producing reaction (Figure 12b, green) would provide an equivalent [Fe]Total at full conversion as that of the Ac-producing reaction (Figure 12a, orange). In other words, for Be-producing metathesis reactions, a 4-fold increase in the catalyst loading is required for high yielding procedures.
The analytical model is consistent with titration-IR observations, where 1) increasing the ratio of Fc to carbonyl byproduct increases the amount of Lewis pair (11) relative to highly aggregated complex (16) in solution and 2) metathesis substrate can efficiently access the Fe(III) center of the Lewis pair (11) via carbonyl exchange but is inhibited by the four equivalents of byproduct in complex (16).41 Additionally, the model provides estimates of the impact of byproduct inhibition on the reaction rate as a function of the catalyst loading.
Next, the KBe/KAc ratio (222) from the model (which was extracted from experimental data) corresponds to a relative free energy of inactive Fc formation, ΔΔG = 3.2 kcal/mol. This value is in agreement with the quantum chemical prediction of ΔΔG = 4.0 kcal/mol for the same quantity. Overall, this model’s prediction of a decreased ΔG for the formation of 21 relative to 16 is consistent with the need for higher Fc loadings or chemical removal of byproduct Be from the reaction for high yielding reactions.
Finally, we examine the physical reason that Be converts Fc to cationic Fe complex 21 (Figure 11f) more easily than Ac drives Fc to the corresponding species 16 (Figure 11c). This difference likely is due to the ability of the ligand to better stabilize the charge on the Fe center in 21 vs 16 in the absence of the third chloride ion. In particular, distribution of charge across the four aromatic rings may be largely responsible for the ΔΔG of 4.0 kcal/mol compared to Ac, which has less atoms about which it can delocalize the excess charge. Mulliken charge analysis (see S18 in the SI for more details) provides support for this hypothesis. This explanation is in agreement with our previous report that found solution conductivity increases more with respect to each equivalent of Be (1130 ± 20 mS cm−1 per equiv Be) added as compared to Ac (450 ± 30 mS cm−1 per equiv Ac).41 Overall, the quantum chemical model, kinetic model, and solution conductivity experiments are all consistent with 21 being more stable under equivalent conditions as the reaction progresses, therefore, exhibiting more pronounced inhibition than 16 (Figure 12).
CONCLUSION
The solution structures formed via coordination of Ac and Be to Fc were investigated based on theoretical modeling. For the interaction of Ac and Fc, our model predicts a pairwise interaction between Ac and Fc under stoichiometric conditions. When superstoichiometric amounts of Ac are present with respect to Fc, two solution structures composed of four molecules of Ac and one Fc result. Likewise, the model predicts a stoichiometric pairing of Be and Fc which transitions to two possible solution structures of 4:1 Be to Fc. These models allowed us to predict what spectral features would be observable in the infrared. Using these predictions, we see good agreement between the Lewis pairs 11 and 17 and spectra generated via titration-IR, which are observed when Fc is in excess relative to the carbonyl. When Ac is in excess relative to Fc, our experimental spectra display vibrations consistent with a mixture of Ac, 11, 15, and 16 based on our model. A similar examination of Be and Fc reveals vibrations consistent with Be, 17, 20, and 21. These findings are consistent with our previous proposal that these structures result in product inhibition of Fe-catalyzed carbonyl-olefin metathesis.41 This work describing the solution structures, in concert with the report of Fe(III) dimers being active in the reaction of aliphatic carbonyls,21 emphasizes that significant consideration of solution structures allows for a more complete understanding of reaction behavior in catalytic systems. Importantly, our theoretical model for the ground state interactions of carbonyls and FeCl3 not only allows us to understand what is happening in solution in carbonyl-olefin metathesis but also provides an avenue for predicting the impact of alternative Lewis acids and ligand effects on ring-closing carbonyl-olefin metathesis. Because these unusual structures are likely a factor in many carbonyl-based FeCl3-catalyzed reactions, we are currently examining alternative systems to understand the impact of the solution structures accessible to FeCl3 in catalytic regimes.
Supplementary Material
ACKNOWLEDGMENTS
T.M. and P.M.Z. thank the NIH for support under R35-GM-128830. C.S.H. and J.J.D. thank the NIH/National Institute of General Medical Sciences (GM128126) for financial support.
Footnotes
Supporting Information
The Supporting Information is available free of charge at https://pubs.acs.org/doi/10.1021/acscatal.0c05277.
Computational details, bond order analysis, Mulliken charge analysis, solid state IR, spectral deconvolution analysis, and energies of all intermediate and transition states investigated (PDF)
Complete contact information is available at: https://pubs.acs.org/10.1021/acscatal.0c05277
The authors declare no competing financial interest.
Contributor Information
Tanmay Malakar, Department of Chemistry, University of Michigan, Ann Arbor, Michigan 48109, United States.
Carly S. Hanson, Department of Chemistry & Biochemistry, Loyola University Chicago, Chicago, Illinois 60660, United States.
James J. Devery, III, Department of Chemistry & Biochemistry, Loyola University Chicago, Chicago, Illinois 60660, United States.
Paul M. Zimmerman, Department of Chemistry, University of Michigan, Ann Arbor, Michigan 48109, United States.
REFERENCES
- (1).Matsuo J; Murakami M The Mukaiyama Aldol Reaction: 40 Years of Continuous Development. Angew. Chem., Int. Ed 2013, 52 (35), 9109–9118. [DOI] [PubMed] [Google Scholar]
- (2).Modern Carbonyl Chemistry; Otera J, Ed.; Wiley-VCH Verlag GmbH, 2000. [Google Scholar]
- (3).Yamamoto H; Ishihara K Acid Catalysis in Modern Organic Synthesis 2008, 2. [Google Scholar]
- (4).Yamamoto H; Ishihara K Acid Catalysis in Modern Organic Synthesis; Yamamoto H, Ishihara K, Eds.; Wiley-VCH: Weinheim, Germany, 2008; Vol. 1. [Google Scholar]
- (5).Sorrell TA Organic Chemistry, 2nd ed.; University Science Books, 2006. [Google Scholar]
- (6).Lappert MF 174. Co-Ordination Compounds Having Carboxylic Esters as Ligands. Part I. Stoicheiometry, Structure, and Stereochemistry. J. Chem. Soc 1961, 817. [Google Scholar]
- (7).Lappert MF 103. Co-Ordination Compounds Having Carboxylic Esters as Ligands. Part II. Relative Acceptor Strengths of Some Group III and IV Halides. J. Chem. Soc 1962, 542. [Google Scholar]
- (8).Susz BP; Chalandon P Etude de Composés d’addition Des Acides de Lewis. IX. - Spectres d’absorption Infrarouge Des Composés Formés Par La Benzophénone et l’acétophénone Avec BF3, FeCl3, ZnCl2 et AlCl3 et Nature de La Liaison Oxygène-Mètal. Helv. Chim. Acta 1958, 41 (5), 1332–1341. [Google Scholar]
- (9).Reetz MT; Hüllmann M; Massa W; Berger S; Rademacher P; Heymanns P Structure and Electronic Nature of the Benzaldehyde/Boron Trifluoride Adduct. J. Am. Chem. Soc 1986, 108 (9), 2405–2408. [DOI] [PubMed] [Google Scholar]
- (10).Cook D Infrared Spectra of Xanthone: Lewis Acid Complexes. Can. J. Chem 1963, 41 (2), 522–526. [Google Scholar]
- (11).Cook D The Interaction of Friedel–Crafts Catalysts With Organic Molecules: III. The CH3COCl:GaCl3 System. Can. J. Chem 1962, 40 (3), 480–485. [Google Scholar]
- (12).Rosenheim A; Levy W Ueber Die Verbindungen Ungesättigter Ketone Mit Metallchloriden. Ber. Dtsch. Chem. Ges 1904, 37 (3), 3662–3671. [Google Scholar]
- (13).Pfeiffer P; Halperin O; Pros E; Schwarzkopf V Additionsprodukte von Zinnhalogeniden an Carbonylverbindungen I. Beitrag Zur Theorie Der Halochromieerscheinungen. Justus Liebig’s Ann. Chem 1910, 376 (3), 285–310. [Google Scholar]
- (14).Chand Paul R; Chadha SL Structure of Donor-Acceptor Complexes-VIII. Complexes of Lewis Acids with Ketones. J. Inorg. Nucl. Chem 1969, 31 (6), 1679–1683. [Google Scholar]
- (15).Lewis FD; Oxman JD; Huffman JC Photodimerization of Lewis Acid Complexes of Cinnamate Esters in Solution and the Solid State. J. Am. Chem. Soc 1984, 106 (2), 466–468. [Google Scholar]
- (16).Denmark SE; Henke BR; Weber E SnCl4(4-Tert-BuC6H4CHO)2. X-Ray Crystal Structure, Solution NMR, and Implications for Reactions at Complexed Carbonyls. J. Am. Chem. Soc 1987, 109 (8), 2512–2514. [Google Scholar]
- (17).Branchadell V; Oliva A Complexes between Formaldehyde and Titanium Tetrachloride. An Ab Initio Study 1992; Vol. 114. [Google Scholar]
- (18).Bertinato P; Sorensen EJ; Meng D; Danishefsky SJ Studies toward a Synthesis of Epothilone A: Stereocontrolled Assembly of the Acyl Region and Models for Macrocyclization. J. Org. Chem 1996, 61 (23), 8000–8001. [DOI] [PubMed] [Google Scholar]
- (19).Graven WM; Peterson RV Addition Compounds of HfCl4 and ZrCl4 with Organic Ligands. J. Inorg. Nucl. Chem 1969, 31 (6), 1743–1748. [Google Scholar]
- (20).Galeffi B; Simard M; Wuest JD Coordination Chemistry of Zirconium Tetrachloride. Crystal Structure of the 1:2 Adduct with Pinacolone. Inorg. Chem 1990, 29 (5), 951–954. [Google Scholar]
- (21).Albright H; Riehl PS; McAtee CC; Reid JP; Ludwig JR; Karp LA; Zimmerman PM; Sigman MS; Schindler CS Catalytic Carbonyl-Olefin Metathesis of Aliphatic Ketones: Iron(III) Homo-Dimers as Lewis Acidic Superelectrophiles. J. Am. Chem. Soc 2019, 141 (4), 1690–1700. [DOI] [PMC free article] [PubMed] [Google Scholar]
- (22).Hanson CS; Psaltakis MC; Cortes JJ; Siddiqi SS; Devery JJ Investigation of Lewis Acid-Carbonyl Solution Interactions via Infrared-Monitored Titration. J. Org. Chem 2020, 85 (0), 820. [DOI] [PMC free article] [PubMed] [Google Scholar]
- (23).Fochi M; Caruana L; Bernardi L Catalytic Asymmetric Aza-Diels-Alder Reactions: The Povarov Cycloaddition Reaction. Synthesis (Germany) 2014, 135–157. [Google Scholar]
- (24).Mukaiyama T; Narasaka K; Banno K New Aldol Type Reaction. Chem. Lett 1973, 2 (9), 1011–1014. [Google Scholar]
- (25).Gati W; Yamamoto H Second Generation of Aldol Reaction. Acc. Chem. Res 2016, 49 (9), 1757–1768. [DOI] [PubMed] [Google Scholar]
- (26).Hoffmann HMR The Ene Reaction. Angew. Chem., Int. Ed. Engl 1969, 8 (8), 556–577. [Google Scholar]
- (27).Carlos Dias L Chiral Lewis Acid Catalyzed Ene-Reactions. Curr. Org. Chem 2000, 4 (3), 305–342. [Google Scholar]
- (28).Brimioulle R; Lenhart D; Maturi MM; Bach T Enantioselective Catalysis of Photochemical Reactions. Angew. Chem., Int. Ed 2015, 54 (13), 3872–3890. [DOI] [PubMed] [Google Scholar]
- (29).Skubi KL; Blum TR; Yoon TP Dual Catalysis Strategies in Photochemical Synthesis. Chem. Rev 2016, 116, 10035–10074. [DOI] [PMC free article] [PubMed] [Google Scholar]
- (30).Ludwig JR; Zimmerman PM; Gianino JB; Schindler CS Iron(III)-Catalysed Carbonyl-Olefin Metathesis. Nature 2016, 533 (7603), 374–379. [DOI] [PubMed] [Google Scholar]
- (31).McAtee CC; Riehl PS; Schindler CS Polycyclic Aromatic Hydrocarbons via Iron(III)-Catalyzed Carbonyl-Olefin Metathesis. J. Am. Chem. Soc 2017, 139 (8), 2960–2963. [DOI] [PMC free article] [PubMed] [Google Scholar]
- (32).Groso EJ; Golonka AN; Harding RA; Alexander BW; Sodano TM; Schindler CS 3-Aryl-2,5-Dihydropyrroles via Catalytic Carbonyl-Olefin Metathesis. ACS Catal. 2018, 8, 2006–2011. [DOI] [PMC free article] [PubMed] [Google Scholar]
- (33).Ma L; Li W; Xi H; Bai X; Ma E; Yan X; Li Z FeCl3-Catalyzed Ring-Closing Carbonyl–Olefin Metathesis. Angew. Chem., Int. Ed 2016, 55 (35), 10410–10413. [DOI] [PubMed] [Google Scholar]
- (34).Ludwig JR; Watson RB; Nasrallah DJ; Gianino JB; Zimmerman PM; Wiscons RA; Schindler CS Interrupted Carbonyl-Olefin Metathesis via Oxygen Atom Transfer. Science 2018, 361 (6409), 1363–1369. [DOI] [PMC free article] [PubMed] [Google Scholar]
- (35).Riehl P; Nasrallah D; Schindler C Catalytic, Transannular Carbonyl-Olefin Metathesis Reactions. Chem. Sci 2019, 10, 10267–10274. [DOI] [PMC free article] [PubMed] [Google Scholar]
- (36).Albright H; Vonesh HL; Becker MR; Alexander BW; Ludwig JR; Wiscons RA; Schindler CS GaCl 3 -Catalyzed Ring-Opening Carbonyl–Olefin Metathesis. Org. Lett 2018, 20 (16), 4954–4958. [DOI] [PMC free article] [PubMed] [Google Scholar]
- (37).Djurovic A; Vayer M; Li Z; Guillot R; Baltaze J-P; Gandon V; Bour C Synthesis of Medium-Sized Carbocycles by Gallium-Catalyzed Tandem Carbonyl–Olefin Metathesis/Transfer Hydrogenation. Org. Lett 2019, 21 (19), 8132–8137. [DOI] [PubMed] [Google Scholar]
- (38).Rivero-Crespo MÁ; Tejeda-Serrano M; Pérez-Sánchez H; Cerón-Carrasco JP; Leyva-Pérez A Intermolecular Carbonyl-Olefin Metathesis with Vinyl Ethers Catalyzed by Homogeneous and Solid Acids in Flow. Angew. Chem., Int. Ed 2020, 59, 3846–3849. [DOI] [PubMed] [Google Scholar]
- (39).Tran UPN; Oss G; Breugst M; Detmar E; Pace DP; Liyanto K; Nguyen TV Carbonyl–Olefin Metathesis Catalyzed by Molecular Iodine. ACS Catal. 2019, 9 (2), 912–919. [Google Scholar]
- (40).Ludwig JR; Phan S; McAtee CC; Zimmerman PM; Devery JJ; Schindler CS Mechanistic Investigations of the Iron(III)-Catalyzed Carbonyl-Olefin Metathesis Reaction. J. Am. Chem. Soc 2017, 139 (31), 10832–10842. [DOI] [PMC free article] [PubMed] [Google Scholar]
- (41).Hanson C; Psaltakis M; Cortes J; Devery J III Catalyst Behavior in Metal-Catalyzed Carbonyl-Olefin Metathesis. J. Am. Chem. Soc 2019, 141 (30), 11870–11880. [DOI] [PMC free article] [PubMed] [Google Scholar]
- (42).Hanson CS; Devery JJ Characterizing Lewis Pairs Using Titration Coupled with In Situ Infrared Spectroscopy. J. Vis. Exp 2020, e60745. [DOI] [PMC free article] [PubMed] [Google Scholar]
- (43).Shao Y; Gan Z; Epifanovsky E; Gilbert ATB; Wormit M; Kussmann J; Lange AW; Behn A; Deng J; Feng X; Ghosh D; Goldey M; Horn PR; Jacobson LD; Kaliman I; Khaliullin RZ; Kuś T; Landau A; Liu J; Proynov EI; Rhee YM; Richard RM; Rohrdanz MA; Steele RP; Sundstrom EJ; Woodcock HL; Zimmerman PM; Zuev D; Albrecht B; Alguire E; Austin B; Beran GJO; Bernard YA; Berquist E; Brandhorst K; Bravaya KB; Brown ST; Casanova D; Chang C-M; Chen Y; Chien SH; Closser KD; Crittenden DL; Diedenhofen M; DiStasio RA; Do H; Dutoi AD; Edgar RG; Fatehi S; Fusti-Molnar L; Ghysels A; Golubeva-Zadorozhnaya A; Gomes J; Hanson-Heine MWD; Harbach PHP; Hauser AW; Hohenstein EG; Holden ZC; Jagau T-C; Ji H; Kaduk B; Khistyaev K; Kim J; Kim J; King RA; Klunzinger P; Kosenkov D; Kowalczyk T; Krauter CM; Lao KU; Laurent AD; Lawler KV; Levchenko SV; Lin CY; Liu F; Livshits E; Lochan RC; Luenser A; Manohar P; Manzer SF; Mao S-P; Mardirossian N; Marenich AV; Maurer SA; Mayhall NJ; Neuscamman E; Oana CM; Olivares-Amaya R; O’Neill DP; Parkhill JA; Perrine TM; Peverati R; Prociuk A; Rehn DR; Rosta E; Russ NJ; Sharada SM; Sharma S; Small DW; Sodt A; Stein T; Stück D; Su Y-C; Thom AJW; Tsuchimochi T; Vanovschi V; Vogt L; Vydrov O; Wang T; Watson MA; Wenzel J; White A; Williams CF; Yang J; Yeganeh S; Yost SR; You Z-Q; Zhang IY; Zhang X; Zhao Y; Brooks BR; Chan GKL; Chipman DM; Cramer CJ; Goddard WA; Gordon MS; Hehre WJ; Klamt A; Schaefer HF; Schmidt MW; Sherrill CD; Truhlar DG; Warshel A; Xu X; Aspuru-Guzik A; Baer R; Bell AT; Besley NA; Chai J-D; Dreuw A; Dunietz BD; Furlani TR; Gwaltney SR; Hsu C-P; Jung Y; Kong J; Lambrecht DS; Liang W; Ochsenfeld C; Rassolov VA; Slipchenko LV; Subotnik JE; Van Voorhis T; Herbert JM; Krylov AI; Gill PMW; Head-Gordon M Advances in Molecular Quantum Chemistry Contained in the Q-Chem 4 Program Package. Mol. Phys 2015, 113 (2), 184–215. [Google Scholar]
- (44).Grimme S Semiempirical GGA-Type Density Functional Constructed with a Long-Range Dispersion Correction. J. Comput. Chem 2006, 27 (15), 1787–1799. [DOI] [PubMed] [Google Scholar]
- (45).Zimmerman PM Automated Discovery of Chemically Reasonable Elementary Reaction Steps. J. Comput. Chem 2013, 34 (16), 1385–1392. [DOI] [PubMed] [Google Scholar]
- (46).Zimmerman PM Navigating Molecular Space for Reaction Mechanisms: An Efficient, Automated Procedure. Mol. Simul 2015, 41 (1–3), 43–54. [Google Scholar]
- (47).Zimmerman PM Growing String Method with Interpolation and Optimization in Internal Coordinates: Method and Examples. J. Chem. Phys 2013, 138 (18), 184102. [DOI] [PubMed] [Google Scholar]
- (48).Marenich AV; Olson RM; Kelly CP; Cramer CJ; Truhlar DG Self-Consistent Reaction Field Model for Aqueous and Nonaqueous Solutions Based on Accurate Polarized Partial Charges. J. Chem. Theory Comput 2007, 3 (6), 2011–2033. [DOI] [PubMed] [Google Scholar]
- (49).Lin Y-S; Li G-D; Mao S-P; Chai J-D Long-Range Corrected Hybrid Density Functionals with Improved Dispersion Corrections. J. Chem. Theory Comput 2013, 9 (1), 263–272. [DOI] [PubMed] [Google Scholar]
- (50).Neese F The ORCA Program System. Wiley Interdiscip. Rev.: Comput. Mol. Sci 2012, 2 (1), 73–78. [Google Scholar]
- (51).Contreras-García J; Johnson ER; Keinan S; Chaudret R; Piquemal J-P; Beratan DN; Yang W NCIPLOT: A Program for Plotting Noncovalent Interaction Regions. J. Chem. Theory Comput 2011, 7 (3), 625–632. [DOI] [PMC free article] [PubMed] [Google Scholar]
- (52).Glendening ED; Landis CR; Weinhold F NBO 6.0: Natural Bond Orbital Analysis Program. J. Comput. Chem 2013, 34 (16), 1429–1437. [DOI] [PubMed] [Google Scholar]
Associated Data
This section collects any data citations, data availability statements, or supplementary materials included in this article.


