Abstract
Purpose of Study:
The purpose of the study was to evaluate the effect of patient characteristics and equipment-related factors on the computed tomography (CT) dose received by patients from positron emission tomography-CT (PET-CT) using system-generated dose-length product (DLP) values and also to check the effective dose (ED) received from various CT protocols at our institute.
Materials and Methods:
This retrospective study included 78 adult patients who underwent F-18 fluorodeoxyglucose whole-body PET-CT and were divided into three groups based on the area of primary cancerous lesion. In Group A, we had 44 patients who underwent PET-CT (head-and-neck protocol), in Group B, we had 24 patients who underwent PET-CT (whole body with brain protocol), and in Group C, we had 10 patients who underwent PET-CT (pelvis protocol). All of the patients under the study are of South Asian ethnicity. A majority of patients 53.85% were males and remaining 46.15% were females. The product of conversion factor (k-coefficient), as described in “American Association of Physicists in Medicine Report No. 96” and DLP value generated by the scanner, was used to calculate the ED. Moreover, we also performed regression analysis to check relation between body weight, height, scan range, tube current, Volume computed tomography dose index (CTDIvol), DLP, and ED.
Results:
The regression analysis shows that scan range, patient height, weight, tube current, and DLP were significantly correlated with ED (P < 0.05 for all). Moreover, the DLP and conversion factor method estimated the ED from various groups. Patients under Group A (head-and-neck protocol), Group B (whole body with brain protocol), Group C (pelvis protocol) received an average ED of 22.45 mSv, 22.40 mSv, and 21.24 mSv, respectively.
Conclusion:
ED from CT component of PET-CT can be assessed as the product of scanner-generated DLP and conversion factor for selected range. Moreover, body weight, scan range, and tube current had an independent significant effect on ED received from CT.
Keywords: Computed tomography dose index, dose-length product, effective dose, positron emission tomography-computed tomography
Introduction
This study investigated the effect of biological variables of discrete differences (patient height, weight, and scan range) and computed tomography (CT) scanning parameters (tube current, CTDIvol, and dose-length product [DLP]) on effective dose (ED) of CT. A number of researchers have investigated the effects of CT scanning parameters to the radiation dose.[1] However, relatively minimal focus has been directed to identify the effect of bodily variables on that of radiation dose delivered. The present study report extends this line of investigation.
Nowadays, the fusion technology has grown leaps and bounds. Combined positron emission tomography-CT (PET-CT) represents an important advancement and helps to bring anatomical and molecular imaging to the forefront in cancer diagnosis, staging, and therapy monitoring.[2,3] The CT images are acquired along with PET for anatomical localization and attenuation correction. With this development, every center is making use of implementation of various CT protocols (arterial, venous, and delayed washout) merging with PET-acquired data, to have a more fruitful information.[4,5] However, the CT component increases the ED to patient widely from 5 mSv to 25 mSv[6,7] in comparison to the data acquired by PET alone modality.
The radiation exposure from CT can be determined by two factors: scanner related, i.e., scanner design and operator handling and patient related, i.e., bodily variables such as height, weight, and scan range.
Thus, it is required to have a clear understanding on how the patient characteristics and scanning parameters have their impact on ED delivered to the patient.
Several studies have addressed the scanner related (CTDIvol and dose-length product [DLP]) and ED correlation.[1] However, to our knowledge, there is relatively minimal attention directed at identifying the role that biological variables play in determining the ED.
Our study addresses this and attempts to focus on scanning parameters as well as patient characteristics and their correlation with ED received from CT, using system-generated DLP values and conversion factor (k-coefficient) as described in “American Association of Physicists in Medicine (AAPM) Report No. 96.”[8]
Along with this, as various CT protocols (arterial, venous, delayed, and regional) provide with additional information, it also increases the radiation burden to the patient. Hence, in this study, we also evaluate the ED delivered to patients from various CT protocols and their relation.
Materials and Methods
Subject
This study included 78 adult patients who underwent F-18 fluorodeoxyglucose (18F-FDG) whole-body PET-CT under PET-CT machine of General Electric (Discovery STE, 16 slice CT scanner and BGO crystal).
All of the patients under the study are of South Asian ethnicity. A majority of patients, 53.85%, were males and remaining 46.15% were females. Male patients had weight range from 36 Kg to 75 Kg with an average weight of 55.38 Kg, had height range from 150 cm to 182 cm with an average height of 165.7 cm, and average body mass index (BMI) of 20.08. Female patients had weight range from 26 Kg to 105 Kg with an average. weight of 50.16 Kg, had height range from 134 cm to 166 cm with an average height of 150.6 cm, and average BMI of 21.96.
All 78 patients were divided into three groups based on the area of a primary cancerous lesion. In Group A, we had 44 patients who underwent PET-CT (head-and-neck protocol – primary cancer of head and neck) with a weight range from 33 Kg to 75 Kg with an average weight of 52 Kg, had height range from 143 cm to 182 cm with an average height of 162.5 cm, and average BMI of 19.59. In Group B, we had 24 patients who underwent PET-CT (whole body with brain protocol – primary cancer of lung or breast) with a weight range from 35 Kg to 105 Kg with an average weight of 55.9 Kg, had height range from 134 cm to 175 cm with an average height of 153.5 cm, and average BMI of 23.51. In Group C, we had ten patients who underwent PET-CT (pelvis protocol – primary cancer of pelvis) with a weight range from 26 Kg to 75 Kg with an average weight of 50.2 Kg, had height range from 144 cm to 180 cm with an average height of 154.6 cm, and average BMI of 20.78. The PET-CT scan was acquired in four acquisitions in each protocol [Table 1 provides detailed CT acquisition parameters for each protocol]. The acquisitions in groups are as follows:
Table 1.
Detailed computed tomography acquisition parameters for each protocol
| Scan | Scan type | Thickness | Pitch | Tube potential (kV) | Tube current (mA) | Prep group (sec) |
|---|---|---|---|---|---|---|
| Head and neck arterial CT | Helical | 1.25 mm | 0.938:1 | 120 | 150-180 (smart mA) | 25-30 s based upon bolus tracking (arterial phase CT) |
| Brain CT | Axial | 2.5 mm | - | 120 | 250 mA | 0 s |
| Pelvis arterial CT | Helical | 1.25 mm | 0.938:1 | 120 | 150-200 (Smart mA) | 25-30 s based upon bolus tracking (arterial phase CT) |
| Thorax CT | Helical | 1.25 mm | 1.375:1 | 120 | 150-180 (smart mA) | 5.9 s |
| Whole Body CT | Helical | 3.75 mm | 1.375:1 | 120 | 150-320 (smart mA) | 40-50 s delay based upon contrast administered (venous phase CT) |
Smart mA – Modulates tube current according to patient characteristics. In Thorax CT 5.9 sec prep is to used to instruct patient to hold their breath during acquisition (to limit motion artifacts in image). For simplicity of calculation, Smart Prep CT was included in Arterial phase CT. CT: Computed tomography
Group A (head-and-neck protocol):
Breath-hold thorax CT: Mid neck to umbilical region, arms up, without intravenous contrast
Head-and-neck CT: Skull base to upper mediastinum, arms down, with intravenous contrast (arterial)
Whole-body CT (WBCT): Head to mid-thigh, arms up, without intravenous contrast
Whole-body PET: Head to mid-thigh, arms up: 2 min/bed (craniocaudal direction).
Group B (whole body with brain protocol):
Breath-hold thorax CT: Mid neck to umbilical region, arms up, without intravenous contrast
WBCT: Head to mid-thigh, arms up, with intravenous contrast (venous)
Whole-body PET: Head to mid-thigh, arms up: 2 min/bed (craniocaudal direction)
Brain CT: Brain only, arms down, no intravenous contrast.
Group C (pelvis protocol):
Breath-hold thorax CT: Mid neck to umbilical region, arms up, without intravenous contrast
Pelvis CT: Umbilical region to mid-thigh, arms up, with intravenous contrast (arterial)
WBCT: Head to mid-thigh, arms up, without intravenous contrast
Whole-body PET: Head to mid-thigh, arms up: 2 min/bed (caudocranial direction).
Three CT acquisitions were done on PET-CT scan of each patient. Hence, a total of 234 CT scans were performed on all 78 patients.
Procedure
Patients had fasted for at least 5–6 h prior for PET-CT study, and all possible contraindications to inject contrast were ruled out. Written informed consent was signed by each patient. The patients were then injected with 18F-FDG and were to sit in postinjection room in calm position, and for all brain PET-CT patients injected with 18F-FDG were kept in quiet/darkened room.
Scan was acquired after 45 min of injection with the use of multiphase CT protocol as described above in three mentioned categories of patients. An average dose of 60–70 ml intravenous contrast (Contrapaque 240: iodine concentration of 240 mg/ml) was used for an adult patient with a flow rate of 2.3–2.4 ml/s.
Timing of CT scan delay with respect to intravenous contrast was varied according to the protocol.
Head-and-neck CT: 25–30 s delay based on bolus tracking technique (arterial phase CT)
WBCT: 40–50 s delay based on contrast administered (venous phase CT)
Pelvis CT: 25–30 s delay based on bolus tracking technique (arterial phase CT).
Estimation of effective dose
In this study, we have estimated the ED from the CT alone modality in PET-CT. DLP represents the total energy delivered to the patient from CT protocol, which is obtained from the product of absorbed dose and scan length, wherein CTDIvol represents the absorbed radiation dose over the x, y, and z direction.
The various numerical expressions are as follows:
DLP (mGy.cm) = CTDIvol (mGy) ×scanlength (cm)

In CTDIvol, I represents the table increment per rotation of beam, N represents the number of tomographic sections imaged in single axial scan, and T represents the width of tomographic section along the z-axis imaged by one data channel. CTDIw is a useful indicator of scanner radiation output for a specific kVp (kept constant = 120 kVp) and mAs (variable), where the values of 1/3 and 2/3 approximate the relative areas represented by the center and edge values.[1]
To estimate the ED, we used the DLP and k-coefficient method, wherein the DLP was recorded from the system-generated data for various protocols used [Figure 1], and the conversion factor (k-coefficient) values for adult were defined as 0.0021, 0.0031, 0.0059, 0.014, 0.015, and 0.015 mSv/mGy/cm for the head, head and neck, neck, chest, abdomen-pelvis, and trunk respectively was used according to “AAPM report no 96”[8] [Table 2]. The product of conversion factor (k-coefficient) and DLP value was used to calculate the ED.[9,10,11] Sum of all regional ED gives whole-body ED obtained by the protocol.
Figure 1.
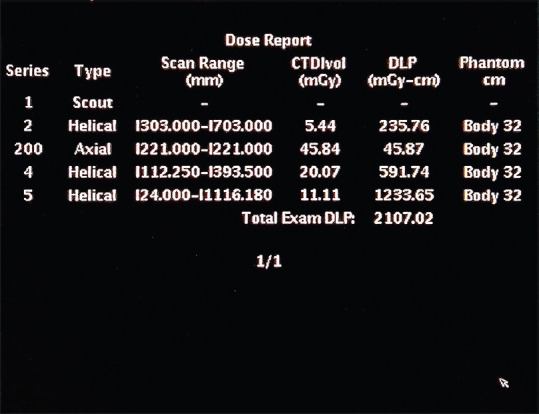
System generated dose report in case of head and neck protocol. Series 2 Represents dose report about breathhold thorax computed tomography. Series 200 Represents dose report of smart prep CT dose. Series 4- Represents dose report of arterial phase head and neck computed tomography. Series 5- Represents dose report of whole body computed tomography. Note: For simplicity of calculation, Smart Prep dose was included in arterial phase computed tomography dose
Table 2.
Conversion factor k-coefficient (mSv/mGy/cm)
| Region of the body | 0 year old | 1 year old | 5 year old | 10 year old | Adult |
|---|---|---|---|---|---|
| Head | 0.011 | 0.0067 | 0.0040 | 0.0032 | 0.0021 |
| Head and neck | 0.013 | 0.0085 | 0.0057 | 0.0042 | 0.0031 |
| Neck | 0.017 | 0.012 | 0.011 | 0.0079 | 0.0059 |
| Chest | 0.039 | 0.026 | 0.018 | 0.013 | 0.014 |
| Abdomen and pelvis | 0.049 | 0.030 | 0.020 | 0.015 | 0.015 |
| Trunk | 0.044 | 0.028 | 0.019 | 0.014 | 0.015 |
We assumed conversion factor for Whole body to be same as that of trunk, i.e., 0.015 (adult)
Data analysis
In this study, the data analysis was conducted in two steps: descriptive analysis and main analysis. The descriptive analysis was used to compare the regional ED with the whole-body ED received in each group. It is also used to find relationship between ED received by patient of all three groups (Group A, B, and C).
For the main analyses, we acquired patient's height and weight (from records), and scan range, tube current, CTDIvol, and DLP were acquired from scanning system. Association between them was tested with a series of Pearson correlations. A second set of analyses was multivariate linear regression analyses to determine whether the effect of patient characteristics and equipment is significant on ED.
Statistical analysis
In descriptive analysis, the values are presented as mean ± standard deviation (SD) and correlation was assessed by Pearson test. Multivariate linear regression was performed to determine the effect of patient height, weight, scan range, tube current, CTDIvol, and DLP on the ED. A linear regression equation was determined by least square method. P < 0.05 was considered as statistically significant. To assess the magnitude of association between variables and ED, we calculated the squared coefficients of determination (R2 and adjusted R2).
Results
Descriptive results
In Group A, patients underwent thorax CT, WBCT, and head-and-neck CT received (avg. ± SD) ED of 22.45 ± 1.58 mSv [Figure 2]; in Group B, patients underwent thorax CT, WBCT, and brain CT received (avg. ± SD) ED of 22.40 ± 2.44 mSv [Figure 3]; and in Group C, patients underwent thorax CT, WBCT, and pelvis CT received (avg. ± SD) ED of 21.24 ± 3.11 mSv [Table 3 and Figure 4].
Figure 2.
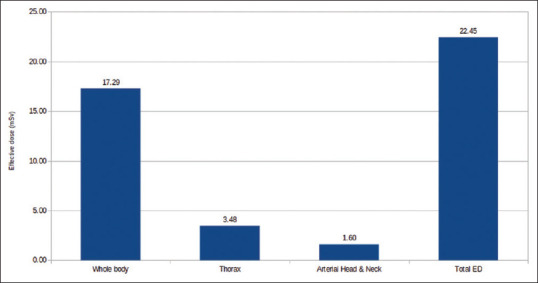
Effective dose received in head and neck protocol
Figure 3.
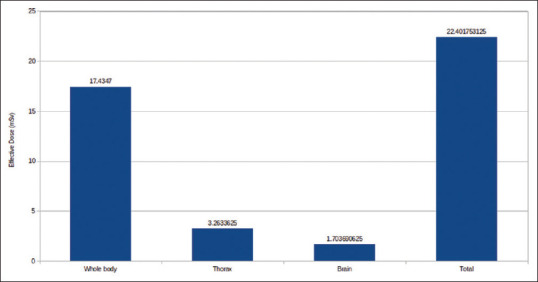
Effective dose received in whole body with brain protocol
Table 3.
Effective dose delivered in various protocols
| Group | Thorax CT | Whole body CT | Head and neck arterial CT | Brain CT | Pelvis arterial CT | Ttal |
|---|---|---|---|---|---|---|
| Group A Head and Neck protocol (mSv) |
3.47±0.26 | 17.28±1.43 | 1.69±0.18 | _ | _ | 22.45±1.58 |
| Group B Whole Body with Brain protocol (mSv) |
3.26±0.32 | 17.43±2.20 | _ | 1.7±0.16 | _ | 22.40±2.44 |
| Group C Pelvis protocol (mSv) |
3.22±0.37 | 15.72±2.83 | _ | _ | 2.29±0.26 | 21.24±3.11 |
For simplicity of calculation, Smart Prep CT was included in Arterial phase CT. ED (mSv) represented as Average±SD. SD: Standard deviation, CT: Computed tomography, ED: Effective dose
Figure 4.
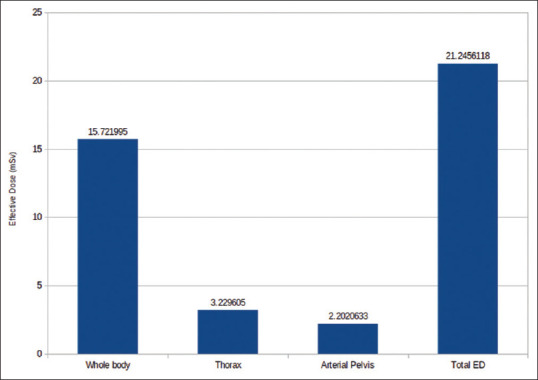
Effective dose received in pelvis protocol
Thorax CT and WBCT are common scan among all three groups, which delivered (avg. ± SD) ED of 3.37 ± 0.31 mSv and 17.13 ± 1.95 mSv, respectively. Moreover, the regional scan of head and neck, brain CT, and Pelvis CT delivered (avg. ±SD) ED of 1.69 ± 0.18 mSv, 1.70 ± 0.16 mSv, and 2.29 ± 0.26 mSv, respectively. Table 4 and Figure 5 summarize the ED received in various scans.
Table 4.
Effective dose received in various scans
| Scan | Height (cm) | Weight (Kg) | Scan range (cm) | Tube current (mA) | CTDIvol (mGy) | DLP (mGy.cm) | ED (mSv) |
|---|---|---|---|---|---|---|---|
| Head and neck arterial CT | 162.57 | 52 | 24.75 | 177.14 | 19.8 | 516.81 | 1.69 |
| Brain CT | 153.54 | 55.92 | 15 | 230 | 53.28 | 811.28 | 1.7 |
| Pelvis arterial CT | 154.6 | 50.2 | 30.7 | 197.8 | 22.24 | 710.34 | 2.29 |
| Thorax CT | 158.77 | 52.97 | 36.99 | 163.28 | 5.58 | 225.31 | 3.37 |
| Whole body CT | 158.77 | 52.97 | 97.82 | 291.13 | 11.43 | 1142.07 | 17.13 |
For simplicity of calculation, Smart Prep CT was included in Arterial phase CT. CT: Computed tomography, DLP: Dose-length product, ED: Effective dose
Figure 5.
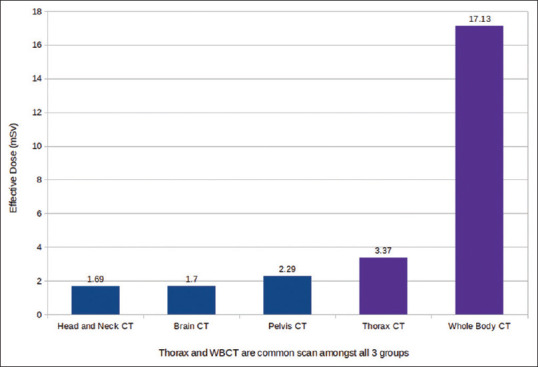
Effective dose received in various scans
Main analysis
To test the hypothesis that ED would be associated with various parameters/variables, i.e., (height, weight, scan range, tube current, CTDIvol, and DLP), a series of correlations between these were computed. Scan range, tube current, and DLP were strongly positively correlated with ED and patient's height and weight were weakly positively correlated [Table 5].
Table 5.
Correlation of various parameters with effective dose
| Pearson correlations | Height (cm) | Weight (kg) | Scan range (cm) | Tube current (mA) | CTDIvol (mGy) | DLP (mGy.cm) |
|---|---|---|---|---|---|---|
| Weight (kg) | 0.493 | |||||
| Scan range (cm) | 0.104 | 0.05 | ||||
| Tube current (mA) | −0.065 | 0.056 | 0.818 | |||
| CTDIvol (mGy) | −0.119 | 0.084 | −0.4 | 0.129 | ||
| DLP (mGy.cm) | 0.036 | 0.11 | 0.763 | 0.943 | 0.244 | |
| ED (mSv) | 0.05 | 0.064 | 0.983 | 0.884 | −0.284 | 0.834 |
Scan range, Tube current and DLP are Strongly Positively correlated with ED. Patient’s Height and Weight are Weakly Positively correlated with ED. DLP: Dose-length product, ED: Effective dose
Multivariate linear regression analysis [Table 6] shows that R2 value is 98.7%, which means that the variables and ED are strongly associated. Moreover, regression equation was determined which gives us ED as function of variables.
Table 6.
Regression analysis
| Regression Equation | |||
|---|---|---|---|
| Individual ED (mSv)=–2.35 –0.027 ˣHt (cm) +0.014 ˣWt (Kg) | |||
| +0.148 ˣScan range (cm) +0.019 ˣTube current (mA) -0.035 | |||
| ˣCTDIvol (mGy) +0.002 ˣDLP (mGy.cm) | |||
| Model summary (ɑ=0.05) | |||
| S | R2 | R2 (adjusted) | R2 (pred) |
| 0.782234 | 98.79% | 98.76% | 98.66% |
| Analysis of variance | |||
| Source | Adjusted MS | F | P |
| Regression | 1890.33 | 3089.33 | 0.000 |
| Height (cm) | 11.86 | 19.39 | 0.000 |
| Weight (kg) | 6.21 | 10.15 | 0.002 |
| Scan range (cm) | 213.05 | 348.18 | 0.000 |
| Tube current (mA) | 18.39 | 30.05 | 0.000 |
| CTDIvol (mGy) | 5.69 | 9.31 | 0.003 |
| DLP (mGy.cm) | 16.16 | 26.41 | 0.000 |
| Error | 0.61 | ||
| Lack-of-fit | 0.61 | ||
| Pure error | 0.00 | ||
| Total | |||
MS: Mean square, DLP: Dose-length product
EffectiveDose mSv = -2.35 - 0.027×Height cm + 0.014×Weight (kg)+ 0.148×Scanrange cm + 0.019×TubeCurrent mA -0.036×CTDIvol(mGy)+0.002×DLP (mGy.cm)
Conclusion
The results of this study suggest that body weight, scan range (depends on patient height), and tube current had an independent significant effect (P < 0.05, R2 value = 98.7%) on ED received from CT. Our most important finding is that ED received by patient depends mostly on scan range and tube current. Moreover, we have devised an equation to find ED in mSv from different variables.
ED received is a better parameter to allow comparison of different CT protocols used in fusion imaging of PET-CT. ED received from CT component can be estimated by multiplying DLP calculated on the scanner by conversion factor.[9,11,12] ED received from CT component of PET-CT widely varies from 5 to 25 mSv.[6,10,13,14] The ED received in whole body with brain protocol and head-and-neck protocol is almost same, i.e., 22.40 mSv and 22.45 mSv, respectively. However, ED received in pelvis protocol is 5.15% lesser as compared to them [Figure 6].
Figure 6.
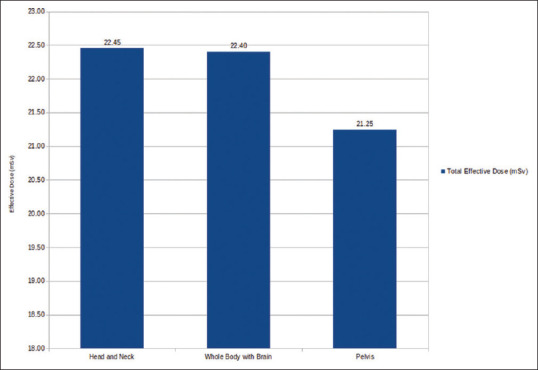
Effective dose delivered in various groups
Majority of radiation dose has been delivered through whole-body scanning, i.e., 17.13 mSv (65.4%) and remaining thorax, pelvis, head and neck, and brain CT scans contribute 12.87%, 8.7%, 6.45%, and 6.49%, respectively, to the radiation dose delivered through CT component. Indeed, the dosage is not less to be ignored; hence, a clinical justification should always be evaluated before proceeding for the study. Additional CECT data from early scans (arterial phase) provide optimal vascular enhancement, precise localization, and delineation of primary tumor.[15] Conrad et al.[16] described the superiority of scans obtained 20 s after the start of injection over scans acquired 70 s after the start. They showed that the contrast between squamous cell carcinoma of the head and neck and surrounding soft-tissue structures was significantly better on the arterial phase scans (20 s delay) than on the later scans (70-s delay).
Brain CT was performed in patients of the second group (whole body with brain CT protocol) having primary breast cancer or lung cancer because the incidence of brain metastases in patients with lung cancer in approximately 25%, with only 5% surviving beyond the 1st year after diagnosis.[17,18] Breast cancer is the second most common cause of brain metastases, with metastases occurring in at least 10%–16% of patients,[19] as these studies showing that breast and lung cancer will metastasize commonly in brain, so for accurate diagnosis of brain CT scan was performed. Through our study, we can explain that there is very minimal variation in radiation exposure in various protocols, so we can perform these protocols as they can improve diagnostic information and yield in better prognosis, thus management of disease. In the near future, with the advancement of technology,[20] we hope to reduce the ED delivery to patients with an optimal imaging quality.
Financial support and sponsorship
Nil.
Conflicts of interest
There are no conflicts of interest.
References
- 1.Nagel H.D. CT Parameters that Influence the Radiation Dose. In: Tack D, Gevenois P.A, editors. Radiation Dose from Adult and Pediatric Multidetector Computed Tomography. Medical Radiology (Diagnostic Imaging) Springer, Berlin: Heidelberg; 2007. pp. 51–79. [Google Scholar]
- 2.Townsend DW. Combined positron emission tomography-computed tomography: The historical perspective. Semin Ultrasound CT MR. 2008;29:232–5. doi: 10.1053/j.sult.2008.05.006. [DOI] [PMC free article] [PubMed] [Google Scholar]
- 3.Zaidi H, Montandon ML, Alavi A. The clinical role of fusion imaging using PET, CT, and MR imaging. Magn Reson Imaging Clin N Am. 2010;18:133–49. doi: 10.1016/j.mric.2009.09.010. [DOI] [PubMed] [Google Scholar]
- 4.Jones T, Townsend D. History and future technical innovation in positron emission tomography. J Med Imaging (Bellingham) 2017;4:011013. doi: 10.1117/1.JMI.4.1.011013. [DOI] [PMC free article] [PubMed] [Google Scholar]
- 5.Blodgett TM, Meltzer CC, Townsend DW. PET/CT: Form and function. Radiology. 2007;242:360–85. doi: 10.1148/radiol.2422051113. [DOI] [PubMed] [Google Scholar]
- 6.Shrimpton PC, Hillier MC, Lewis MA, Dunn M. National survey of doses from CT in the UK: 2003. Br J Radiol. 2006;79:968–80. doi: 10.1259/bjr/93277434. [DOI] [PubMed] [Google Scholar]
- 7.McCollough CH, Schueler BA. Calculation of effective dose. Med Phys. 2000;27:828–37. doi: 10.1118/1.598948. [DOI] [PubMed] [Google Scholar]
- 8.The Measurement, Reporting, and Management of Radiation Dose in CT. 2008 [Google Scholar]
- 9.Huda W, Ogden KM, Khorasani MR. Converting dose-length product to effective dose at CT. Radiology. 2008;248:995–1003. doi: 10.1148/radiol.2483071964. [DOI] [PMC free article] [PubMed] [Google Scholar]
- 10.Khamwan K, Krisanachinda A, Pasawang P. The determination of patient dose from (18) F-FDG PET/CT examination. Radiat Prot Dosimetry. 2010;141:50–5. doi: 10.1093/rpd/ncq140. [DOI] [PubMed] [Google Scholar]
- 11.Huda W, Mettler FA. Volume CT dose index and dose-length product displayed during CT: What good are they? Radiology. 2011;258:236–42. doi: 10.1148/radiol.10100297. [DOI] [PubMed] [Google Scholar]
- 12.Collins L. Comments on the 1990 Recommendations of the International Commission on Radiological Protection ICRP publication 60 (1991) South African Med J. 1992;81:583–6. [Google Scholar]
- 13.Brix G, Lechel U, Glatting G, Ziegler SI, Münzing W, Müller SP, et al. Radiation exposure of patients undergoing whole-body dual-modality 18F-FDG PET/CT examinations. J Nucl Med. 2005;46:608–13. [PubMed] [Google Scholar]
- 14.Tonkopi E, Ross AA, MacDonald A. JOURNAL CLUB: CT dose optimization for whole-body PET/CT examinations. AJR Am J Roentgenol. 2013;201:257–63. doi: 10.2214/AJR.12.10495. [DOI] [PubMed] [Google Scholar]
- 15.Park JE, Lee JH, Ryu KH, Park HS, Chung MS, Kim HW, et al. Improved diagnostic accuracy using arterial phase CT for lateral cervical lymph node metastasis from papillary thyroid cancer. AJNR Am J Neuroradiol. 2017;38:782–8. doi: 10.3174/ajnr.A5054. [DOI] [PMC free article] [PubMed] [Google Scholar]
- 16.Conrad R, Pauleit D, Layer G, Kandyba J, Kohlbecher R, Hortling N, et al. Spiral CT of the head-neck area: The advantages of the early arterial phase in the detection of squamous-cell carcinomas. Rofo. 1999;171:15–9. doi: 10.1055/s-1999-9890. [DOI] [PubMed] [Google Scholar]
- 17.Leone JP, Leone BA. Breast Cancer Brain Metastases: The Last Frontier. [Last accessed on 2020 Jun 09];Experimental Hematology and Oncology. BioMed Central Ltd. 2015 4(33):33. doi: 10.1186/s40164-015-0028-8. Available from: http://ehoonline.biomedcentral.com/articles/10.1186/s40164-015-0028-8 . [DOI] [PMC free article] [PubMed] [Google Scholar]
- 18.Stella GM, Corino A, Berzero G, Kolling S, Filippi AR, Benvenuti S. Brain Metastases from Lung Cancer: Is MET an Actionable Target? Vol. 11 [published correction appears in Cancers (Basel). 2019 May 10;11(5):] Cancers (Basel) 2019;11:217. doi: 10.3390/cancers11030271. Published 2019 Feb 26. doi:10.3390/cancers11030271. [DOI] [PMC free article] [PubMed] [Google Scholar]
- 19.Lagerwaard FJ, Levendag PC, Nowak PJ, Eijkenboom WM, Hanssens PE, Schmitz PI. Identification of prognostic factors in patients with brain metastases: A review of 1292 patients. Int J Radiat Oncol Biol Phys. 1999;43:795–803. doi: 10.1016/s0360-3016(98)00442-8. [DOI] [PubMed] [Google Scholar]
- 20.Lee TY, Chhem RK. Impact of new technologies on dose reduction in CT. [Last accessed on 2021 Feb 16];Eur J Radiol [Internet] 2010 76(1):28–35. doi: 10.1016/j.ejrad.2010.06.036. Available from: http://dx.doi.org/10.1016/j.ejrad.2010.06.036 . [DOI] [PubMed] [Google Scholar]


