Abstract
Objectives
We aimed to establish a set of disability weights (DWs) for COVID-19 symptoms, evaluate the disease burden of inpatients and analyse the characteristics and influencing factors of the disease.
Design
This was a multicentre retrospective cross-sectional descriptive study.
Setting
The medical records generated in three temporary military hospitals in Wuhan.
Participants
Medical records of 2702 inpatients generated from 5 February to 5 April 2020 were randomly selected for this study.
Primary and secondary outcome measures
DWs of COVID-19 symptoms were determined by the person trade-off approach. The inpatients’ medical records were analysed and used to calculate the disability-adjusted life years (DALYs). The mean DALY was evaluated across sex and age groups. The relationship between DALY and age, sex, body mass index, length of hospital stay, symptom duration before admission and native place was determined by multiple linear regression.
Results
For the DALY of each inpatient, severe expiratory dyspnoea, mild cough and sore throat had the highest (0.399) and lowest (0.004) weights, respectively. The average synthetic DALY and daily DALY were 2.29±1.33 and 0.18±0.15 days, respectively. Fever and fatigue contributed the most DALY at 31.36%, whereas nausea and vomiting and anxiety and depression contributed the least at 7.05%. There were significant differences between sex and age groups in both synthetic and daily DALY. Age, body mass index, length of hospital stay and symptom duration before admission were strongly related to both synthetic and daily DALY.
Conclusions
Although the disease burden was higher among women than men, their daily disease burdens were similar. The disease burden in the younger population was higher than that in the older population. Treatment at the hospitals relieved the disease burden efficiently, while a delay in hospitalisation worsened it.
Keywords: public health, health economics, health services administration & management
Strengths and limitations of this study.
The validity of the large sampled medical records from the military medical units was high.
To determine the pure burden of COVID-19 symptoms, comorbidity and mortality cases were excluded.
Self-reported bias of symptom duration prior to hospital admission may be high.
Cultural and ethnic differences and virus variation over time may have affected data comparison.
Background
The COVID-19 pandemic is both a global public health emergency and a major biosecurity event; it brings pain and loss to individuals and families and a heavy burden to countries and societies.1 2 Scientific evaluation of the social and economic impact of the public health incident provides an important way to determine the therapeutic effectiveness in medical institutions and an important basis for the government to formulate relevant rescue policies and recovery measures. The economic burden of disease (BOD) and injury include treatment costs and various forms of losses in life (eg, death and poor quality of life due to a temporary or sustained decline in the quality of life).3 4
There are several new features of COVID-19 compared with severe acute respiratory syndrome and the Middle East respiratory syndrome.5 The SARS-CoV-2 infection can cause symptoms such as fever, fatigue, cough, dyspnoea, headache, nausea, vomiting, abdominal pain and diarrhoea, and in severe cases, severe acute respiratory syndrome, multiple organ failure and even death.6–9 As it is an emerging disease, the BOD caused by COVID-19 remains unclear. Studying the BOD and symptoms of COVID-19 will help to deepen our understanding of the disease, its harm and severity and to predict the developing trend of the disease. Thus, public health authorities could improve the treatment and rehabilitation programmes, renew relief measures and adjust public health policies appropriately.
Since the 1990s, the WHO and the World Bank have proposed indicators to evaluate the BOD, which is a measure of the disability-adjusted life years (DALYs). This single-utility measure used to determine the burden attributable to a specific disease is calculated using the standard method proposed by Murray et al.10 The DALY is a summary measure of population health accounting for both the years of life lost (YLLs) and years lost due to disability (YLDs). The DALY was first developed for quantifying the global burden of disease (GBD), expressed as the relative magnitude of losses of healthy life associated with different causes of disease and injury.11 Since then, the DALY has been widely used globally to estimate the BOD at the national, international and regional levels.
Recently, DALY has been used to evaluate the BOD of some specific diseases. Qi et al comprehensively evaluated the direct and indirect BOD of public emergencies caused by Asian lineage avian influenza A (H7N9) infection.12 Zhang et al13 evaluated the BOD and related factors in hospitalised patients with coal workers’ pneumoconiosis and provided the basis for improving relevant medical policies. Bacellar et al14 assessed BOD in hospitalised elderly patients with neurological disorders in Brazil and recommended measures to improve the treatment plan. Adopting the WHO approach, Pei et al15 formulated the disability weights (DWs) for chronic mountain disease, which was used to calculate the BOD among soldiers stationed in Tibet and helped evaluate the ability of troops to perform tasks.
The DALY method could provide important insights into public health studies and practice regarding COVID-19. This year, a series of research studies were conducted worldwide to estimate the BOD of COVID-19 in different regions, from multiple perspectives, and using different methods. Jo et al16 adopted DWs from previous similar causes to calculate the BOD of COVID-19 in Korea, including YLDs and YLLs. Oh et al17 estimated the YLLs due to COVID-19 in 30 high-incidence countries using the WHO-provided data. To assess the socioeconomic burden of the COVID-19 pandemic in Italy, Nurchis et al18 estimated YLLs and YLDs along with the productive YLLs, and the comparable DW of lower respiratory tract infection as adopted to estimate the YLDs. Mohanty et al19 examined the impact of COVID-19 on the longevity, years of potential life lost and DALY in the USA, Italy, Germany and Sweden and adopted DWs of similar diseases as proxy. Furthermore, Ortiz-Prado et al20 assessed the BOD of COVID-19 in Ecuador by adopting the DWs of other similar diseases.
These studies contributed greatly to the understanding of BOD of COVID-19 and provided the basis for global COVID-19 public health services and related policy making. However, in recent reports, BOD assessment of COVID-19 remained at the macro level and relatively unclear, mainly because only the DWs from similar diseases were adopted, leaving COVID-19 with a singular DW, which ignored the complexity of COVID-19 symptoms. Until now, limited reports exist on China’s COVID-19 BOD, especially based on each COVID-19. Thus, we aimed to establish the DW for COVID-19 symptoms to estimate the BOD among inpatients in Wuhan, China, and to analyse the characteristics and potential influencing factors. To design this technical approach, we design a technical approach based on previous studies. The BOD of COVID-19 symptoms was evaluated from existing medical records.
Method
Selection of the population groups
To counter the public health disaster and biosecurity crisis caused by COVID-19 in Wuhan, People’s Liberation Army (PLA) performed a series of non-combat military operations, including the deployment of three temporary military hospitals (Huoshenshan Hospital (from 2 March to 5 April 2020), Taikang-Tongji Hospital (13 March–16 April 2020) and Guanggu Woman and Child Hospital (13 March–16 April 2020)). The first hospital was a newly built one, while the other two were civil medical facilities temporarily used by the PLA medical staff. While in operation, all the hospitals were designated as specialised COVID-19 hospitals.
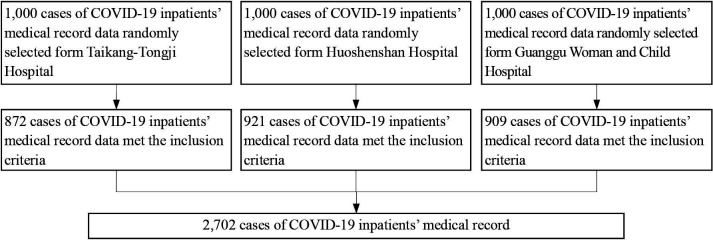
All the analysed inpatient data were randomly selected from the three temporary military hospitals’ medical records using the same recording standard. The included inpatients’ hospitalisation period ranged from 5 February to 5 April 2020. The selection process was conducted from 25 May to 5 June 2020, after the closure of the temporary hospitals (figure 1). Data for 2702 inpatients were included in this study. All the inpatients treated by the military medical staff were from the military hospitals affiliated to the PLA.
Figure 1.
Flow of inpatient selection.
The diagnosis and treatment method were based on the ‘Diagnosis and treatment standard of COVID-19 (7th edition)’ published by the People’s Republic of China’s (PRC) central government.21 The standard detailed laboratory tests for COVID-19, with pathogenic, serological and chest image criteria, were included. All patients were hospitalised before the release of the seventh edition and were reconfirmed according to the diagnostic criteria. The inclusion criteria were COVID-19 diagnosis at the hospitals according to the standard guideline and continuous treatment at these hospitals. To determine the BOD of COVID-19, inpatients with any other morbidity (other infectious diseases, other respiratory diseases, psychiatric disease, tumour, pregnancy and lactation, and chronic cardiac, liver, kidney and neurological diseases) were excluded. We also excluded COVID-19 inpatient deaths due to the reluctance of their family members to allow the use of their data for a public study. Similarly, cases with incomplete medical records were excluded.
Establishment of the DWs for COVID-19 symptoms
DW is a key component of BOD analysis that represents disease severity. It ranges from 0 to 1, where 0 represents healthy life, and 1 represents death.4 WHO has been conducting GBD studies for several years, with series of DWs derived for different health states that are the outcomes of different diseases.22–26
Because COVID-19 is a new infectious disease, no DWs exist for COVID-19 symptoms in the WHO’s DW list; thus, we attempted to establish customised DWs for COVID-19 symptoms. First, COVID-19 symptoms were listed following a literature review of newly published clinical reports on COVID-19. Three rounds of questionnaires were completed by frontline medical staff in the three military field hospitals in Wuhan to derive a raw list of COVID-19 symptoms for establishing DWs (questionnaire sample is shown in online supplemental additional file 1).
bmjopen-2021-048822supp001.pdf (114.4KB, pdf)
Then, we convened a nine-expert panel composed of three senior respiratory physicians, two senior infectious disease physicians, one epidemiologist, one public health management expert and two nursing experts. Based on the raw list of COVID-19 symptoms, the panel performed the Delphi process to determine the final symptom list for creation of DWs.27
Then, the panel members performed the person trade-off (PTO) exercise to derive each symptom’s DWs by three levels of severities (health stages).15 28 29 The health stages were described on an A4-sized vignette that contained disease-specific information in simple terminologies. As a reference framework for this task, the panel members were provided with a WHO-GBD framework table, which displayed seven disability classes and 22 anchoring example conditions. The coefficient of variation (CV) was calculated to determine the need for additional rounds of discussion and reassignment of values.
Data extraction
Basic information for the confirmed cases included the identification number, age, sex, weight, height, native place, date of onset reported by the patient, diagnostic conclusion, symptoms recorded by the medical staff and inpatient and outpatient time. Nine age groups were created: <10, 10–19, 20–29, 30–39, 40–49, 50–59, 60–69, 70–79 and >80 years. Body mass index (BMI) was calculated, while the duration of symptoms was determined as the length of stay+symptom duration before hospitalisation (self-reported in the medical record).
To accurately extract the medical data from the records, we trained six staff by same criteria. During the data extraction, the six staff members were divided into three groups of two, and when data were extracted from the records, these were cross-checked. The extraction process was conducted from 29 May to 7 August 2020.
Calculation of DALY for COVID-19 symptoms
The DALY was used to estimate the disease burden of COVID-19 symptoms. The DALY is calculated as the sum of the YLLs due to premature mortality in the population and the equivalent ‘healthy’ YLDs for incident cases of the health condition.4 11 30 However, we did not consider COVID-19 related deaths. Therefore, the DALY due to COVID-19 was equal to the YLDs. Thus, a patient’s individual DALY was calculated using the following formula15:
| (1.0) |
where D represents DW, K is an age weighting factor, C is a constant, r is the discount rate, a is the age at onset, β is a parameter from the age weighting function and L is lifetime with disability. We used the base case recommended by Murray and Lopez, with C=0.1658, r=0.03, K=1 and β=0.04.15 31
Considering that the COVID-19 inpatient hospitalisation time was relatively short, L in the formula 1.0 is shorter than 1 year; thus, the age of each inpatient was treated as fixed. Accordingly, the formula was simplified as follows:
| (2.0) |
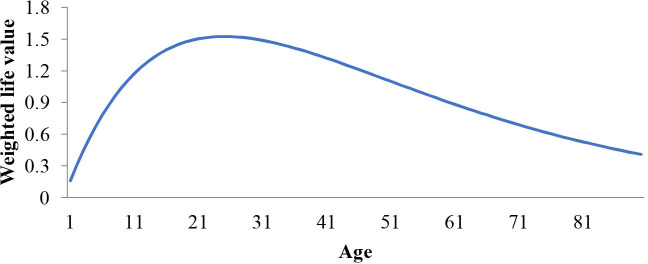
In formula 2.0, reflects the life value discounted by age. This function is based on the hypothesis that life value is different for different age groups: a person’s life value increases after they are born and reaches the peak in their youth; next, the life value declines with age (figure 2). Hence, in calculating the DALY, DALY will differ for different age groups despite identical symptoms.
Figure 2.
Curve of changes in the weighted life value with age.
We calculated the DALY as follows: (1) the cumulative duration (in days) of each health condition (a health condition is one type of symptom severity); (2) the duration was multiplied by the corresponding DW to get the DALY of each health condition; (3) all the DALY values were summed up into an inpatient’s synthetic DALY for COVID-19; and (4) the synthetic DALY was divided by the patient’s length of stay to get the daily DALY. Considering that the inpatient’s length of stay was relatively short, the unit of DALY was set as days.
Statistical analysis
The demographic characteristics of patients, such as hospitalisation, sex and native place, were evaluated. The distribution of each symptom according to the hospital, sex, and overall population, was calculated. The mean DALY, synthetic DALY, daily DALY, age, BMI and symptom course (including symptom duration before hospitalisation, length of stay and overall duration) based on the hospital, sex and age groups were calculated and compared by analysis of variance (ANOVA) or t-test (for two groups only). The ratio difference of the cumulative duration (in days) of symptom severity levels (mild, moderate and severe) was tested by a χ2 test. The proportions of BOD for each symptom by sex and age group and in the entire sample population were computed. DALY per 1000 capita was also calculated by age group and sex. Each symptom’s duration in the whole study population was also calculated.
To test the relationship between DALY and age, sex, BMI and symptom duration, separate linear regression analyses were performed using DALY as the dependent variable and age, sex, BMI, native place, symptom duration before hospitalisation and length of stay as independent variables. In the regression models, sex and native place were set as categorical variables, while the others were continuous variables. Synthetic and daily DALY were analysed, and each hospital’s study population and overall study population were analysed separately. IBM SPSS Statistics for Windows, V.25.0 (IBM Corp, Armonk, New York, USA) was used for statistical analyses. A p value <0.05 was considered statistically significant.
Patient and public involvement
This was a multicentre retrospective cross-sectional descriptive study of COVID-19 inpatients in Wuhan, PRC. The study was performed after the closure of the three temporary military hospitals. None of the inpatients were involved in any health intervention. All individual data were anonymised prior to retrieval and analysis. Because only patient data were used, no patients were directly involved in the study.
Results
Patient characteristics
Data of 2702 inpatients (872, 921 and 909 from Taikang-Tongji, Huoshenshan and Guanggu Woman and Child Hospitals, respectively) were used. Table 1 shows the inpatients’ demographic characteristics.
Table 1.
Demographic characteristics of inpatients
| Characteristics | Number of patients | Proportion (%) |
| Hospital | ||
| Taikang-Tongji | 872 | 32.27 |
| Huoshenshan | 921 | 34.09 |
| Guanggu Woman and Child | 909 | 33.64 |
| Sex | ||
| Female | 1326 | 49.07 |
| Male | 1376 | 50.93 |
| Native place | ||
| Hubei Province | 2618 | 96.89 |
| Outside Hubei Province | 84 | 3.11 |
All were Chinese, and 1326 were female, whereas 1376 were male; 2618 were natives of Hubei Province, while 84 were not. The mean age was 55.52±16.09 years and 54.18±15.85 years for female and male populations, respectively. The mean age of male patients was significantly lower (p=0.03). No significant difference was found in symptom duration before hospitalisation, length of stay and overall duration of symptoms between female and male populations.
By age groups, there were significant differences in the symptom duration before hospitalisation, length of stay and overall duration of symptoms according to the ANOVA test (p>0.05). The least significant difference (LSD) test showed that the 20–29 years age group had the least symptom duration, whereas the 60–69 years age group had the highest duration, with a significant difference between the groups (p<0.05).
Duration of symptoms
Table 2 shows the mean age, BMI, symptom duration before hospitalisation, length of stay and overall duration of symptoms according to hospital, sex and age group. There were no significant differences in age, symptom duration before hospitalisation, length of stay and overall duration of symptoms among the three hospitals according to the ANOVA test (p>0.05). The inpatients’ age ranged from 11 to 94 years (mean: 54.84±15.98 years), while BMI ranged from 16.23 to 28.7 (mean: 22.11±1.94). The length of stay ranged from 5 to 50 days (mean: 17.88±7.38 days), whereas the self-reported symptom duration before hospitalisation ranged from 2 to 72 days (mean: 24.11±15.66 days). By combining the inpatient and self-reported symptom duration before hospitalisation, we obtained the total duration of symptoms, which ranged from 7 to 94 days (mean: 41.99±16.37 days).
Table 2.
Means of age, body mass index, symptom duration before hospitalisation, length of stay and overall duration of symptoms by hospital, sex and age group of inpatients
| Age | Body mass index | Symptoms duration before hospitalisation (days) | Length of stay (days) | Overall duration of symptoms (days) | |
| Hospital | |||||
| Taikang-Tongji (n=872) | 54.76±15.75 | 22.25±1.92 | 24.36±15.92 | 17.92±7.42 | 42.28±16.57 |
| Huoshenshan (n=921) | 55.21±15.88 | 22.02±2.00 | 24.65±15.65 | 17.91±7.34 | 42.55±16.33 |
| Guanggu Woman and Child (n=909) | 54.53±16.29 | 22.07±1.90 | 23.34±15.40 | 17.80±7.39 | 41.15±16.21 |
| Sex | |||||
| Female (n=1326) | 55.52±16.09 | 22.14±1.92 | 24.11±15.40 | 18.11±7.34 | 42.22±16.04 |
| Male (n=1376) | 54.18±15.85 | 22.08±1.96 | 24.12±15.92 | 17.66±7.41 | 41.77±16.69 |
| Age group (years) | |||||
| <20 (n=49) | 15.59±2.53 | 21.79±2.19 | 24.61±14.01 | 13.22±5.67 | 37.84±13.16 |
| 20–29 (n=116) | 25.35±2.53 | 21.95±1.76 | 16.28±12.36 | 14.91±5.69 | 31.20±14.32 |
| 30–39 (n=305) | 34.87±2.84 | 22.21±1.98 | 23.77±16.68 | 15.79±6.71 | 39.56±17.44 |
| 40–49 (n=529) | 44.84±2.96 | 22.10±1.97 | 21.56±14.29 | 17.24±6.93 | 38.80±14.31 |
| 50–59 (n=592) | 54.68±2.80 | 22.13±1.97 | 23.83±15.81 | 17.98±7.20 | 41.81±16.15 |
| 60–69 (n=635) | 64.16±2.72 | 22.2±1.910 | 27.63±16.08 | 18.49±7.12 | 46.12±16.39 |
| 70–79 (n=306) | 73.96±2.88 | 21.99±1.84 | 25.12±15.95 | 20.34±8.09 | 45.46±16.04 |
| >79 (n=170) | 84.49±3.35 | 21.97±2.04 | 23.94±14.37 | 19.86±8.96 | 43.79±17.55 |
| Overall (n=2702) | 54.84±15.98 | 22.11±1.94 | 24.11±15.66 | 17.88±7.38 | 41.99±16.37 |
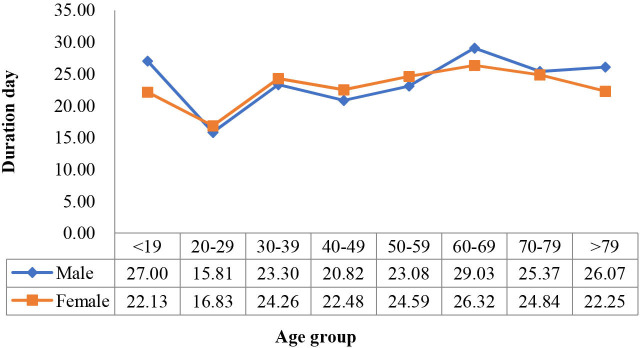
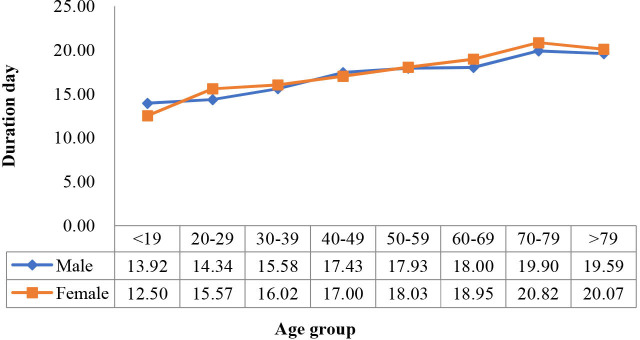
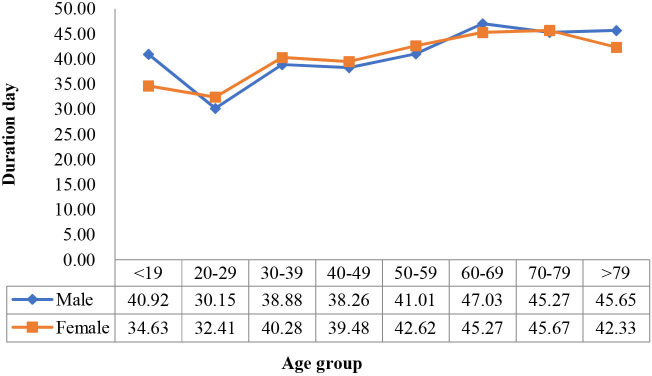
To further analyse the disease course (duration of symptom before hospitalisation, length of stay and overall duration of symptom), we drew line diagrams of the means by age group and sex (figures 3–5). We also performed a two-way ANOVA to test for the difference in the mean course of the disease by age group and sex. The results showed that age was significantly associated with the disease variables (p<0.05), while sex was not, and that the two factors had no significant interaction (p>0.05).
Figure 3.
Duration of symptoms before hospitalisation by age group in female and male populations.
Figure 4.
Length of hospital stay by age group in female and male populations.
Figure 5.
Overall duration of symptom changes with age group in female and male populations.
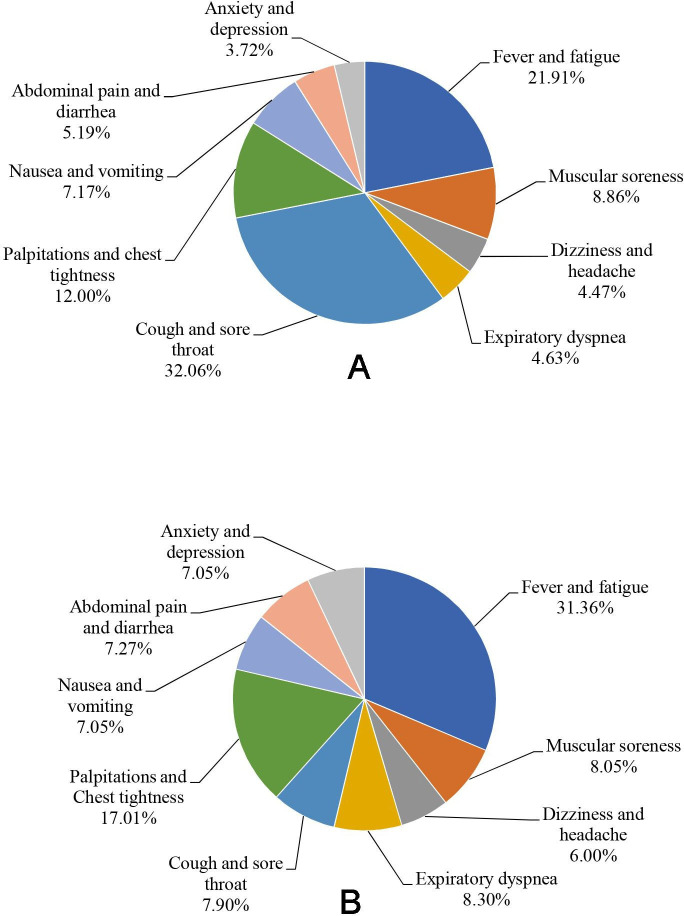
We also calculated each symptom’s cumulative duration (in days) by three levels of severity in the overall sample population (table 3). Fever and fatigue had the longest duration, with a cumulative duration of 26 863 days. The lowest cumulative duration was for anxiety and depression (4565 days). By χ2 test, the proportion of severity differed significantly among different symptoms (p<0.05). Anxiety and depression had the highest proportion of severe conditions (30.54%), whereas cough and sore throat had the highest proportion of mild conditions (10.63%). The cumulative durations (in days) by symptoms are shown in figure 6A. Cough and sore throat contributed the maximum to symptom duration (32.06%), whereas anxiety and depression contributed the least (3.72%).
Table 3.
Each COVID-19 symptom’s cumulative duration (in days) in the study population
| Symptoms | Mild | Moderate | Severe | Overall duration (days) | |||
| Day | % | Day | % | Day | % | ||
| Fever and fatigue | 2231 | 8.31 | 20 846 | 77.60 | 3785 | 14.09 | 26 863 |
| Muscular soreness | 334 | 3.08 | 8220 | 75.71 | 2303 | 21.21 | 10 858 |
| Dizziness and headache | 92 | 1.68 | 3864 | 70.51 | 1524 | 27.81 | 5481 |
| Expiratory dyspnoea | 104 | 1.83 | 4096 | 72.23 | 1471 | 25.94 | 5672 |
| Cough and sore throat | 4180 | 10.63 | 30 172 | 76.75 | 4959 | 12.61 | 39 312 |
| Palpitations and chest tightness | 862 | 5.86 | 11 232 | 76.34 | 2620 | 17.81 | 14 715 |
| Nausea and vomiting | 387 | 4.40 | 6434 | 73.19 | 1970 | 22.41 | 8792 |
| Abdominal pain and diarrhoea | 150 | 2.36 | 4534 | 71.30 | 1675 | 26.34 | 6360 |
| Anxiety and depression | 35 | 0.77 | 3135 | 68.69 | 1394 | 30.54 | 4565 |
| Overall | 8375 | 6.83 | 92 533 | 75.47 | 21 701 | 17.70 | 122 610 |
Figure 6.
(A) The proportion of accumulative duration (in day) by symptoms in the study population. (B) The proportion of DALY by symptoms in the study population. DALY, disability-adjusted life years.
DWs of COVID-19 symptoms
After two rounds of the Delphi process by the panel, we developed a nine-item COVID-19 symptom list with six categories. Each symptom included three levels of severity (mild, moderate and severe), thereby representing 27 health stages. Based on these, we derived the DWs for each health stage by the PTO exercise; along with the expert panel, a consensus was reached at the fifth round of the Delphi process (CV<0.5). Thus, the DWs of 27 COVID-19 health stages were derived; severe expiratory dyspnoea had the highest weight of 0.399, while mild cough and sore throat had the lowest weight of 0.004 (table 4).
Table 4.
Disability weights for the symptoms of COVID-19
| Category | Symptom categories | Health stages | DWs | 95% CI |
| Systemic symptoms | Fever and fatigue | Mild | 0.006 | (0.004 to 0.008) |
| Moderate | 0.051 | (0.036 to 0.066) | ||
| Severe | 0.133 | (0.089 to 0.177) | ||
| Muscular soreness | Mild | 0.015 | (0.012 to 0.018) | |
| Moderate | 0.054 | (0.041 to 0.067) | ||
| Severe | 0.110 | (0.059 to 0.113) | ||
| Neurological symptoms | Dizziness and headache | Mild | 0.028 | (0.019 to 0.037) |
| Moderate | 0.083 | (0.055 to 0.111) | ||
| Severe | 0.163 | (0.109 to 0.217) | ||
| Respiratory symptoms | Expiratory dyspnoea | Mild | 0.045 | (0.040 to 0.050) |
| Moderate | 0.108 | (0.085 to 0.131) | ||
| Severe | 0.399 | (0.293 to 0.505) | ||
| Cough and sore throat | Mild | 0.004 | (0.003 to 0.005) | |
| Moderate | 0.011 | (0.008 to 0.014) | ||
| Severe | 0.034 | (0.023 to 0.045) | ||
| Cardiovascular symptoms | Palpitations and chest tightness | Mild | 0.041 | (0.029 to 0.053) |
| Moderate | 0.072 | (0.048 to 0.096) | ||
| Severe | 0.179 | (0.120 to 0.238) | ||
| Gastrointestinal symptoms | Nausea and vomiting | Mild | 0.009 | (0.006 to 0.012) |
| Moderate | 0.057 | (0.038 to 0.076) | ||
| Severe | 0.130 | (0.089 to 0.171) | ||
| Abdominal pain and diarrhoea | Mild | 0.011 | (0.008 to 0.014) | |
| Moderate | 0.091 | (0.062 to 0.120) | ||
| Severe | 0.194 | (0.128 to 0.260) | ||
| Psychological symptoms | Anxiety and depression | Mild | 0.030 | (0.021 to 0.039) |
| Moderate | 0.120 | (0.084 to 0.156) | ||
| Severe | 0.366 | (0.243 to 0.489) |
DWs, disability weights.
DALY of inpatients
According to the formula and DWs, the DALY of each inpatient for each symptom was calculated, as well as their synthetic DALY and daily DALY. The proportion of DALY in the study population is shown in figure 6B. Among these, fever and fatigue contributed the most in DALY (31.36%), whereas nausea and vomiting and anxiety and depression contributed the least (7.05%).
The mean and SD of DALY for each symptom by hospital, sex and overall study population are shown in table 5, and those by age group are shown in table 6. The mean overall DALY was 2.29±1.33 days, whereas the mean daily DALY was 0.18±0.15 days. No significant difference was noted in each symptom’s DALY, synthetic DALY or daily DALY among the hospitals (p>0.05). However, in the LSD test, synthetic DALY in Huoshenshan Hospital was significantly lower than that in Taikang-Tongji Hospital (p=0.048) and Guanggu Woman and Child Hospital (p=0.031). The daily DALY in Huoshenshan Hospital was significantly lower than that in Guanggu Woman and Child Hospital (p=0.023). The DALY for fever and fatigue, muscular soreness, palpitations and chest tightness, and nausea and vomiting, and synthetic DALY were significantly lower for male than for female patients (p>0.05). In the inpatient population, the overall DALY per 1000 capita was 6.28, whereas in the female and male populations, the overall DALY per 1000 capita was 6.07 and 6.51 years, respectively.
Table 5.
The mean DALY of COVID-19 inpatients or all symptoms, according to hospital, sex, and overall study population
| Symptom | Taikang-Tongji Hospital (n=872) | Huoshenshan Hospital (n=921) | Guanggu Woman and Child Hospital (n=909) | Woman (n=1326) |
Man (n=1376) |
Overall (n=2702) |
| Fever and fatigue | 0.72±0.60 | 0.70±0.59 | 0.73±0.63 | 0.75±0.61 | 0.69±0.60* | 0.72±0.61 |
| Muscular soreness | 0.19±0.18 | 0.18±0.17 | 0.18±0.17 | 0.19±0.18 | 0.18±0.17* | 0.18±0.17 |
| Dizziness and headache | 0.14±0.18 | 0.13±0.17 | 0.14±0.20 | 0.13±0.17 | 0.14±0.19 | 0.14±0.18 |
| Expiratory dyspnoea | 0.18±0.31 | 0.18±0.32 | 0.21±0.38 | 0.19±0.34 | 0.19±0.33 | 0.19±0.34 |
| Cough and sore throat | 0.18±0.12 | 0.18±0.12 | 0.18±0.13 | 0.18±0.12 | 0.18±0.13 | 0.18±0.12 |
| Palpitations and chest tightness | 0.41±0.45 | 0.37±0.40 | 0.39±0.43 | 0.42±0.44 | 0.36±0.41* | 0.39±0.43 |
| Nausea and vomiting | 0.16±0.24 | 0.16±0.23 | 0.17±0.24 | 0.17±0.25 | 0.15±0.23* | 0.16±0.24 |
| Abdominal pain and diarrhoea | 0.18±0.30 | 0.16±0.26 | 0.17±0.24 | 0.17±0.26 | 0.16±0.28 | 0.17±0.27 |
| Anxiety and depression | 0.16±0.23 | 0.15±0.21 | 0.17±0.24 | 0.16±0.23 | 0.17±0.23 | 0.16±0.23 |
| Total DALY | 2.33±1.33 | 2.21±1.26† | 2.34±1.38 | 2.38±1.33 | 2.21±1.32* | 2.29±1.33 |
| DALY per day | 0.19±0.14 | 0.18±0.14†‡ | 0.19±0.16 | 0.19±0.14 | 0.18±0.15 | 0.18±0.15 |
*P<0.05 versus woman.
†P<0.05 versus Guanggu Woman and Child Hospital.
‡P<0.05 versus Taikang-Tongji Hospital.
DALY, disability-adjusted life years.
Table 6.
COVID-19 inpatient DALY by symptoms and age group
| Symptom | <20 years (n=49) |
20–29 years (n=116) |
30–39 years (n=305) |
40–49 years (n=529) |
50–59 years (n=592) |
60–69 years (n=635) |
70–79 years (n=306) |
>79 years (n=170) |
| Fever and fatigue | 0.75±0.58 | 0.79±0.73 | 0.99±0.89 | 0.88±0.70 | 0.73±0.54 | 0.60±0.42 | 0.55±0.38 | 0.39±0.28 |
| Muscular soreness | 0.14±0.12 | 0.16±0.19 | 0.25±0.23 | 0.22±0.20 | 0.19±0.16 | 0.16±0.13 | 0.15±0.12 | 0.11±0.09 |
| Dizziness and headache | 0.15±0.18 | 0.13±0.16 | 0.17±0.22 | 0.16±0.22 | 0.16±0.21 | 0.11±0.13 | 0.10±0.11 | 0.08±0.09 |
| Expiratory dyspnoea | 0.19±0.24 | 0.11±0.15 | 0.18±0.28 | 0.21±0.43 | 0.25±0.45 | 0.17±0.24 | 0.13±0.19 | 0.18±0.25 |
| Cough and sore throat | 0.20±0.09 | 0.25±0.13 | 0.26±0.15 | 0.21±0.14 | 0.18±0.12 | 0.15±0.09 | 0.14±0.08 | 0.09±0.06 |
| Palpitations and chest tightness | 0.33±0.43 | 0.54±0.54 | 0.51±0.61 | 0.47±0.5 | 0.37±0.35 | 0.37±0.34 | 0.31±0.33 | 0.17±0.17 |
| Nausea and vomiting | 0.21±0.28 | 0.25±0.36 | 0.21±0.30 | 0.17±0.23 | 0.18±0.25 | 0.15±0.22 | 0.10±0.12 | 0.06±0.07 |
| Abdominal pain and diarrhoea | 0.10±0.11 | 0.25±0.31 | 0.22±0.43 | 0.22±0.36 | 0.15±0.20 | 0.13±0.17 | 0.13±0.17 | 0.10±0.16 |
| Anxiety and depression | 0.21±0.25 | 0.18±0.24 | 0.21±0.28 | 0.20±0.28 | 0.19±0.25 | 0.14±0.16 | 0.09±0.12 | 0.06±0.08 |
| Synthetic DALY | 2.28±0.93 | 2.65±1.46 | 2.98±1.87 | 2.74±1.52 | 2.41±1.12 | 1.98±0.92 | 1.70±0.79 | 1.24±0.69 |
| DALY per day | 0.21±0.11 | 0.21±0.15 | 0.25±0.18 | 0.22±0.17 | 0.20±0.16 | 0.15±0.10 | 0.11±0.06 | 0.09±0.06 |
DALY, disability-adjusted life years.
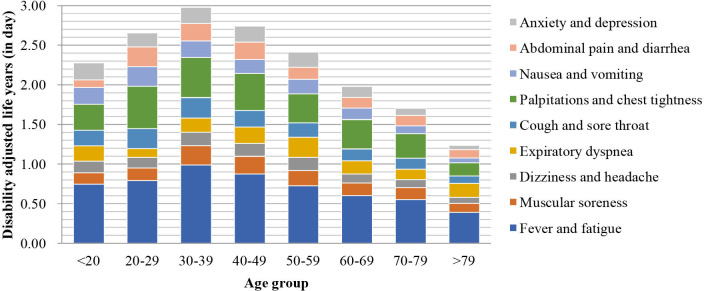
According to the ANOVA test, the mean DALY by age groups differed significantly for each symptom and for the synthetic DALY and daily DALY (p<0.05). The DALY for both single symptoms and synthesised DALY had the tendency of an inverse U-shaped curve. The DALY increased with age, reached a peak in the prime of life and then slowly decreased with age. In this study, the 40–49 years age group had the highest DALY for expiratory dyspnoea, while the 20–29 years age group had the highest DALY for palpitations and chest tightness, nausea and vomiting, and abdominal pain and diarrhoea. DALY for the other symptoms, synthetic DALY and daily DALY peaked in those aged 20–29 years.
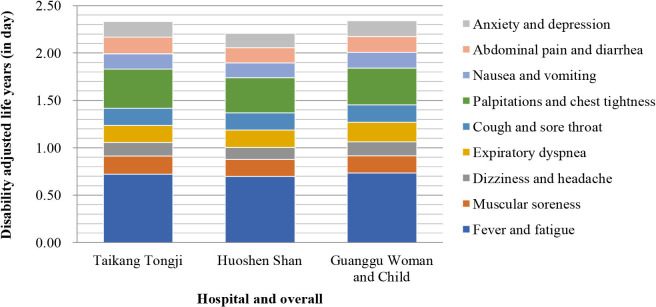
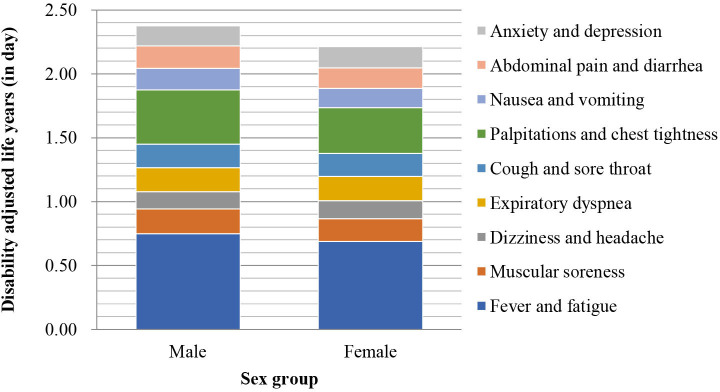
The composition of synthetic DALY for each symptom by hospital is shown in figure 7, and that by sex and age group is shown in figures 8 and 9, respectively.
Figure 7.
Composition of each military temporary hospital’s synthetic disability-adjusted life year.
Figure 8.
Composition of each sex group’s synthetic disability-adjusted life year.
Figure 9.
Composition of each age group’s synthetic disability-adjusted life year.
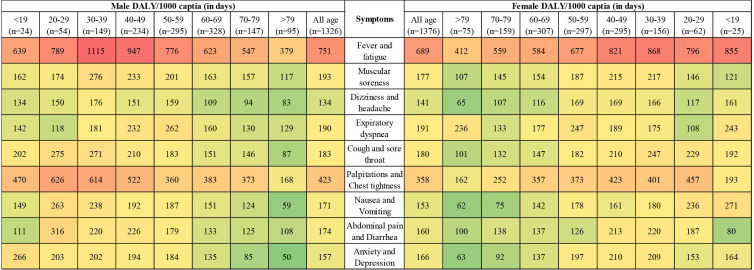
To visualise each symptom’s DALY by age group and sex, we drew a thermal map for each subgroup’s DALY per 1000 capita (in days; figure 10). Fever and fatigue were in the most intense (red) area, while palpitations and chest tightness were in the next intense area, for both female and male populations. The female population aged 30–39 years had the highest DALY score of 1115 days per 1000 capita. Contrarily, in the female population above 79 years, the lowest DALY 50 days per 1000 capita was found.
Figure 10.
Thermal map of COVID-19 inpatient’s DALY by sex and age group (DALY per 1000 capita). DALY, disability-adjusted life year.
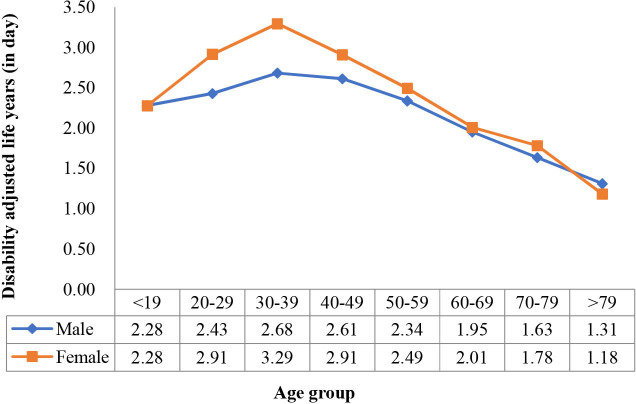
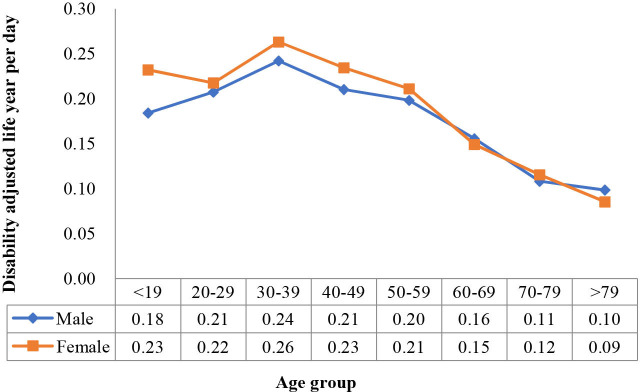
We also identified the changing curves of the mean synthetic DALY and daily DALY by age group and sex (figures 11 and 12). The two-way ANOVA showed that both age and sex significantly affected synthetic DALY (p<0.05), and there was a significant interaction effect between the two variables (p=0.02). However, when DALY per day was the dependent variable, the significant difference with sex was lost (p=0.08), whereas age remained significant (p<0.05), and the interaction effect between the two variables was also lost (p=0.518).
Figure 11.
Synthetic disability-adjusted life year changes with age group in female and male populations.
Figure 12.
Disability-adjusted life year per day changes with age group in female and male populations.
Linear regression analyses
The results of the multiple linear models are shown in table 7. When synthetic DALY was set as the dependent variable, all four models were significant (p<0.05), with R2 ranging from 0.214 to 0.240. In the four models, symptom duration before hospitalisation and length of stay were significantly positively associated with synthetic DALY, while age was significantly negatively associated with the overall synthetic DALY. For sex and BMI, however, the four models showed different results. In the Guanggu Woman and Child Hospital model, sex and BMI were not significant (p=0.098 and p=0.146); in the other three models, sex and BMI were significant, indicating that the female population had higher DALY than the male population (p<0.05) and that patients with a high BMI had higher DALY (p<0.05).
Table 7.
Linear regression analyses between COVID-19 inpatient’s DALY and individual variables
| Variable | Model type I* | Model type II† | ||||||||||||||
| Overall sample | Taikang-Tongji | Huoshenshan | Guanggu Woman and Child | Overall sample | Taikang-Tongji | Huoshenshan | Guanggu Woman and Child | |||||||||
| R2=0.222 | R2=0.214 | R2=0.224 | R2=0.240 | R2=0.164 | R2=0.188 | R2=0.170 | R2=0.153 | |||||||||
| β | P value | β | P value | β | P value | β | P value | β | P value | β | P value | β | P value | β | P value | |
| Age | −0.415 | <0.001 | −0.431 | <0.001 | −0.388 | <0.001 | −0.429 | <0.001 | −0.290 | <0.001 | −0.288 | <0.001 | −0.269 | <0.001 | −0.312 | <0.001 |
| Sex | 0.069 | <0.001 | 0.070 | 0.020 | 0.088 | 0.003 | 0.048 | 0.098 | 0.037 | 0.037 | 0.047 | 0.123 | 0.070 | 0.022 | −0.002 | 0.956 |
| Symptom duration before hospitalisation | 0.166 | <0.001 | 0.169 | <0.001 | 0.206 | <0.001 | 0.133 | <0.001 | 0.208 | <0.001 | 0.207 | <0.001 | 0.251 | <0.001 | 0.180 | <0.001 |
| Length of stay | 0.312 | <0.001 | 0.265 | <0.001 | 0.334 | <0.001 | 0.338 | <0.001 | −0.139 | <0.001 | −0.184 | <0.001 | −0.134 | <0.001 | −0.108 | 0.001 |
| Body mass index | 0.048 | 0.005 | 0.090 | 0.003 | 0.011 | 0.719 | 0.042 | 0.146 | 0.062 | <0.001 | 0.101 | 0.001 | 0.030 | 0.331 | 0.056 | 0.068 |
| Native place | 0.015 | 0.365 | 0.000 | 0.987 | −0.017 | 0.549 | 0.030 | 0.303 | 0.003 | 0.856 | −0.005 | 0.882 | −0.002 | 0.951 | 0.024 | 0.437 |
*Dependent variable is overall DALY.
†Dependent variable is DALY per day.
DALY, disability-adjusted life years.
When DALY per day was set as the dependent variable, all four models were significant (p<0.05), with R2 ranging from 0.153 to 0.188. For age and symptom duration before hospitalisation, the level of significance was the same as with model I. Length of stay remained significant; however, the effectiveness was negatively reversed for DALY. For sex, the overall sample and Huoshenshan Hospital models were significant (p=0.037 and p=0.022, respectively), and for BMI, the overall sample and Taikang-Tongji Hospital models were significant (p<0.001 and p=0.001, respectively). In all the models, native place was not significant (p>0.05).
Discussion
Principal findings
According to this study, each cured inpatient averagely loses about 2–3 days of healthy life due to COVID-19 symptoms and discounts almost one-fifth of the daily quality of life. Viewed from the population’s perspective, the indirect life loss per 1000 inpatients was >6 years, even if death was not considered. If we consider the increasing number of COVID-19 inpatients worldwide,32 the indirect life loss could be an enormous figure. Considering the prehospitalisation symptoms and temporary or permanent loss of body function after discharge, the cumulative loss of life would be manyfold higher. The difference in inpatient BOD of each COVID-19 symptom in the three hospitals was relatively small; however, when the BOD was added, inpatients at Huoshenshan Hospital showed a relatively lower overall BOD than the other two hospitals’ inpatients. However, the difference was negligible. This can be accounted for by the greater investment of manpower and material resources at Huoshenshan Hospital.
Regarding DWs, among the main symptoms of COVID-19, severe expiratory dyspnoea accounted for the most serious BOD, followed by negative psychological symptoms such as severe anxiety and depression. In actual cases, however, the prevalence of severe depression and dyspnoea among the inpatient population was not high. Although the prevalence and BOD of anxiety and depression were not high, the ratios of their severity were, and these should be considered in medical care. Among the inpatient population, the most common symptoms were cough and sore throat, but these had a low contribution to the BOD. In contrast, fever and fatigue largely contributed to the BOD.
Regarding the symptoms of COVID-19, from which the DWs were derived, in addition to fever and dry cough, COVID-19 patients had gastrointestinal symptoms such as nausea and vomiting, diarrhoea, abdominal discomfort and abnormal liver function, and the viral nucleic acid can be detected in the patients’ faeces.33 34 A possible pathogenic mechanism of COVID-19 is as follows:7 35 a cytokine storm caused by viral infection leads to an increase in the neutrophil count, which in turn results in the imbalance and excessive activation of the immune response and immune pathology, focal proliferation of lung cells and accumulation of multinucleated giant cells. These trigger apoptosis of the alveolar epithelial and endothelial cells and diffuse alveolar injury and interstitial pulmonary fibrosis, resulting in progressive hypoxia and injury to the lungs, heart, liver and other organs. Moreover, SARS-CoV-2 enters the cells primarily through the ACE2 receptor.36 ACE2 is highly expressed in type II alveolar epithelial cells and in the small intestine, duodenum, colon and liver, suggesting that the virus may invade target organs in the digestive tract via the ACE2 receptor, causing primary injury and digestive symptoms.37 Anxiety and depression are also common in hospitalised COVID-19 patients. Anxiety, depression and other psychological stress responses can stimulate sympathetic nervous system response and increase the systemic arterial pressure and heart rate.38 Therefore, the psychological stress due to anxiety and depression may cause tachycardia and increase the left ventricular afterload, thus aggravating pulmonary oedema and exacerbating the lung function. The emotional and somatisation symptoms caused by the psychological stress may also affect the immune system through neuroendocrine pathways, thereby affecting the patient’s rehabilitation process and increasing the BOD.39 40
The BOD of female inpatients was higher than that of male inpatients, which is similar to the findings in the Korean report;16 however, when the BOD was shared daily between the hospitals, there were no significant differences. This indicated that the symptoms in female inpatients during hospitalisation were more severe (ie, the symptoms fluctuated dramatically during hospitalisation). Specific symptoms such as fever, fatigue, muscular soreness, palpitations, chest tightness, nausea and vomiting could result in a higher BOD in female than in male inpatients. For other symptoms, there was no significant difference between female and male populations in the BOD.
Contrary to general thinking, the BOD of the younger population was higher than that of the older population. Both ANOVA and linear models supported this conclusion. The main reason for this trend was that the ‘value’ of life at different age stages was fully accounted for in the BOD evaluation. The illness among youth and middle-aged individuals could bring about greater personal, social and economic losses. For the synthetic DALY or daily DALY, most linear models indicated that the BOD for obese people was more severe. Obesity affects the immune function of the body, and the burden borne by the organs in obese people is heavier than in non-obese people. Obese people are more likely to suffer from various types of infection, including COVID-19, and experience more serious complications.41 42 Although synthetic DALY increased with the hospitalisation duration, daily DALY decreased significantly. Although the cumulative BOD increased, the BOD shared per day continuously decreased, and the trend of this reduction was very obvious. It indicated that patients received better treatment during hospitalisation and that the symptoms continued to ameliorate with medical care. In contrast, the longer the symptom duration before hospitalisation, the heavier the BOD of inpatient duration, indicating that delayed treatment may aggravate the BOD and lead to the consumption of more medical resources. In addition, teenagers and some older age groups, especially those aged above 60 years, exhibited a longer duration of symptoms before hospitalisation in our study.
Strengths and limitations
Our work first proposed the COVID-19 DWs by each main COVID-19 symptom and calculated the inpatient BOD caused by the symptoms. Although the validity of the large sampled medical records from the military medical units was high, there are some limitations to this study. First, because this was a retrospective rather than prospective study, the data acquired from the medical records may not be fully accurate. The duration of symptoms before admission relied on patients’ self-report, which could cause potential self-reported bias. Notwithstanding, considering the relatively large sample, despite adjustment for potential bias, the macroscopic trend could be detected at statistical analysis.
Second, the medical records were generated in the early stages of the COVID-19 outbreak when the knowledge about COVID-19 was limited. During that time, the diagnosis and treatment protocol of COVID-19 did not include symptoms such as ageusia and anosmia. Thus, there were only a few records of these symptoms in our data. Consequently, we did not include these as the main symptom in this study. However, because inpatients were at the acute stage of the disease, the discomfort from ageusia and anosmia could be clubbed with respiratory and gastrointestinal symptoms. When calculating the disease burden of respiratory and gastrointestinal symptoms, we could make up for the lack of disease burden caused by ageusia and anosmia. Meanwhile, in most cases, ageusia and anosmia were more noticeable after discharge, when other acute symptoms had gradually disappeared. Thus, these symptoms could be treated as sequelae of COVID-19 rather than the main symptoms of inpatients in the acute stage. Third, because this study is based on Chinese cultural and ethnic backgrounds in the early stage of the COVID-19 pandemic, these, combined with the virus strain variations over time, may affect the comparability of the results worldwide. The DWs derived from this study may be limited and should be considered as regional DWs of COVID-19, while the study could be considered a pilot for an international COVID-19 BOD study. Notwithstanding, our primary aim was to focus on the regional disease burden and public health management; the cultural difference may therefore not have had a great impact on our findings.
Moreover, to determine BOD caused only by COVID-19 symptoms, this study excluded inpatients with comorbidity. When the COVID-19 symptoms are superimposed on other diseases, the effect might have been complex and may not have been easily evaluated using simple linear summarisation function; moreover, quantitative differentiation of BOD purely caused by COVID-19 symptoms would have been challenging. Because the BOD of COVID-19 comorbidities will be helpful for understanding the COVID-19 burden, it should be considered in future studies. Thus, in this study, that inpatients with pre-existing medical conditions were excluded could have affected the findings in the following two ways: (a) the severity and disease duration may have been milder and shorter, respectively and (b) the exclusion of patients with a pre-existing psychiatric disease could have explained the short duration of reported anxiety and depression during hospitalisation. Besides, deaths were excluded. Thus, this study evaluated DALY in the same way as YLD caused by symptoms during hospitalisation.
Implications for health service
The BOD of COVID-19 and its symptoms in the inpatient population are an indirect economic and social burden; however, these are ignored by some public health authorities. This study suggests that to reduce the BOD, symptomatic treatment should focus on symptoms and behaviours that cause a higher BOD and the BOD for vulnerable populations. For example, since cardiovascular and respiratory symptoms in female inpatients were more severe, as were systemic symptoms, focused attention should be on female patients’ cardiovascular and respiratory systems during the acute stage. Although the symptoms in elderly people may be slightly more severe, it is more significant to reduce the disease burden in youth and middle-aged inpatients with COVID-19 from a macroeconomic perspective, if the medical resources are limited. It is also necessary to reduce the disease burden of obese people by strengthening the intervention in this population during the treatment. Besides, the findings suggest that earlier detection, diagnosis and treatment of COVID-19 are very important for the healthcare system. However, the findings also suggest that older individuals may have difficulty seeking medical treatment or may lack vigilance of their health, which could result in the consumption of more medical resources. Thus, relevant social service departments should be strengthened to provide help and support for teenagers and elderly people.
Conclusion
COVID-19 symptoms could cause heavy BOD in inpatients. The BOD for the female population was higher than that for the male population; however, the daily BOD between male and female inpatients was similar. When the changing life value with age was considered, the disease burden of the younger population was higher than that of the older population, except for teenagers. The treatment at the three military hospitals efficiently relieved the BOD of the inpatients, despite similar treatment effects. Delay in hospitalisation could worsen the BOD for patients with COVID-19. Thus, there is a need for the deployment of adequate medical resources for early hospitalisation of patients with moderate or severe symptoms by the public health authority.
Supplementary Material
Acknowledgments
The authors would like to thank the professional guidance and medical staff, including managers, physicians, epidemiologists, sanitarians and nurses in the target wards for their excellent assistance.
Footnotes
Contributors: XLi and MH conceived and designed the studies; MH and XLi did literature search and review; XLin, JY and YC conducted questionnaire and person trade-off processes; XLi, QZ and YL collected and extracted the data; MH, QT and YK contributed materials; XLi, JY and YC analysed and interpreted the data; XLi and MH drafted the article and revised it. All the authors gave approval before submission.
Funding: This work was funded by the Fujian Provincial Soft Science Fund (supporting MH) (funder: Fujian Province, China; Grant No. 2017R085); Educational Research Project for Young and Middle-aged Teachers (supporting XLi) (funder: Provincial Education Department of Fujian Province, China; Grant No. JAS19008); Research Start-up Fund (supporting XLi) (funder: Fuzhou University, China; Grant No. CXRC201915).
Disclaimer: All the funders had no role in the design and conduct of the study; collection, management, analysis and interpretation of the data; or preparation, review and approval of the manuscript. The views expressed are those of the authors and not necessarily those of the funders.
Competing interests: None declared.
Provenance and peer review: Not commissioned; externally peer reviewed.
Author note: ‘Department of National Defense Education and Research, Fuzhou University’ and ‘Department of Disease Control and Prevention, No.900 Hospital of Joint Logistics Support Troop of PLA’ are co-first affiliations which contributed equally in this study.
Supplemental material: This content has been supplied by the author(s). It has not been vetted by BMJ Publishing Group Limited (BMJ) and may not have been peer-reviewed. Any opinions or recommendations discussed are solely those of the author(s) and are not endorsed by BMJ. BMJ disclaims all liability and responsibility arising from any reliance placed on the content. Where the content includes any translated material, BMJ does not warrant the accuracy and reliability of the translations (including but not limited to local regulations, clinical guidelines, terminology, drug names and drug dosages), and is not responsible for any error and/or omissions arising from translation and adaptation or otherwise.
Data availability statement
Data may be obtained from a third party and are not publicly available. The manuscript is based on medical records form PLA military temporary hospitals specialised for COVID-19 emergency in Wuhan 2020. However, there is no public data base.
Ethics statements
Patient consent for publication
Not required.
Ethics approval
The Research Ethics Committee of the No. 900 Hospital of Joint Logistics Troop of People’s Liberation Army (PLA) gave ethical approval (approval number: 2020-001). None of the inpatients were involved in any health intervention. All the individual data were anonymised prior to retrieval and analysis, and they did not contain any individual’s private information.
References
- 1.Patterson A, Clark MA. COVID-19 and power in global health. Int J Health Policy Manag 2020;9:429–31. 10.34172/ijhpm.2020.72 [DOI] [PMC free article] [PubMed] [Google Scholar]
- 2.Shangguan Z, Wang MY, Sun W. What caused the outbreak of COVID-19 in China: from the perspective of crisis management. Int J Environ Res Public Health 2020;17:3279. 10.3390/ijerph17093279 [DOI] [PMC free article] [PubMed] [Google Scholar]
- 3.WHO . Disability-adjusted life years (DALY). Available: https://www.who.int/gho/mortality_burden_disease/daly_rates/text/en/ [Accessed 30 Mar 2020].
- 4.Salomon JA. Encyclopedia of health economics. Boston: Elsevier, 2014: 200–3. [Google Scholar]
- 5.Fung TS, Liu DX. Human coronavirus: host-pathogen interaction. Annu Rev Microbiol 2019;73:529–57. 10.1146/annurev-micro-020518-115759 [DOI] [PubMed] [Google Scholar]
- 6.Chen N, Zhou M, Dong X, et al. Epidemiological and clinical characteristics of 99 cases of 2019 novel coronavirus pneumonia in Wuhan, China: a descriptive study. Lancet 2020;395:507–13. 10.1016/S0140-6736(20)30211-7 [DOI] [PMC free article] [PubMed] [Google Scholar]
- 7.Huang C, Wang Y, Li X, et al. Clinical features of patients infected with 2019 novel coronavirus in Wuhan, China. Lancet 2020;395:497–506. 10.1016/S0140-6736(20)30183-5 [DOI] [PMC free article] [PubMed] [Google Scholar]
- 8.Guan W-J, Ni Z-Y, Hu Y, et al. Clinical characteristics of coronavirus disease 2019 in China. N Engl J Med 2020;382:1708–20. 10.1056/NEJMoa2002032 [DOI] [PMC free article] [PubMed] [Google Scholar]
- 9.Wang D, Hu B, Hu C, et al. Clinical characteristics of 138 hospitalized patients with 2019 novel coronavirus-infected pneumonia in Wuhan, China. JAMA 2020;323:1061–9. 10.1001/jama.2020.1585 [DOI] [PMC free article] [PubMed] [Google Scholar]
- 10.Murray CJL, Lopez AD, Christopher JL, et al. The global burden of disease: a comprehensive assessment of mortality and disability from diseases, injuries, and risk factors in 1990 and projected to 2020. 1st edn. Geneva, Switzerland: World Health Organization, 1996. https://apps.who.int/iris/handle/10665/41864 [Google Scholar]
- 11.Chen A, Jacobsen KH, Deshmukh AA, et al. The evolution of the disability-adjusted life year (DALY). Socioecon Plann Sci 2015;49:10–15. 10.1016/j.seps.2014.12.002 [DOI] [Google Scholar]
- 12.Qi X, Jiang D, Wang H, et al. Calculating the burden of disease of avian-origin H7N9 infections in China. BMJ Open 2014;4:e004189. 10.1136/bmjopen-2013-004189 [DOI] [PMC free article] [PubMed] [Google Scholar]
- 13.Zhang L, Zhu L, ZH L. Analysis on the disease burden and its impact factors of coal worker’s pneumoconiosis inpatients. J Peking Univ Health Sci 2014;46:226–31. [PubMed] [Google Scholar]
- 14.Bacellar A, Pedreira BB, Costa G, et al. Frequency, associated features, and burden of neurological disorders in older adult inpatients in Brazil: a retrospective cross-sectional study. BMC Health Serv Res 2017;17:504. 10.1186/s12913-017-2260-x [DOI] [PMC free article] [PubMed] [Google Scholar]
- 15.Pei T, Li X, Tao F, et al. Burden of disease resulting from chronic mountain sickness among young Chinese male immigrants in Tibet. BMC Public Health 2012;12:401. 10.1186/1471-2458-12-401 [DOI] [PMC free article] [PubMed] [Google Scholar]
- 16.Jo MW, Go DS, Kim R, et al. The burden of disease due to COVID-19 in Korea using disability-adjusted life years. J Korean Med Sci 2020;35:e199. 10.3346/jkms.2020.35.e199 [DOI] [PMC free article] [PubMed] [Google Scholar]
- 17.Oh IH, Ock M, Jang SY, et al. Years of life lost attributable to COVID-19 in high-incidence countries. J Korean Med Sci 2020;35:e300. 10.3346/jkms.2020.35.e300 [DOI] [PMC free article] [PubMed] [Google Scholar]
- 18.Nurchis MC, Pascucci D, Sapienza M, et al. Impact of the burden of COVID-19 in Italy: results of disability-adjusted life years (DALYs) and productivity loss. Int J Environ Res Public Health 2020;17:4233. 10.3390/ijerph17124233 [DOI] [PMC free article] [PubMed] [Google Scholar]
- 19.Mohanty SK, Dubey M, Mishra U. Impact of COVID-19 attributable deaths on longevity, premature mortality and Daly: estimates of USA, Italy, Sweden and Germany. medRxiv 2020. [Google Scholar]
- 20.Ortiz-Prado E, Simbana-Rivera K, Diaz AM. Epidemiological, socio-demographic and clinical features of the early phase of the COVID-19 epidemic in Ecuador. medRxiv 2020. [DOI] [PMC free article] [PubMed] [Google Scholar]
- 21.Diagnosis and treatment protocol for novel coronavirus pneumonia (trial version 7) (Released by National Health Commission & National Administration of Traditional Chinese Medicine on March 3, 2020). Chin Med J 2020;133:1087–95. [DOI] [PMC free article] [PubMed] [Google Scholar]
- 22.WHO . About the global burden of disease (GBD) project. Available: https://www.who.int/healthinfo/global_burden_disease/about/en/ [Accessed 30 Mar 2020].
- 23.IHME . Global burden of disease study 2010 (GBD 2010) disability weights, 2010. Available: http://ghdx.healthdata.org/record/ihme-data/gbd-2010-disability-weights [Accessed 30 Mar 2020].
- 24.IHME . Global burden of disease study 2015 (GBD 2015) disability weights, 2015. Available: http://ghdx.healthdata.org/record/ihme-data/gbd-2015-disability-weights [Accessed Mar 2020].
- 25.IHME . Global burden of disease study 2016 (GBD 2016) disability weights, 2016. Available: http://ghdx.healthdata.org/record/ihme-data/gbd-2016-disability-weights [Accessed 30 Mar 2020].
- 26.IHME . Global burden of disease study 2017 (GBD 2017) disability weights, 2017. Available: http://ghdx.healthdata.org/record/ihme-data/gbd-2017-disability-weights [Accessed 30 Mar 2020].
- 27.Al-araibi AAM, Mahrin Mohd Naz’ri bin, Yusoff RCM. Technological aspect factors of e-learning readiness in higher education institutions: Delphi technique. Educ Inf Technol 2019;24:567–90. 10.1007/s10639-018-9780-9 [DOI] [Google Scholar]
- 28.Stouthard M, Essink-Bot M, Bonsel G. Disability weights for diseases in the Netherlands. Amsterdam: Institut Sociale Geneeskunde, 1997. [Google Scholar]
- 29.Hong K-S, Saver JL. Quantifying the value of stroke disability outcomes: WHO global burden of disease project disability weights for each level of the modified Rankin scale. Stroke 2009;40:3828–33. 10.1161/STROKEAHA.109.561365 [DOI] [PMC free article] [PubMed] [Google Scholar]
- 30.WHO . National burden of disease study: a practical guide edition 2.0, 2001. Available: https://www.who.int/healthinfo/nationalburdenofdiseasemanual.pdf [Accessed 30 Mar 2020].
- 31.Li S, Zhang X, Yan Y, et al. High cancer burden in elderly Chinese, 2005-2011. Int J Environ Res Public Health 2015;12:12196–211. 10.3390/ijerph121012196 [DOI] [PMC free article] [PubMed] [Google Scholar]
- 32.Worldometer C. 19 coronavirus pandemic. Available: https://www.worldometers.info/coronavirus/ [Accessed 23 Aug 2020].
- 33.Holshue ML, DeBolt C, Lindquist S, et al. First case of 2019 novel coronavirus in the United States. N Engl J Med 2020;382:929–36. 10.1056/NEJMoa2001191 [DOI] [PMC free article] [PubMed] [Google Scholar]
- 34.Sun P, Qie S, Liu Z, et al. Clinical characteristics of hospitalized patients with SARS-CoV-2 infection: a single arm meta-analysis. J Med Virol 2020;92:612–7. 10.1002/jmv.25735 [DOI] [PMC free article] [PubMed] [Google Scholar]
- 35.Tian S, Hu W, Niu L, et al. Pulmonary pathology of early-phase 2019 novel coronavirus (COVID-19) pneumonia in two patients with lung cancer. J Thorac Oncol 2020;15:700–4. 10.1016/j.jtho.2020.02.010 [DOI] [PMC free article] [PubMed] [Google Scholar]
- 36.Zhou P, Yang X-L, Wang X-G, et al. A pneumonia outbreak associated with a new coronavirus of probable bat origin. Nature 2020;579:270–3. 10.1038/s41586-020-2012-7 [DOI] [PMC free article] [PubMed] [Google Scholar]
- 37.Zou X, Chen K, Zou J, et al. Single-cell RNA-seq data analysis on the receptor ACE2 expression reveals the potential risk of different human organs vulnerable to 2019-nCoV infection. Front Med 2020;14:185–92. 10.1007/s11684-020-0754-0 [DOI] [PMC free article] [PubMed] [Google Scholar]
- 38.DiBona GF. The sympathetic nervous system and hypertension: recent developments. Hypertension 2004;43:147–50. 10.1161/01.HYP.0000113047.47711.fa [DOI] [PubMed] [Google Scholar]
- 39.Ysseldyk R, McQuaid RJ, McInnis OA, et al. The ties that bind: ingroup ties are linked with diminished inflammatory immune responses and fewer mental health symptoms through less rumination. PLoS One 2018;13:e0195237. 10.1371/journal.pone.0195237 [DOI] [PMC free article] [PubMed] [Google Scholar]
- 40.Audet M-C. Stress-induced disturbances along the gut microbiota-immune-brain axis and implications for mental health: does sex matter? Front Neuroendocrinol 2019;54:100772. 10.1016/j.yfrne.2019.100772 [DOI] [PubMed] [Google Scholar]
- 41.Xu L, Mao Y, Chen G. Risk factors for 2019 novel coronavirus disease (COVID-19) patients progressing to critical illness: a systematic review and meta-analysis. Aging 2020;12:12410–21. 10.18632/aging.103383 [DOI] [PMC free article] [PubMed] [Google Scholar]
- 42.Phung DT, Wang Z, Rutherford S, et al. Body mass index and risk of pneumonia: a systematic review and meta-analysis. Obes Rev 2013;14:839–57. 10.1111/obr.12055 [DOI] [PubMed] [Google Scholar]
Associated Data
This section collects any data citations, data availability statements, or supplementary materials included in this article.
Supplementary Materials
bmjopen-2021-048822supp001.pdf (114.4KB, pdf)
Data Availability Statement
Data may be obtained from a third party and are not publicly available. The manuscript is based on medical records form PLA military temporary hospitals specialised for COVID-19 emergency in Wuhan 2020. However, there is no public data base.


