Abstract
Restriction of the sulfur amino acids methionine and cysteine has recently been proposed as potential adjuvant therapy in cancer. While cysteine depletion has been associated with ferroptotic cell death, methionine depletion has not. We hypothesized that comparing the response of melanoma cell lines to depletion of the amino acids methionine and cysteine would give us insight into the critical role in cancer of these two closely related amino acids. We analyzed the response to three conditions: methionine depletion, methionine replacement with homocysteine, and cysteine depletion. In cancer cells, the transcription factor ATF4 was induced by all three tested conditions. The replacement of methionine with homocysteine produced a strong ferroptotic gene signature. We also detected an activation of the NRF2 antioxidant pathway by both methionine and cysteine depletion. Total glutathione levels were decreased by 42% in melanoma cells grown without methionine, and by 95% in cells grown without cysteine. Lipid peroxidation was increased in cells grown without cysteine, but not in cells grown without methionine. Despite the large degree of overlap in gene expression between methionine and cysteine depletion, methionine depletion and replacement of methionine with homocysteine was associated with apoptosis while cysteine depletion was associated with ferroptosis. Glutamine depletion produced comparable gene expression patterns and was associated with a 28% decrease in glutathione. Apoptosis was detected in these cells. In this experiment, a strong ATF4-driven ferroptotic gene signature was insufficient to induce ferroptosis without a concomitant profound decrease in glutathione levels.
Keywords: cell death, cysteine, glutathione, methionine
1 |. INTRODUCTION
Methionine restriction has emerged in recent years as an approach to potentiate the efficacy of a wide range of cancer therapies. Cancer cells utilize methionine and its direct precursor differently from normal cells. This phenomenon is called “methionine dependence in cancer” and is characterized by the inability of cancer cells to utilize homocysteine for growth when methionine is removed (Halpern et al., 1974). Primary cells, on the other hand, can utilize methionine and homocysteine interchangeably. Dietary methionine restriction, that is, reducing dietary methionine by 80–85% compared to a standard diet, has been repeatedly associated with an increase in lifespan in animal models (Orentreich and Zimmerman, 1993; Richie et al., 1994; Lees et al., 2014; Bárcena et al., 2018). These animals also display an improved regulation of both glucose and lipids (Malloy et al., 2006; Ables et al., 2012; Luo et al., 2019; Wang et al., 2020), and show an increase in blood levels of the antioxidant glutathione (Richie et al., 1994). While the anti-aging effect of methionine restriction is believed to involve autophagy, the molecular mechanisms behind methionine dependence in cancer are poorly understood.
Methionine is metabolically connected to the other sulfur amino acid cysteine by the transulfuration pathway. Methionine is converted to homocysteine after donating its methyl group. Homocysteine can then be remethylated to methionine by methionine synthase or betaine-homocysteine S-methyltransferase. Alternatively, homocysteine can also be converted to cysteine in the liver, kidney, and in cancer cells. The enzymes cystathionine beta-synthase and cystathionine gamma-lyase catalyze the two steps of this transulfuration reaction. Cysteine itself is a precursor for the major cellular antioxidant glutathione. Cysteine is a non-essential amino acid under steady state, but becomes essential under conditions of rapid growth such as during development and in cancer cells (reviewed in Combs and DeNicola (2019)). Cysteine depletion, as well as glutathione depletion, was recently shown to induce a form of oxidative cell death called ferroptosis (Sun et al., 2018; Badgley et al., 2020). It is characterized by the peroxidation of lipids and is a form of programmed cell death distinct from apoptosis. This association between cysteine depletion and ferroptotic cell death has brought attention to the potential use of cysteine depletion in cancer. Treatment with cysteinase was recently shown to induce ferroptotic lesions in tumors in vivo (Badgley et al., 2020). However, methionine depletion has traditionally been associated with apoptosis (Lu et al., 2002; Kokkinakis et al., 2006). This led us to ask to which extent the response to methionine and cysteine depletion overlap. Ferroptosis has been associated with a gene expression signature (Dixon et al., 2014) that largely overlaps with the integrated stress response.
Cells trigger a cascade of metabolic adaptations in response to shortages in amino acids. One major adaptation is the integrated stress response. During the integrated stress response, there is a general decrease in cap-dependent mRNA translation. At the same time, a ribosome scanning and reinitiation event allows the translation of the key transcription factor ATF4 to proceed. ATF4 can then activate the transcription of specific sets of genes. Dimerization with other transcription factors allows for a gene transcription response tailored to the particular type of stress encountered.
Depletion of the amino acid methionine has been reported to activate the integrated stress response (Rajanala et al., 2019). Breast cancer cells incubated for 6 hr in methionine-free media had a higher expression of ATF4 at the gene and protein level, as well as the downstream target SESN2. Interestingly, the authors reported that this activation was independent of the upstream kinases GCN2 and PERK. Ferroptosis induction by erastin is characterized by the induction of ATF4 and SESN2, in addition to the ATF4-interacting proteins ATF3, DDIT3 (CHOP) and TRIB3 (Dixon et al., 2014). The expression of the cysteine transporter SLC7A11 (xCT) is also induced during ferroptosis, and inhibiting the transporter reduces intracellular cysteine levels and leads to ferroptosis (Dixon et al., 2014).
We hypothesized that the mechanisms involved in the response to methionine and cysteine depletion in cancer would share similarities. To test this hypothesis, we systematically compared methionine depletion, methionine replacement with homocysteine (classical methionine dependence), and cysteine depletion in vitro.
2 |. MATERIALS AND METHODS
2.1 |. Cell culture
A101D, CCL-75, B16F10, and MeWo cells (described in Section 3) were obtained from ATCC. Cells were maintained in standard DMEM with l-glutamine, 4.5 g/L glucose and sodium pyruvate (Corning, Corning NY) supplemented with 10% FBS (Corning) and 100 IU penicillin and streptomycin (ThermoFisher, Waltham MA). Methionine-, cysteine-, and glutamine-free media were prepared from high glucose, no glutamine, no methionine, no cystine DMEM (ThermoFisher Scientific) supplemented with 10% dialyzed serum (BioTechne, Minneapolis, MN), 100 IU penicillin and streptomycin (ThermoFisher), and 1 mM sodium pyruvate (ThermoFisher). Dialyzed serum is devoid of proteins that would otherwise contribute amino acids to the growth medium. For control medium, l-methionine (Millipore-Sigma, Burlington, MA) was resuspended in PBS and added to the cell media at a final concentration of 200 μM, l-cystine (Millipore-Sigma) was resuspended in PBS with NaOH added until complete solubilization and added to the cell media at a final concentration of 150 μM, and l-glutamine added at a final concentration of 4 mM (ThermoFisher). For methionine-free, homocysteine containing media, l-homocysteine (Chem-impex, Wood Dale, IL) was resuspended in PBS with NaOH added until complete solubilization and added to the cell media at a final concentration of 200 μM.
2.2 |. Cell viability/proliferation assay
To assess cell viability/proliferation, we used the Hoechst and resazurin assays. The Hoechst dye fluorescently labels DNA and provides an estimate for cell number. We plated cells at a density of 10,000 cells per well in a 96-well format in standard DMEM media. After the cells were attached (4–5 hr), we changed the media as described above. After 72 hr, we added Hoechst 33342 (ThermoFisher) at a final concentration of 4 μM. After 30 min incubation in a cell culture incubator, cells were washed three times with 100 μl PBS and fluorescence was measured on a Cytation instrument (BioTek, Winooski VT) with an excitation wavelength of 350 nm and an emission wavelength of 461 nm. We subtracted background fluorescence from a well that did not contain cells but was otherwise treated identically. For the rescue assay, the reduced form of ethyl ester glutathione (Millipore-Sigma) was added at a final concentration of 5 mM, ferrostatin (Millipore-Sigma), an inhibitor of ferroptosis, was added at a final concentration of 500 nM and Z-VAD-FMK (ThermoFisher), a pan-caspase inhibitor that prevents apoptosis, was added at a final concentration of 50 μM. The resazurin assay is a derivative of the MTT assay. It relies on the reduction of the non-fluorescent resazurin by dehydrogenase enzymes in the cytoplasm and mitochondria to form the red fluorescent dye resorufin. We first dissolved resazurin in DMSO (200X) then diluted this original stock in PBS (20X) and added it to the cells at a final concentration of 44 μM. Cells were incubated for 3–4 hr then fluorescence was measured with an excitation wavelength of 570 nm and an emission wavelength of 590 nm. We subtracted background fluorescence from a well that did not contain cells but was otherwise treated identically.
2.3 |. Gene expression analysis
To measure gene expression, we plated A101D, B16F10, and CCL-75 cells in a six-well format at 750,000 cells per well in standard DMEM media and let the cells attach overnight. The next day, we changed the cell culture media for treatment media as described above. We incubated the cells 24 hr before harvesting the cells. RNA was extracted using the RNeasy kit (QIAGEN, Germantown, MD) following the manufacturer’s instruction. RNA quality and quantity was assessed by spectrophotometry (Nanodrop, ThermoFisher Scientific). Reverse transcription was performed on 1 μg of purified RNA using the iScript Reverse Transcription Supermix (Bio-Rad, Hercules, CA). For each quantitative real-time PCR reaction, 20 ng of cDNA was used and amplified with the iTaq Universal SYBR Green Supermix (Bio-Rad). Primers are listed in Supplementary Table 1 (Integrated DNA Technologies, Coralville, IA).
2.4 |. RNA-Seq
RNA was extracted as described above. After Qubit fluometric quantification (ThermoFisher), the NGS library was prepared with the Truseq Stranded Total RNA (Illumina, San Diego, CA) and ran on a HiSeq300 instrument at the Genomics Core of the University of Arkansas for Medical Sciences. Data analysis was performed at the Bioinformatics Core. Briefly, the RNA reads were checked for quality of sequencing using FastQC. RNA reads were trimmed using Trimmomatic using the following parameters: LEADING:3 TRAILING:3 SLIDINGWINDOW:4:28 MINLEN:36. Reads that pass quality control were aligned to the reference genome (hg38.p19 Acc:GCA_000001405.28) with Ensembl GRch38 release 99 annotations using the STAR sequence aligner. The RNA counts were extracted using featureCounts (Liao et al., 2014) and filtered (counts per million <10 or <20 across all samples) normalized using trimmed mean of M-values (TMM) using functions with EdgeR (Robinson et al., 2010; McCarthy et al., 2012). Read TMM were then prepared to fit linear models using voomWithQualityWeight (Law et al., 2014) and differential expression analysis was performed using limma (Ritchie et al., 2015). Genes with an FDR p-value <.05 and a fold change >2 were considered significant.
2.5 |. Immunoblotting
For protein analysis, we plated A101D in 10 cm dishes at 2 million cells per dish in standard DMEM media and let the cells attach overnight. The next day, we changed the cell culture media for treatment media as described above. We incubated the cells 24 hr before harvesting the cells. We harvested the cells with trypsin and separated nuclear and cytoplasmic proteins using the EpiQuik Nuclear Extraction kit as recommended by the manufacturer (Epigentek, Farmingdale, NY). The resulting cytoplasmic and nuclear extract were quantified by BCA and ran on bis-Tris gels (ThermoFisher Scientific). Proteins were transferred onto a low fluorescence PVDF membrane (Bio-Rad). Membranes were blocked for 1 hr in 1% casein TBST. Primary antibodies were: ATF4 (#11815), the cytoplasmic control β-actin (#3700), Cell Signaling, Danvers, MA) and CHAC1 (#15207–1-AP, Proteintech, Rosemont, IL). Fluorescent secondary antibodies (12,004,159 and STAR36D800GA, Bio-Rad) were used for detection on a ChemiDoc instrument (Bio-Rad). Nuclear extract loading control was done by staining with amido black. Images were processed with the Image Lab 6.0.1 software (Bio-Rad).
2.6 |. siRNA gene expression knockdown
In order to ascertain the role of ATF4 and NRF2 in the regulation of downstream targets, we downregulated mRNA levels with siRNAs. siRNAs targeting ATF4, NRF2, and a scrambled control (Silencer Select s1704, s9493, and AM4611, respectively, ThermoFisher Scientific) were used at a final concentration of 60 nM for a reverse transfection in 24-well format in triplicates. siRNA were mixed with lipofectamine RNAiMAX Transfection Reagent and Opti-MEM I reduced serum medium (ThermoFisher Scientific) and added to the wells, then 30,000 cells per well was added to the mixture in media devoid of antibiotics. After 24 hr, the media was changed for test media devoid of antibiotics. After 24 hr, RNA was extracted using the Qiazol reagent (Qiagen) according to the manufacturer’s instructions. Gene expression analysis was performed as described above.
2.7 |. Total glutathione assay
To assess the concentration of total (GSH + GSSG) glutathione intracellularly, we plated 30,000 cells per well in a 96-well format and let the cells attach overnight. The next day, we changed the media for treatment media as described above. After 24 hr, we assayed total glutathione using the GSH-Glo glutathione assay (Promega, Madison, WI) following the manufacturer’s instructions.
2.8 |. Lipid peroxidation
Cells were plated at a density of 1 million cells per well in a six-well format and treated as before for 48 h. A positive control well was treated with H2O2 for 2 hr. Cells were harvested, washed, and incubated in 10 μg/ml BODIPY 581/591 (ThermoFisher Scientific) for 15 min at room temperature in the dark. Cells were again washed and fluorescence measured by flow cytometry on an LSRFortessa instrument (Becton, Dickinson and Company, Franklin Lakes, NJ) and analyzed with the FlowJo software (FlowJo, Ashland, OR). Lipid peroxidation was expressed as the ratio of the fluorescence in the Texas Red channel (oxidized) to the FITC channel (reduced).
2.9 |. Apoptosis assay
Cells were plated at a density of 1 million cells per well in a six-well format and treated as before for 24 hr. Cells were harvested, washed, and incubated in 0.9 μg/ml FITC Annexin V (Biolegend, San Diego, CA) in Annexin V binding buffer (140 mM NaCl, 10 mM HEPES pH 7.4, 2.5 mM CaCl2) for 20 min at room temperature in the dark. DAPI was added at a final concentration of 0.5 μM. Fluorescence was measured by flow cytometry on an LSRFortessa instrument (Becton, Dickinson and Company) and the output was analyzed using the FlowJo software (FlowJo).
2.10 |. Data analysis
The software GraphPad Prism 8.3.0 (GraphPad Software, San Diego, CA) was used to represent the data graphically and perform statistical analysis. For the RNA expression, we show the mean ± SD of four replicates for each condition in each cell line. For 96-well format assay, we show the mean ± SD of eight wells, or seven wells for conditions where one well was used to subtract background. Comparisons were made using ANOVA with Dunnett’s multiple comparison test against the control condition.
3 |. RESULTS
3.1 |. Methionine and cysteine depletion decrease cell proliferation in cancer cells
We first sought to compare the effect of methionine and cysteine depletion on cell proliferation and viability. We used two different assays to do so. The Hoechst dye stains DNA, and reflects the amount of DNA present in the wells. The resazurin assays measures the reduction of resazurin to the fluorescent compound resorufin in the cytoplasm and mitochondria of live cells. We compared four cell lines. A101D is a methionine-dependent human melanoma cell line. B16F10 is a methionine-dependent murine melanoma cell line. CCL-75 is a methionine-independent primary human lung fibroblast cell line. Finally, MeWo is a classic methionine-independent melanoma cell line (i.e., can grow in either methionine or homocysteine; Loewy et al., 2009). Both the human A101D and the murine B16F10 melanoma cell line showed a decrease in proliferation/viability in methionine-depleted media, in methionine-depleted media supplemented with homocysteine, and in cysteine-depleted media after 72 hr (Figure 1a,b). As expected, the methionine-independent CCL-75 and MeWo showed a more modest decrease in proliferation/viability in methionine-depleted media. This decrease was completely rescued by homocysteine in primary CCL-75 cells upon both methods of measurement. There was also a complete rescue in MeWo as measured by Hoechst (Figure 1a), but not by resazurin (Figure 1b). The decrease in proliferation following cysteine depletion in CCL-75 and MeWo was comparable to A101D and B16F10. We chose the human cell lines A101D (melanoma) and CCL-75 (primary) to investigate the effect of methionine and cysteine depletion on gene expression.
FIGURE 1.
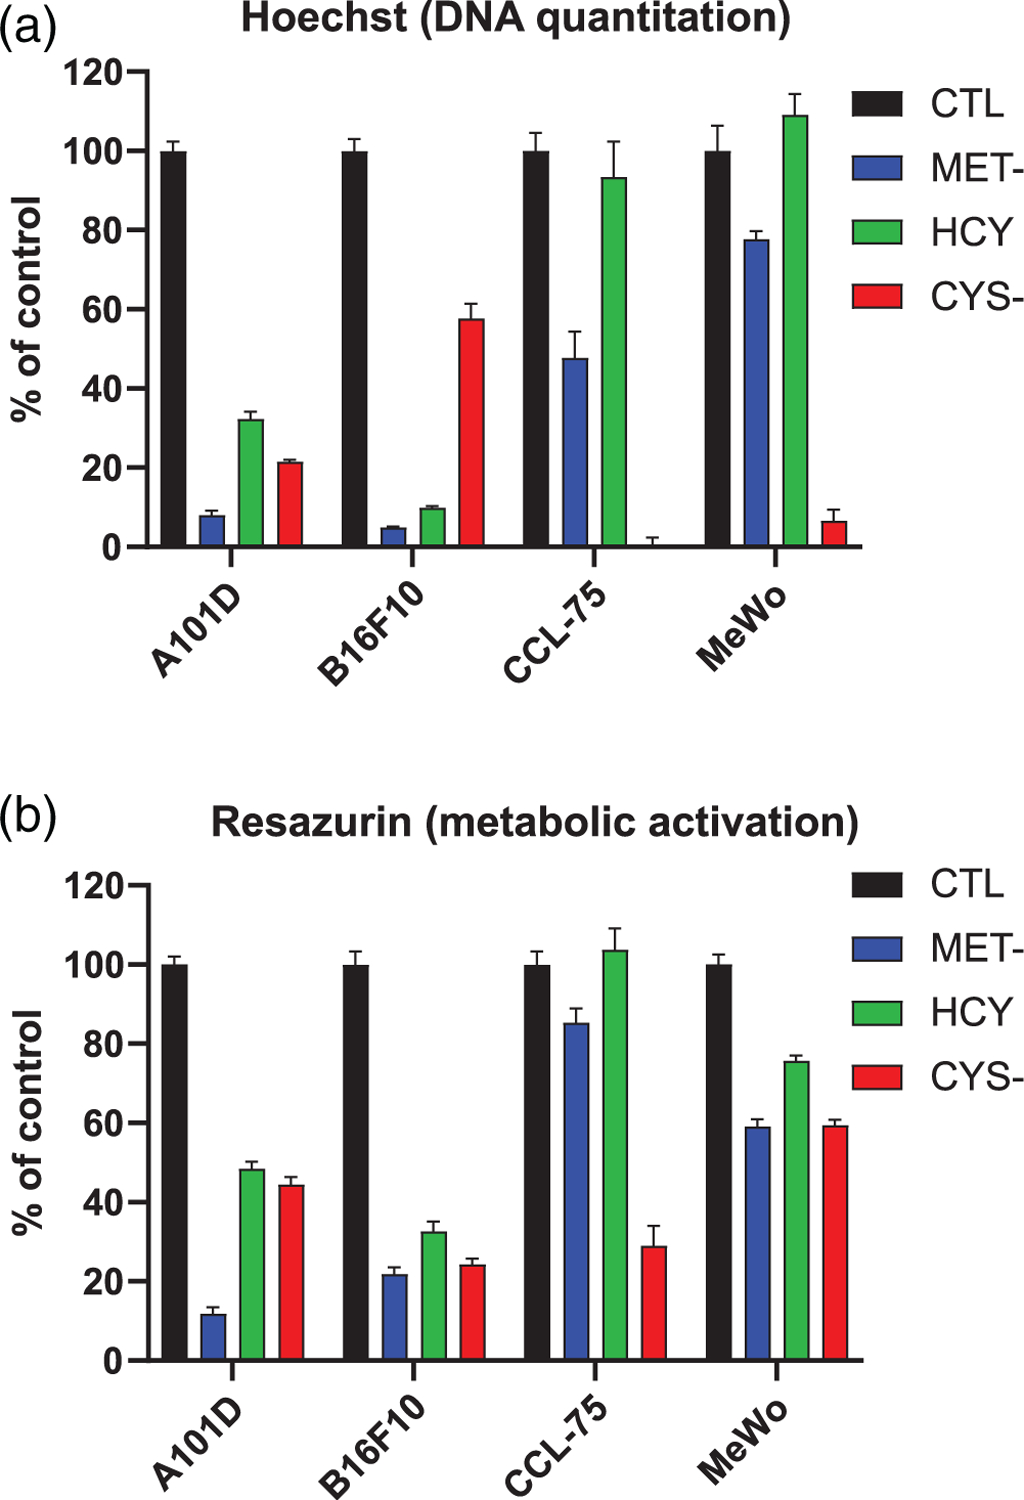
Proliferation and viability in methionine- and cysteine-depleted cells at 72 hr. (a) Proliferation assessed by Hoechst staining for DNA, expressed as fluorescence relative to control treated cells. (b) Proliferation/viability assessed by fluorescent detection of the resorufin metabolite of resazurin. CTL, control media; CYS-, cysteine-free media; HCY, methionine-free, homocysteine-supplemented media; MET-, methionine-free media
3.2 |. Methionine and cysteine depletion activate the ATF4 transcription factor
Previous research suggested that both methionine and cysteine depletion activate the transcription factor ATF4 and its downstream target SESN2 in breast cancer cells (Rajanala et al., 2019). We found that methionine depletion, with or without homocysteine supplementation, increases gene expression by about three-fold for ATF4, with a similar effect size for cysteine depletion (2.5-fold) in the A101D human melanoma cell line after 24 hr (Figure 2a). In normal human fibroblasts, ATF4 induction was similar for cysteine depletion (2.5-fold, Figure 2b). ATF4 was still significantly upregulated after methionine depletion, but the effect size was about half of that identified in melanoma cells (1.5-fold). In normal CCL-75 cells, homocysteine supplementation completely prevented the induction of ATF4 expression. These results were largely confirmed in the downstream target SESN2, with SESN2 being similarly elevated after cysteine (ninefold) or methionine depletion (sevenfold) in melanoma cells (Figure 2c). SESN2 induction was modest in normal human fibroblasts, with a two-fold and three-fold induction after methionine and cysteine depletion, respectively (Figure 2d). As for ATF4, homocysteine supplementation prevented the induction of SESN2.
FIGURE 2.
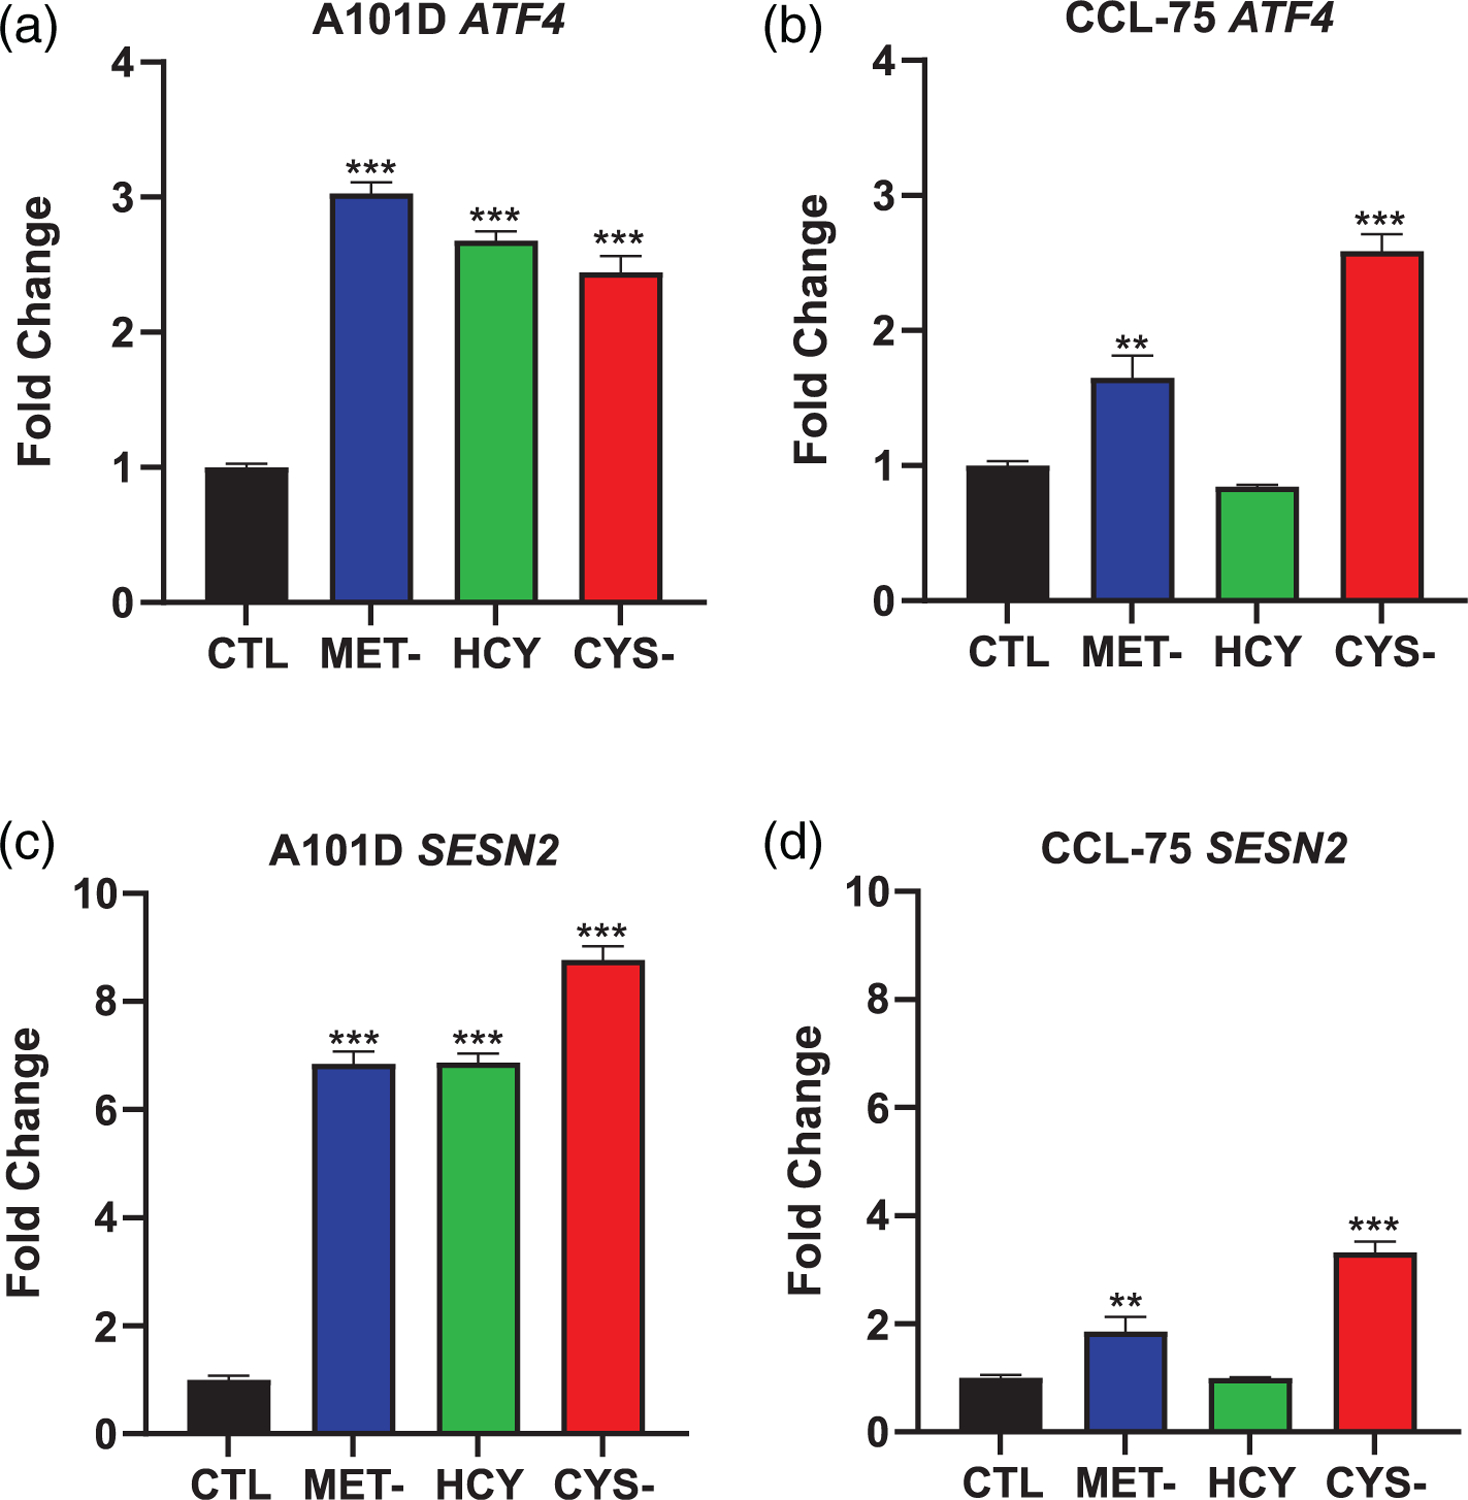
Activation of the ATF4 integrated stress response at 24 h. Gene expression of ATF4 (a and b) and its downstream target SESN2 (c and d) in A101D human melanoma cells (a and c) and CCL-75 human normal fibroblasts (b and d). CTL, control media; CYS-, cysteine-free media; HCY, methionine-free, homocysteine-supplemented media; MET-, Methionine-free media
3.3 |. Replacement of methionine with homocysteine leads to a ferroptotic gene signature
ATF4 and many of its downstream targets are included in a gene signature for ferroptotic cell death. To test the hypothesis that cell death in methionine dependence is caused by ferroptosis, we assessed gene expression in melanoma cells grown in media containing either methionine or homocysteine for 24 hr. We obtained a strong gene signature for ferroptosis associated with growth in homocysteine (Table 1). The median gene expression change was 2.5-fold, the same value reported for the ferroptotic inducer erastin (Dixon et al., 2014). Based on this finding, we investigated further the association between methionine depletion, ATF4 signaling, oxidative stress, and ferroptosis.
TABLE 1.
Ferroptotic gene signature.
| Fold change | |
|---|---|
| CHAC1 | 11.60 |
| DDIT4 | 3.53 |
| LOC284561 | nd |
| ASNS | 4.44 |
| TSC22D3 | 2.35 |
| DDIT3 | 3.15 |
| JDP2 | 3.46 |
| SESN2 | 3.48 |
| SLC1A4 | 1.57 |
| PCK2 | 1.74 |
| SLC7A11 | 5.98 |
| TXNIP | 2.27 |
| VLDLR | 1.62 |
| GPT2 | 3.87 |
| PSAT1 | 3.29 |
| C9ORF150 (LURAP1L) | 4.81 |
| SLC7A5 | 2.04 |
| HERPUD1 | 1.38 |
| XBP1 | 0.95 |
| ATF3 | 2.20 |
| SLC3A2 | 2.25 |
| CBS | 2.43 |
| ATF4 | 2.55 |
| ZNF419 | 2.45 |
| KLHL24 | 1.17 |
| TRIB3 | 5.50 |
| ZNF643 (ZFP69B) | 1.45 |
| ATP6V1G2 | 2.28 |
| VEGFA | 3.21 |
| GDF15 | 5.79 |
| TUBE1 | 3.05 |
| ARRDC3 | 1.02 |
| CEBPG | 6.66 |
| Median | 2.50 |
Note: The color intensity reflects the magnitude of the fold change.
3.4 |. Similar patterns of gene expression after methionine and cysteine depletion
Based on these initial findings, we investigated further into the ATF4 pathway in A101D human melanoma cells. First, we assessed the counterbalancing effect of TRIB3 on ATF4 expression. TRIB3 is a pseudokinase regulated by ATF4 but that also exerts a negative feedback on ATF4 expression itself. TRIB3 was equally induced by methionine and cysteine depletion (Figure 3a). This indicated that this variable is relatively constant between both conditions. The lifespan-increasing effect of methionine restriction and combined methionine and cysteine depletion in vivo is thought to be mediated by the growth factor FGF21. However, the effect of cysteine depletion alone on FGF21 expression is not well described. We found a very large increase in the gene expression of FGF21 by both methionine (300-fold) and cysteine (400-fold) depletion (Figure 3b). The addition of homocysteine to methionine-depleted cells did not blunt the response, but rather doubled the amplitude of the FGF21 gene induction. Previous groups reported an increase in the cysteine transporter SLC7A11 in cysteine depleted cells (Badgley et al., 2020). SLC7A11 was indeed increased in cysteine depleted cells, as well as in methionine depleted cells (Figure 3c). The methionine transporter SLC7A5 (LAT1) was not induced in our test conditions (Figure 3d). SLC7A11 can be activated both by ATF4 and NRF2, as is FGF21. The main role of the transcription factor NRF2 is to orchestrate the response to oxidative stress, and it is itself a target of ATF4 (Wang et al., 2015). The expression of NFE2L2, the gene encoding the transcription factor NRF2, was slightly increased in methionine depleted and cysteine depleted cells (Figure 3e). Two of its downstream targets are heme oxygenase 1, involved in heme degradation, and the glutathione synthesizing enzyme glutamate-cysteine ligase. HMOX1 was upregulated under methionine- and cysteine-deficient conditions (Figure 3f), indicating that the NRF2-driven antioxidant response appears to be activated. GCLM, the regulatory subunit of glutamate-cysteine ligase, was elevated only after cysteine depletion (Figure 3g). Another glutathione-related gene, CHAC1, was previously shown to be induced under cysteine depletion (Dixon et al., 2014). CHAC1 degrades glutathione into 5-oxo-l-proline, glycine, and cysteine. We found that CHAC1 was indeed increased about 10-fold in cysteine depletion, and was also increased in methionine depletion (Figure 3h). The largest increase was seen in methionine-depleted, homocysteine-supplemented cells (18-fold). Overall, the patterns of gene expression between methionine and cysteine depletion were remarkably similar, with the notable exception of GCLM. With effects on both glutathione synthesis and degradation, we investigated next the response of cellular glutathione to methionine and cysteine depletion.
FIGURE 3.
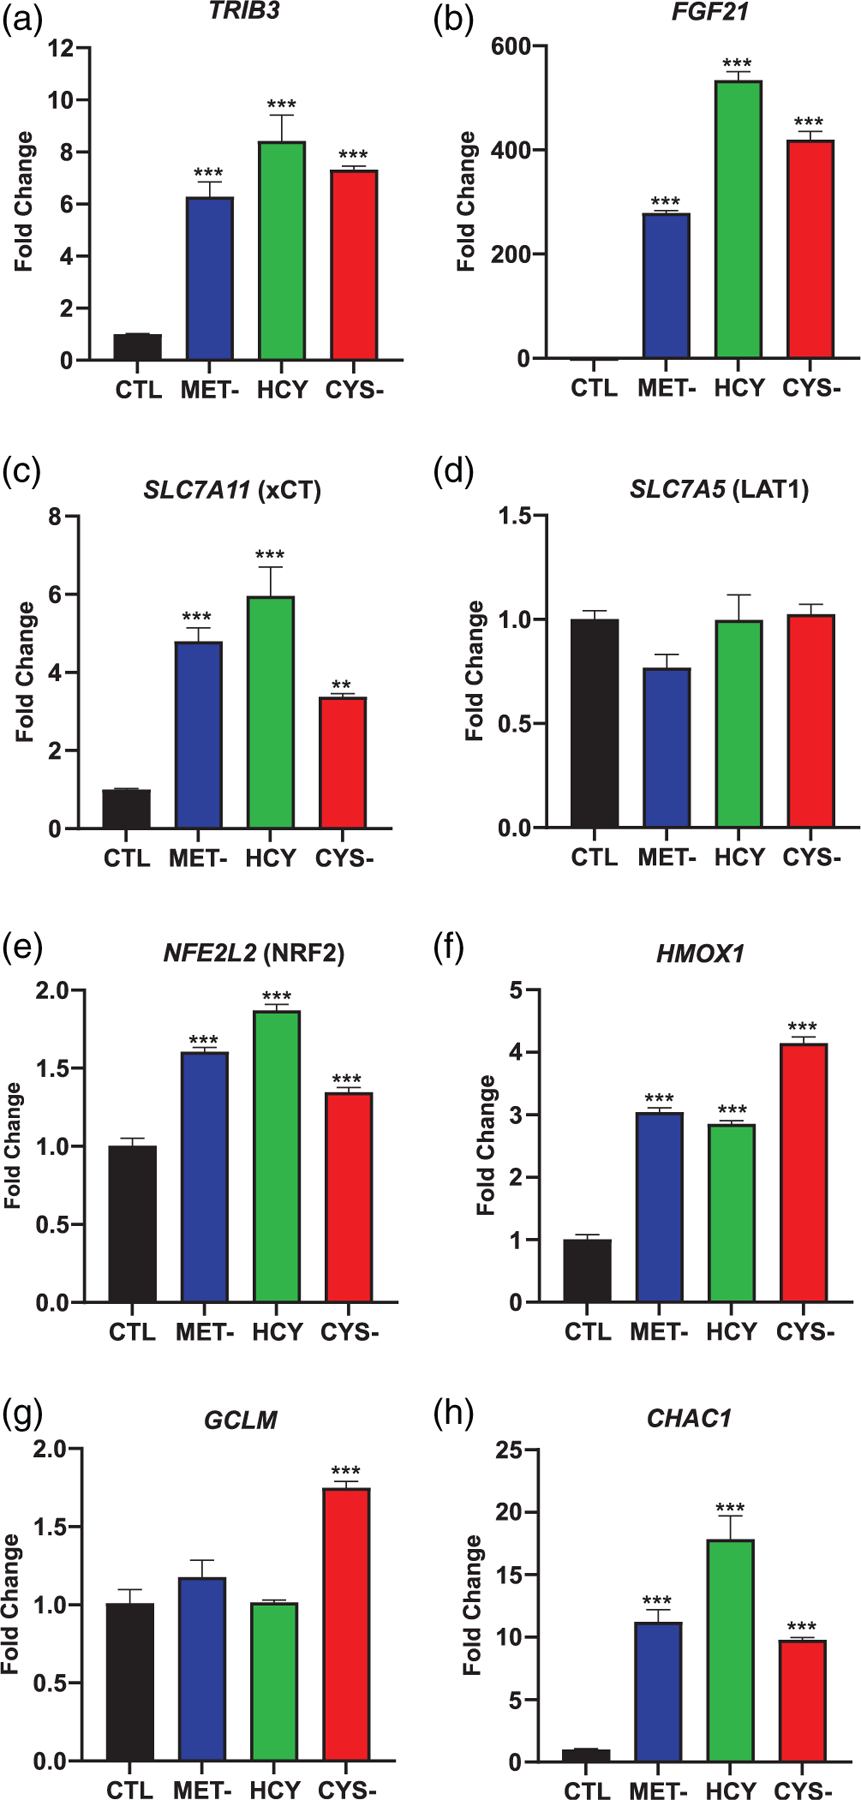
Gene expression patterns in A101D human melanoma cells. Expression at 24 h for genes (a) TRIB3, (b) FGF21, (c) SLC7A11, (d) SLC7A5, (e) NFE2L2, (f) HMOX1, (g) GCLM, and (h) CHAC1. CTL, control media; CYS-, cysteine-free media; HCY, methionine-free, homocysteine-supplemented media; MET-, methionine-free media
3.5 |. Confirmation of ATF4 transcriptional activity
To confirm the data observed at the gene expression level, we assessed the abundance of ATF4 protein in the nucleus of human melanoma cells. The abundance of ATF4 was increased after 24 hr of cysteine depletion, and to a lesser extent, after replacement of methionine with homocysteine. However, we could not confirm an increase of ATF4 protein in the nucleus of methionine-deprived cells at the time point measured (Figure 4a). CHAC1 expression is controlled by ATF4 and was increased in the cytoplasm by the three test conditions. We knocked down the expression of ATF4 and NRF2 using small interfering RNAs (siRNA). Both siRNAs showed the ability to reduce its respective gene expression (Figure 4b,c). Knocking down ATF4 blunted the induction of SESN2, FGF21, and CHAC1, with little to no contribution from NRF2 (Figure 4d–f). This confirmed the role of ATF4 in triggering the integrated stress response in response to methionine and cysteine depletion.
FIGURE 4.
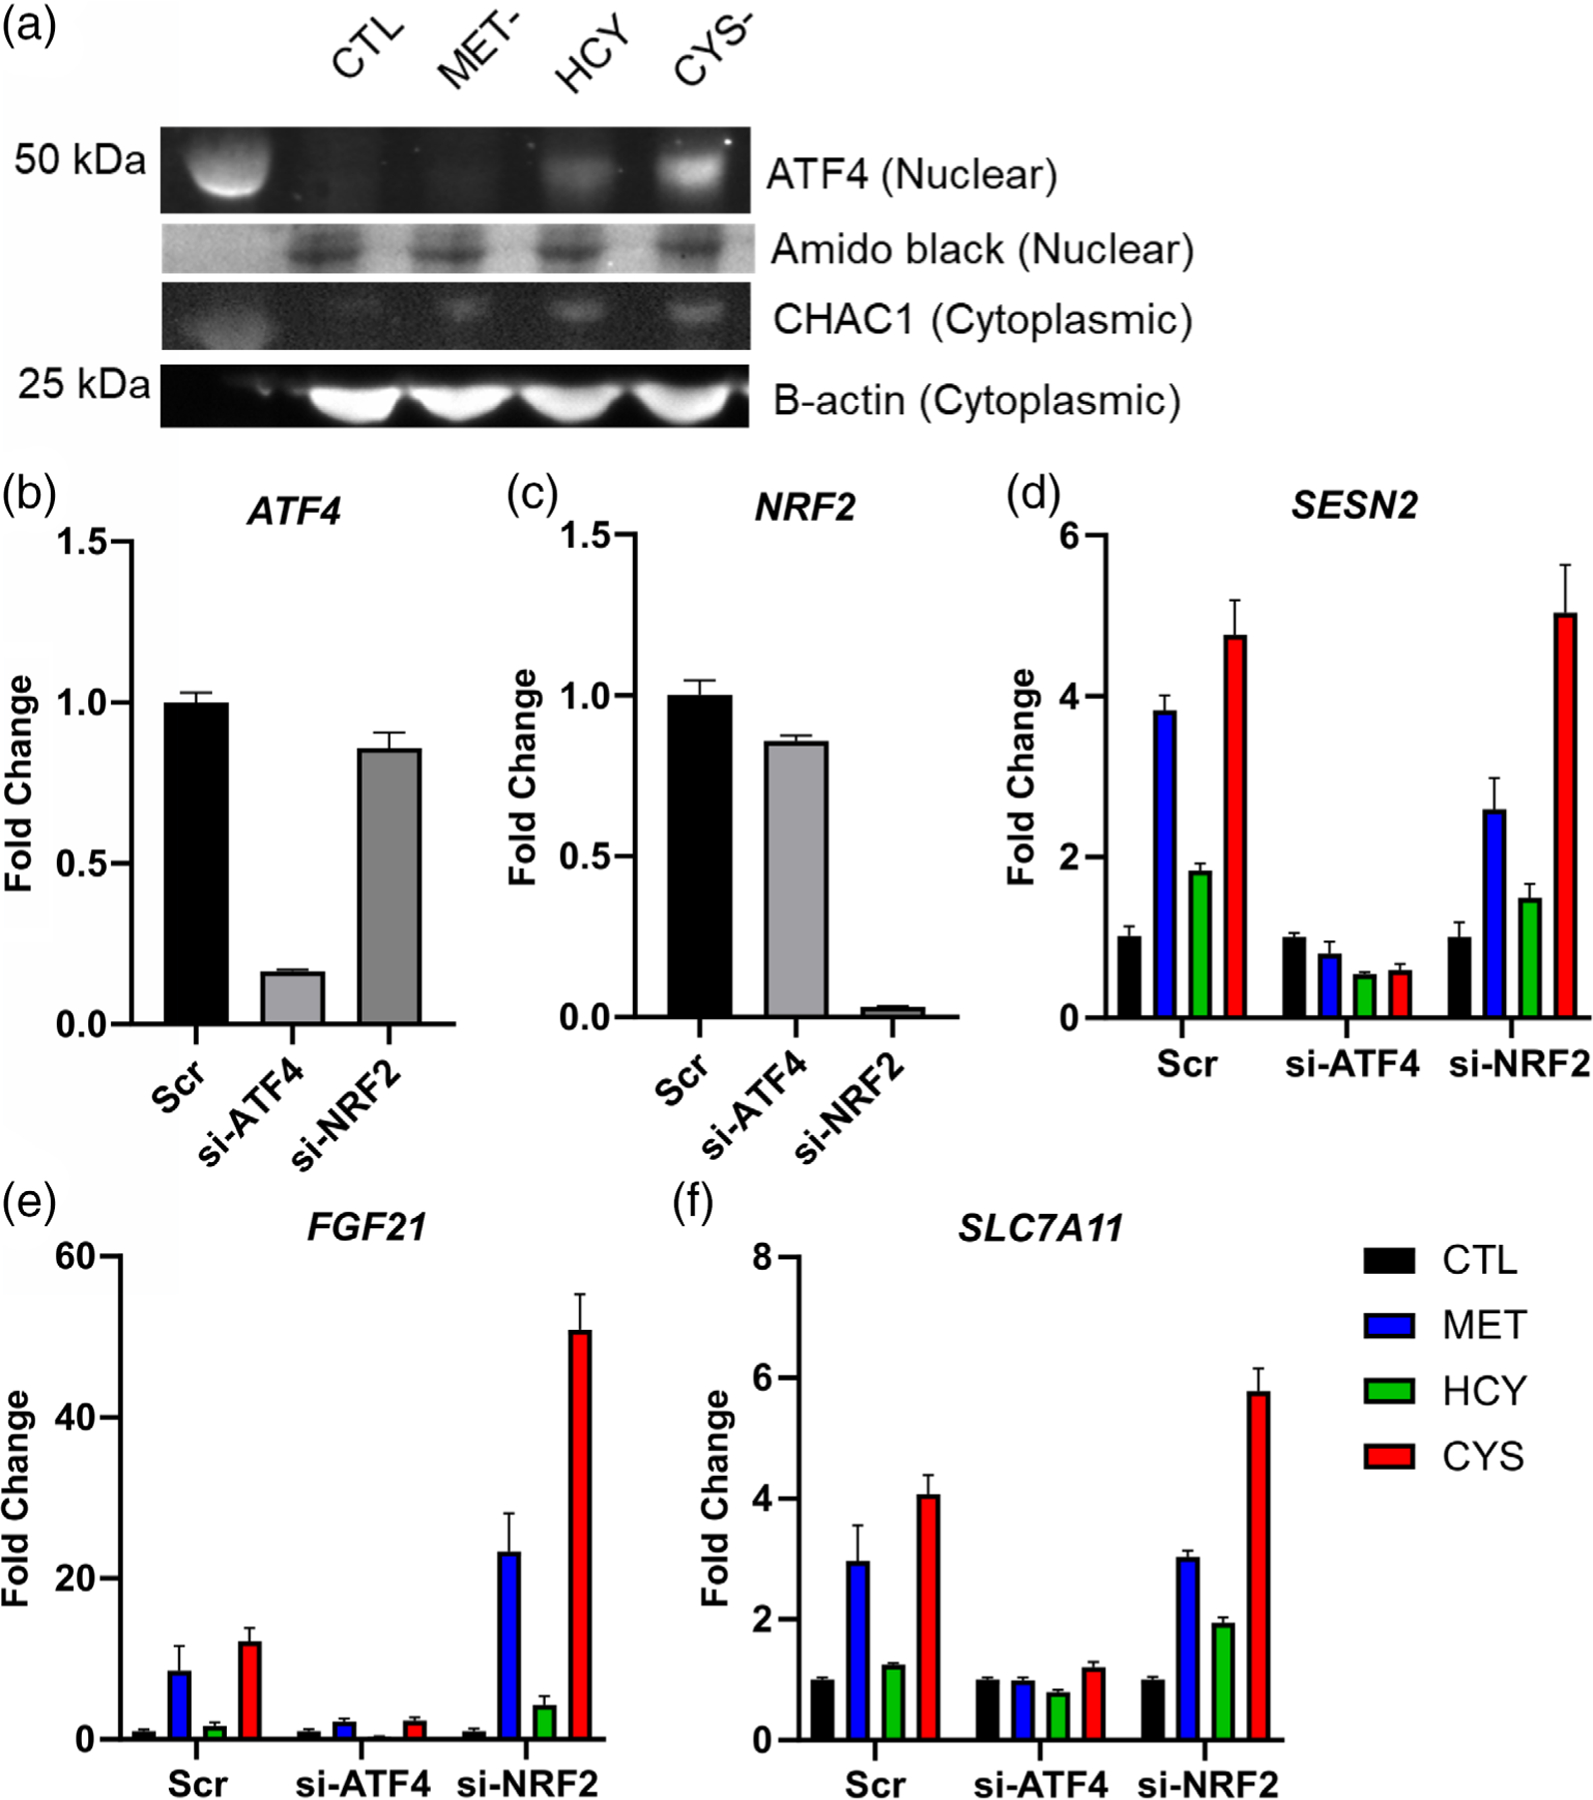
Confirmation analysis. Western blot analysis of the protein ATF4 in a nuclear extract of the cell line A101D, with amido black staining of the same membrane for reference, as well as CHAC1 in the cytoplasm compared with the loading control β-Actin (a). siRNA knockdown of ATF4 (si-ATF4) and NRF2 (si-NRF2) followed by gene expression analysis. CTL, control media; CYS-, cysteine-free media; HCY, methionine-free, homocysteine-supplemented media; MET-, methionine-free media
3.6 |. Different effect sizes and outcomes on glutathione and cell death
As suggested previously (Badgley et al., 2020), we measured a large decrease in total (reduced and oxidized) glutathione in cysteine-depleted cells (20-fold; Figure 5a). As predicted by the gene expression pattern, we also measured a decrease in glutathione after methionine depletion. However, glutathione was decreased by only half, with or without homocysteine supplementation (Figure 5a). We used a cell-permeable glutathione ethyl ester to rescue cell proliferation. There was indeed a doubling of the amount of DNA detected in the well in cysteine-depleted, glutathione-supplemented cells after 72 hr (Figure 5b). There was also a significant but more modest 1.3-fold increase in proliferation in methionine-depleted cells. In cysteine-depleted cells, the decrease in glutathione was previously associated with an increase in lipid peroxidation and ferroptotic cell death (Badgley et al., 2020). Our results confirm an increase in lipid peroxides in the form of a shift in the fluorescence of the reporter dye BODIPY (Figure 5c). We also observed partial rescue of cell proliferation by ferrostatin (Figure 5d). Methionine depletion, on the other hand, did not increase lipid peroxidation at the time point analyzed. We measured a small but significant increase in methionine-depleted, homocysteine-supplemented cells. Ferrostatin also failed to rescue proliferation in methionine-depleted cells (Figure 5d).
FIGURE 5.
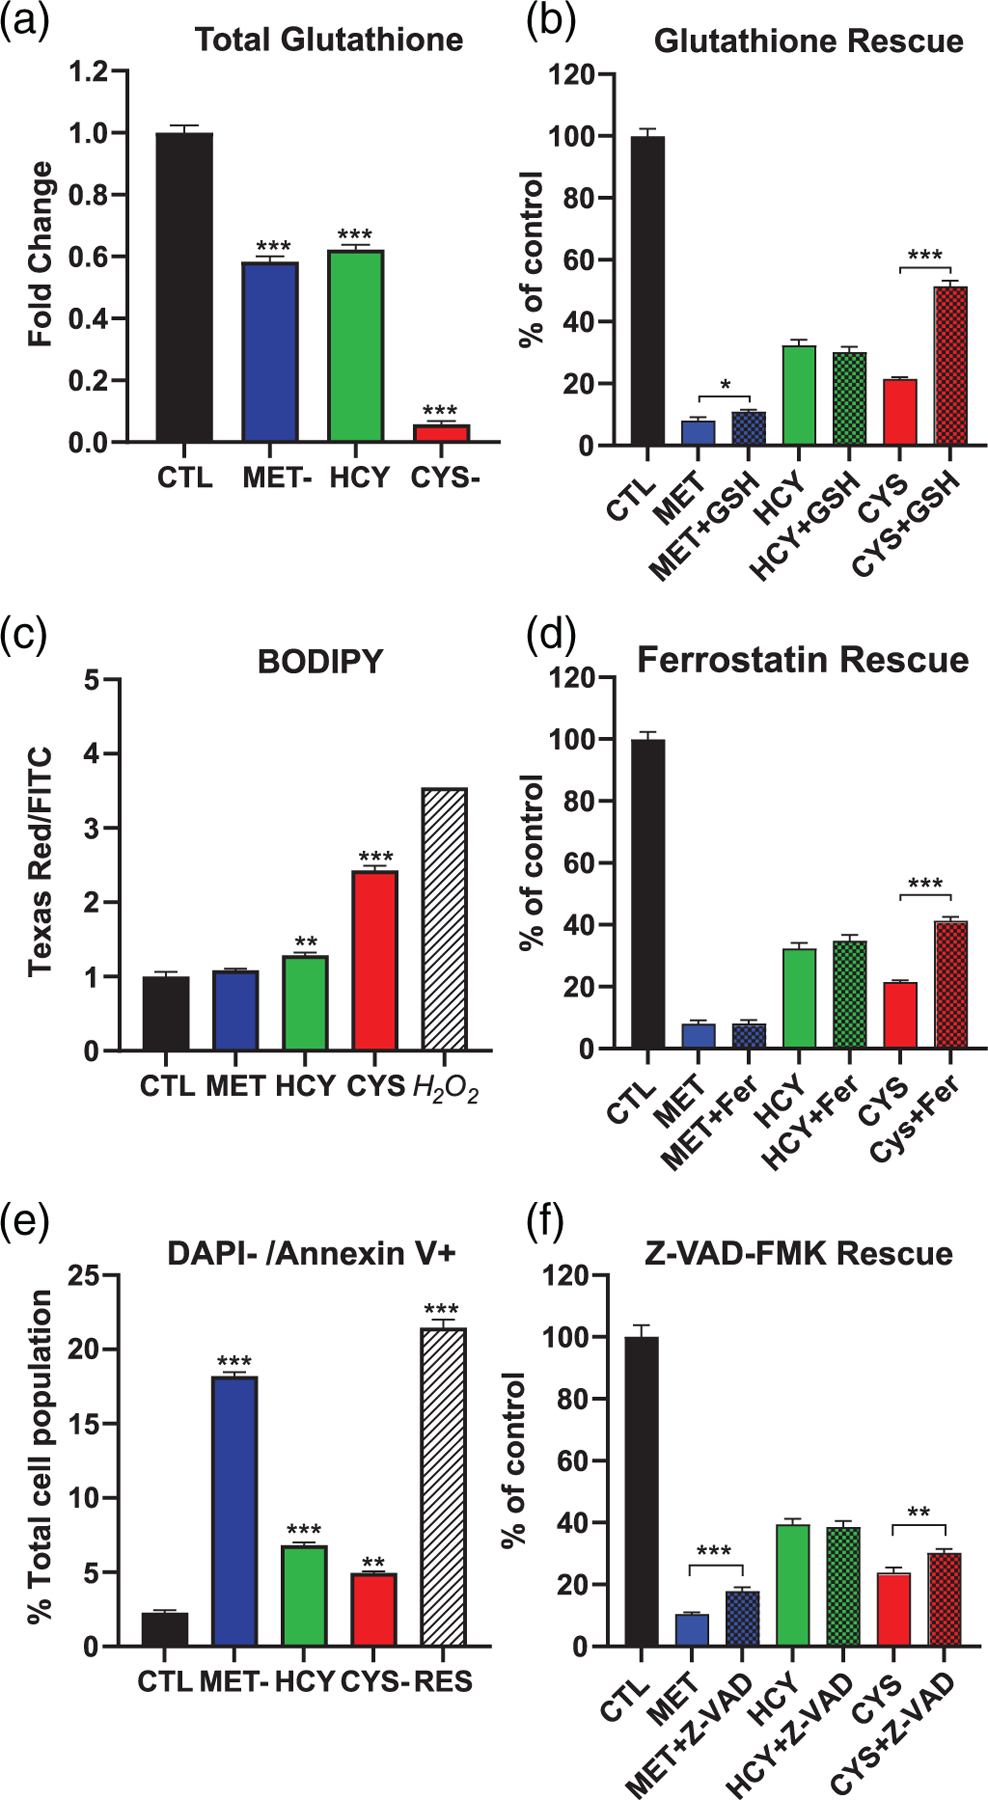
Glutathione and cell death in A101D human melanoma cells. (a) Total glutathione (GSH + GSSG). (b) Rescue of cell proliferation (Hoechst assay) by reduced ethyl ester glutathione (GSH). (c) Flow cytometry quantification of oxidized to reduced BODIPY. (d) Rescue of cell proliferation (Hoechst assay) by ferrostatin (Fer). (e) Flow cytometry quantification of Annexin V-positive cells. (f) Rescue of cell proliferation (Hoechst assay) by the caspase inhibitor Z-VAD-FMK (Z-VADCTL, control media; CYS-, cysteine-free media; HCY, methionine-free, homocysteine-supplemented media; MET-, methionine-free media
To investigate alternative mechanisms of cell death, we measured Annexin V staining as a marker of apoptosis. After 24 hr, 18% of methionine-depleted cells stained positive for Annexin V while staining negative for DAPI (live apoptotic cells).This was comparable to our positive control; 50 μM resveratrol. (Figure 5e). This percentage decreased to 7% in homocysteine-supplemented cells, in line with the moderate rescue offered by homocysteine (Figure 1). Only 5% of cells showed indication of apoptosis in cysteine-depleted cells. Inhibition of caspases with Z-VAD-FMK offered some rescue of methionine-depleted cells after 72 hr (10.4% of control to 17.8% of control; Figure 5f). We did not measure any significant rescue of homocysteine-supplemented cells, and a smaller but significant rescue of cysteine-depleted cells (23.4% of control to 30.2% of control).
3.7 |. Normal cells are resilient to methionine depletion
The results from the proliferation/viability assay indicated that normal CCL-75 cells are generally resilient to methionine depletion, despite an equivalent activation of the ATF4 transcription factor. We found that the negative regulator of ATF4 TRIB3 was elevated 8.7-fold in methionine-depleted cells, compared to only 4.5-fold on cysteine-depleted cells (Figure 6a). The expression of NFE2L2, the gene encoding the transcription factor NRF2, was not changed in CCL-75 cells in any of our tested conditions (data not shown). However, the expression of the downstream gene HMOX1 was elevated nearly 80-fold in cysteine-depleted cells (Figure 6b), much beyond the fourfold observed in A101D melanoma cells. FGF21 was expressed at low levels and was not reliably detected in any of the test conditions (data not shown). CHAC1 was elevated in both cysteine and methionine depleted cells (Figure 6c). Finally, total glutathione levels were decreased 90% in cysteine-depleted cells (Figure 6d). Interestingly, we measured a small but significant increase in total glutathione in CCL-75 cells cultured under methionine-depleted conditions. In these cells, providing additional glutathione did not increase the amount of Hoechst DNA staining after either methionine or cysteine depletion (Figure 6e). However, ferrostatin provided a robust (86%) rescue after cysteine depletion, strong evidence for the involvement of ferroptosis in cell death. As in melanoma cells, there was also a modest rescue following caspase inhibition. Cysteine depletion also induced a small but significant increase in the percentage of live cells positive for Annexin V after 24 hr. This indicates a combination of ferroptosis and apoptosis after cysteine depletion in normal cells.
FIGURE 6.
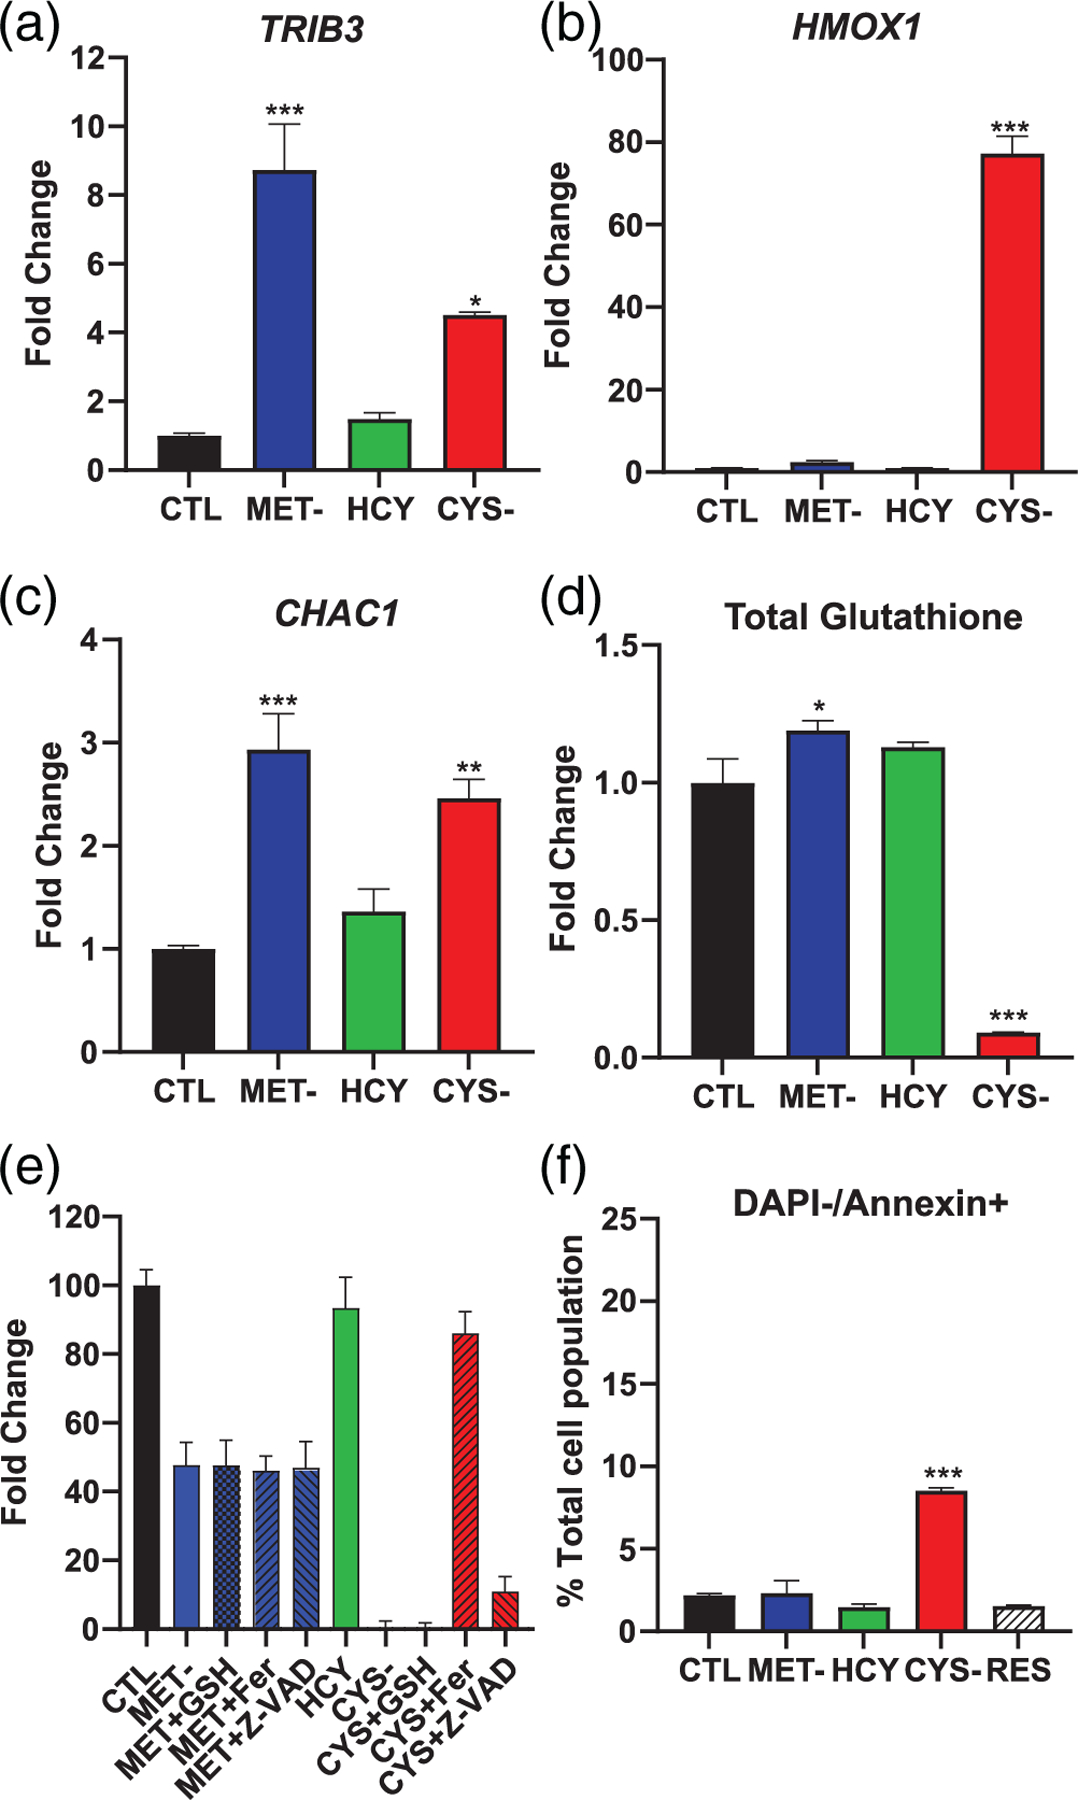
Methionine and cysteine depletion in normal human CCL-75 fibroblasts. Gene expression of (a) TRIB3, (b) HMOX1, and (c) CHAC1. (d) Total glutathione levels. (e) Proliferation and (f) viability rescue with Hoechst DNA staining. CTL, control media; CYS-, cysteine-free media; HCY, methionine-free, homocysteine-supplemented media; MET-, methionine-free media
3.8 |. Glutamine depletion shares some but all features of methionine and cysteine depletion
To deepen our understanding of the cellular response to methionine and cysteine depletion, we compared the effect of the depletion of a non-sulfur amino acid; glutamine. As expected, there was a considerable overlap in the gene expression changes we observed in A101D cells grown without glutamine compared to those described above. The expression of the genes ATF4, SESN2, TRIB3, FGF21, SLC7A11, NFE2L2, and CHAC1 was affected very similarly after glutamine depletion as it was after methionine or cysteine depletion (Figure 7a). However, interesting differences also appeared. The methionine transporter SLC7A5 (LAT1) was increased over twofold after glutamine depletion, despite the low affinity of this transporter for glutamine. HMOX1, the downstream target of the transcription factor NRF2 (NFE2L2), was also significantly increased after glutamine depletion, but at a level much more modest than that seen in methionine and cysteine depletion (1.1-fold compared to threefold to fourfold). We also observed a decrease in the glutamate-cysteine ligase regulatory subunit GCLM. We measured a decrease in glutathione levels in cells grown without l-glutamine for 24 hr, with levels 68% of those in control cells (Figure 7b). Flow cytometry analysis of the Annexin V reporter indicated that after 24 hr, over 11% of cells displayed signs of early apoptosis, a proportion similar to what we previously observed in methionine-deprived cells (Figure 7c). This indicates that glutamine depletion induces the ATF4 cascade and apoptosis in melanoma cells, similarly to methionine depletion.
FIGURE 7.
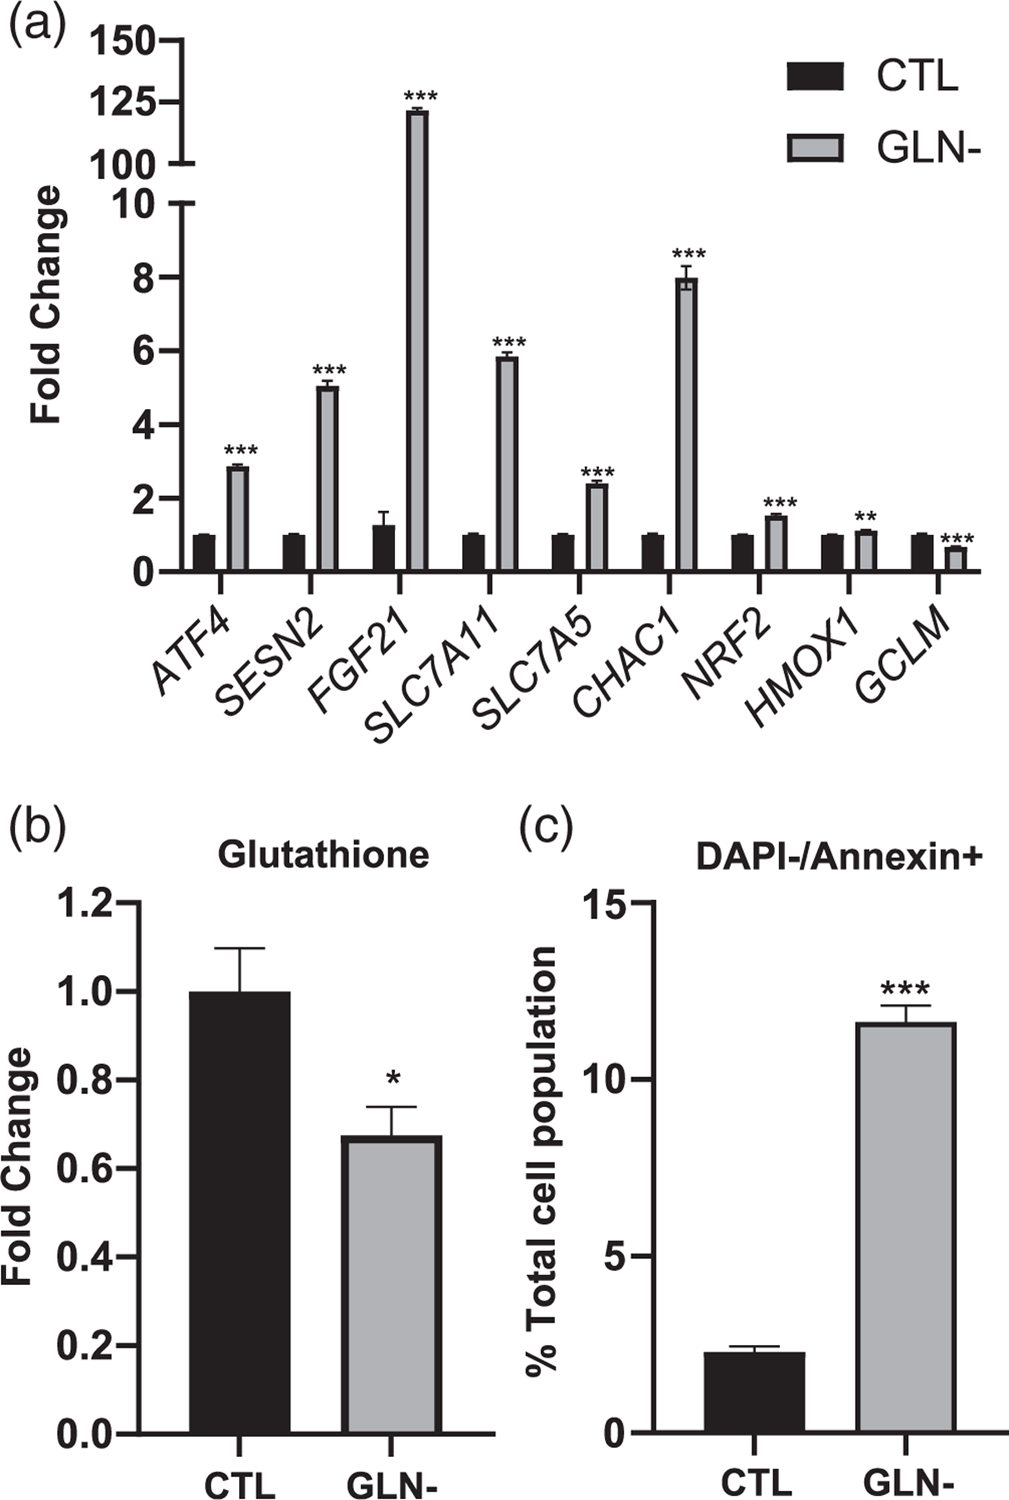
Glutamine depletion in human melanoma cells. Gene expression (a), total glutathione levels (b), and apoptosis analysis by Annexin V flow cytometry (c). CTL, control media; GLN-, glutamine-free media
4 |. DISCUSSION
With promising data in the literature supporting the use of both methionine and cysteine depletion in cancer, this project investigated the pathways and cell death resulting from these conditions in vitro. As suggested by previous literature, we found a significant overlap between the metabolic pathways activated by methionine and cysteine depletion. In both methionine-dependent and methionine-independent cells, the expression of the transcription factor ATF4 was increased by methionine and cysteine depletion. It also stimulated the expression of downstream genes involved in the integrated stress response. These changes largely overlapped to those seen after the depletion of another amino acid: glutamine. Homocysteine could blunt that response in methionine-independent normal fibroblasts, but not in methionine-dependent melanoma cells.
In addition, our results suggest an activation of the NRF2 antioxidant response. Both methionine and cysteine depletion led to the upregulation of the NRF2 target genes FGF21 and HMOX1, although this upregulation was larger for cysteine depletion than methionine depletion. In the case of GCLM, involved in glutathione synthesis, only cysteine depletion led to significant upregulation.
This involvement of the antioxidant response is consistent with the role of methionine and cysteine as precursors of the antioxidant glutathione in cancer cells. Accordingly, we found a 40% decrease in total glutathione in methionine-depleted cells. This decrease was however modest in comparison with cysteine depletion (95%), but larger than the one observed after glutamine depletion. Maybe due to the remaining glutathione present in the cell, we did not find any evidence of ferroptotic cell death following methionine depletion.
Rather than displaying indications of ferroptosis, methionine-depleted melanoma cells showed positive staining for Annexin V with intact membrane. This supports a role for apoptosis in cell death, as previously suggested (Strekalova et al., 2015). Treatment with a caspase inhibitor did offer some modest rescue. Cysteine depletion was associated with a low level of either Annexin V staining or rescue with a caspase inhibitor. This supports a modest role for apoptosis in cysteine depletion.
Finally, glutathione was not decreased in methionine-depleted normal fibroblasts. Cysteine depletion, on the other hand, depleted glutathione to a similar level to the one seen in cancer cells. Normal cells, except for hepatocytes, do not express cystathionine beta-synthase and cystathionine gamma-lyase in the transulfuration pathway. As a result, methionine and homocysteine are not diverted for cysteine and glutathione synthesis in the normal human fibroblasts tested here. However, blocking the transulfuration pathway in cancer cells may not prevent the decrease in glutathione following methionine depletion. If the diversion of remaining methionine and homocysteine towards the transulfuration were relevant to glutathione synthesis, we would have expected homocysteine supplementation to alleviate the decrease in glutathione. Hoechst DNA staining in methionine-depleted normal cells could only be rescued with the addition of homocysteine in our experiment. We believe this argues in favor of a deficit in proliferation rather than an increase in cell death. Cysteine depletion, on the other hand, was very efficiently rescued by the addition of the ferroptosis inhibitor ferrostatin. This rescue was in fact much more robust than in melanoma cells. This may be due to additional cell death mechanisms in melanoma cells, or potentially more likely, to the slower proliferation rate in normal cells.
These results suggest that methionine and cysteine depletion activate similar genetic pathways in melanoma cells, but lead to different forms of cell death. While the integrated stress response is a part of the ferroptotic signature as defined by Dixon and colleagues, the association between the ATF4 gene activation network and non-ferroptotic cell death can be misleading. Our data also indicates that normal cells are resilient to methionine depletion but sensitive to cysteine depletion. Methionine depletion, but not cysteine depletion, therefore specifically induce cell death in cancer cells in vitro. Contrary to dietary methionine depletion and restriction, dietary cysteine depletion may not be a viable option due to the ability of the liver to synthesize cysteine from methionine. However, the use of cysteinase in vivo is promising and its effect on normal tissue biology remains to be defined. The overall level of glutathione in tumors, in addition to gene expression patterns, may provide information about the bifurcation between apoptosis and ferroptosis in preclinical and clinical data. This would provide a better understanding of the processes leading to cell death in human cancers.
Supplementary Material
ACKNOWLEDGMENTS
The project described was supported by the Translational Research Institute (TRI), grant KL2 TR003108/UL1 TR003107 through the National Center for Advancing Translational Sciences of the National Institutes of Health (NIH). We would like to acknowledge Drs. Issam Makhoul, Alan Tackett, Brian Koss, and Nukhet Aykin-Burns for helpful advice.
Funding information
National Institutes of Health, Grant/Award Numbers: UL1 TR003107, KL2 TR003108
Footnotes
SUPPORTING INFORMATION
Additional supporting information may be found online in the Supporting Information section at the end of this article.
REFERENCES
- Ables GP, Perrone CE, Orentreich D and Orentreich N (2012) Methionine-restricted C57BL/6J mice are resistant to diet-induced obesity and insulin resistance but have low bone density. PLoS One, 7, e51357. [DOI] [PMC free article] [PubMed] [Google Scholar]
- Badgley MA, Kremer DM, Maurer HC, DelGiorno KE, Lee H-J, Purohit V, Sagalovskiy IR, Ma A, Kapilian J, Firl CEM, et al. (2020) Cysteine depletion induces pancreatic tumor ferroptosis in mice. Science, 368, 85–89. [DOI] [PMC free article] [PubMed] [Google Scholar]
- Bárcena C, Quirós PM, Durand S, Mayoral P, Rodríguez F, Caravia XM, Mariño G, Garabaya C, Fernández-García MT, Kroemer G, Freije JMP and López-Otín C (2018) Methionine restriction extends lifespan in Progeroid mice and alters lipid and bile acid metabolism. Cell Reports, 24, 2392–2403. [DOI] [PMC free article] [PubMed] [Google Scholar]
- Combs JA and DeNicola GM (2019) The non-essential amino acid cysteine becomes essential for tumor proliferation and survival. Cancers (Basel), 11. https://www.mdpi.com/about/announcements/784. [DOI] [PMC free article] [PubMed] [Google Scholar]
- Dixon SJ, Patel DN, Welsch M, Skouta R, Lee ED, Hayano M, Thomas AG, Gleason CE, Tatonetti NP, Slusher BS and Stockwell BR (2014) Pharmacological inhibition of cystine-glutamate exchange induces endoplasmic reticulum stress and ferroptosis. Elife, 3, e02523. [DOI] [PMC free article] [PubMed] [Google Scholar]
- Halpern BC, Clark BR, Hardy DN, Halpern RM and Smith RA (1974) The effect of replacement of methionine by homocystine on survival of malignant and normal adult mammalian cells in culture. Proceedings of the National Academy of Sciences of the United States of America, 71, 1133–1136. [DOI] [PMC free article] [PubMed] [Google Scholar]
- Kokkinakis DM, Brickner AG, Kirkwood JM, Liu X, Goldwasser JE, Kastrama A, Sander C, Bocangel D and Chada S (2006) Mitotic arrest, apoptosis, and sensitization to chemotherapy of melanomas by methionine deprivation stress. Molecular Cancer Research, 4, 575–589. [DOI] [PubMed] [Google Scholar]
- Law CW, Chen Y, Shi W and Smyth GK (2014) Voom: precision weights unlock linear model analysis tools for RNA-seq read counts. Genome Biology, 15, R29. [DOI] [PMC free article] [PubMed] [Google Scholar]
- Lees EK, Król E, Grant L, Shearer K, Wyse C, Moncur E, Bykowska AS, Mody N, Gettys TW and Delibegovic M (2014) Methionine restriction restores a younger metabolic phenotype in adult mice with alterations in fibroblast growth factor 21. Aging Cell, 13, 817–827. [DOI] [PMC free article] [PubMed] [Google Scholar]
- Liao Y, Smyth GK and Shi W (2014) featureCounts: an efficient general purpose program for assigning sequence reads to genomic features. Bioinformatics, 30, 923–930. [DOI] [PubMed] [Google Scholar]
- Loewy AD, Niles KM, Anastasio N, Watkins D, Lavoie J, Lerner-Ellis JP, Pastinen T, Trasler JM and Rosenblatt DS (2009) Epigenetic modification of the gene for the vitamin B(12) chaperone MMACHC can result in increased tumorigenicity and methionine dependence. Molecular Genetics and Metabolism, 96, 261–267. [DOI] [PubMed] [Google Scholar]
- Lu S, Hoestje SM, Choo EM and Epner DE (2002) Methionine restriction induces apoptosis of prostate cancer cells via the c-Jun N-terminal kinase-mediated signaling pathway. Cancer Letter, 179, 51–58. [DOI] [PubMed] [Google Scholar]
- Luo T, Yang Y, Xu Y, Gao Q, Wu G, Jiang Y, Sun J, Shi Y and Le G (2019) Dietary methionine restriction improves glucose metabolism in the skeletal muscle of obese mice. Food Function, 10, 2676–2690. [DOI] [PubMed] [Google Scholar]
- Malloy VL, Krajcik RA, Bailey SJ, Hristopoulos G, Plummer JD and Orentreich N (2006) Methionine restriction decreases visceral fat mass and preserves insulin action in aging male Fischer 344 rats independent of energy restriction. Aging Cell, 5, 305–314. [DOI] [PubMed] [Google Scholar]
- McCarthy DJ, Chen Y and Smyth GK (2012) Differential expression analysis of multifactor RNA-Seq experiments with respect to biological variation. Nucleic Acids Research, 40, 4288–4297. [DOI] [PMC free article] [PubMed] [Google Scholar]
- Orentreich N and Zimmerman J (1993) Low methionine ingestion by rats extends life span. Age (days), 1050, 1300. [DOI] [PubMed] [Google Scholar]
- Rajanala SH, Ringquist R and Cryns VL (2019) Methionine restriction activates the integrated stress response in triple-negative breast cancer cells by a GCN2- and PERK-independent mechanism. American Journal of Cancer Research, 9, 1766–1775. [PMC free article] [PubMed] [Google Scholar]
- Richie JP, Leutzinger Y, Parthasarathy S, Malloy V, Orentreich N and Zimmerman JA (1994) Methionine restriction increases blood glutathione and longevity in F344 rats. The FASEB Journal, 8, 1302–1307. [DOI] [PubMed] [Google Scholar]
- Ritchie ME, Phipson B, Wu D, Hu Y, Law CW, Shi W and Smyth GK (2015) Limma powers differential expression analyses for RNA-sequencing and microarray studies. Nucleic Acids Research, 43, e47. [DOI] [PMC free article] [PubMed] [Google Scholar]
- Robinson MD, McCarthy DJ and Smyth GK (2010) edgeR: a bioconductor package for differential expression analysis of digital gene expression data. Bioinformatics, 26, 139–140. [DOI] [PMC free article] [PubMed] [Google Scholar]
- Strekalova E, Malin D, Good DM and Cryns VL (2015) Methionine deprivation induces a targetable vulnerability in triple-negative breast cancer cells by enhancing TRAIL Receptor-2 expression. Clinical Cancer Research, 21, 2780–2791. [DOI] [PMC free article] [PubMed] [Google Scholar]
- Sun Y, Zheng Y, Wang C and Liu Y (2018) Glutathione depletion induces ferroptosis, autophagy, and premature cell senescence in retinal pigment epithelial cells. Cell Death & Disease, 9, 1–15. [DOI] [PMC free article] [PubMed] [Google Scholar]
- Wang L, Ren B, Zhang Q, Chu C, Zhao Z, Wu J, Zhao W, Liu Z and Liu X (2020) Methionine restriction alleviates high-fat diet-induced obesity: involvement of diurnal metabolism of lipids and bile acids. Biochimica et Biophysica Acta (BBA)—Molecular Basis of Disease, 1866, 165908. [DOI] [PubMed] [Google Scholar]
- Wang S, Chen XA, Hu J, Jiang J, Li Y, Chan-Salis KY, Gu Y, Chen G, Thomas C, Pugh BF and Wang Y (2015) ATF4 gene network mediates cellular response to the anticancer PAD inhibitor YW3–56 in triple negative breast cancer cells. Molecular Cancer Therapy, 14, 877–888. [DOI] [PMC free article] [PubMed] [Google Scholar]
Associated Data
This section collects any data citations, data availability statements, or supplementary materials included in this article.


