

Summary
Brassica rapa displays a wide range of morphological diversity which is exploited for a variety of food crops. Here we present a high‐quality genome assembly for pak choi (Brassica rapa L. subsp. chinensis), an important non‐heading leafy vegetable, and comparison with the genomes of heading type Chinese cabbage and the oilseed form, yellow sarson. Gene presence–absence variation (PAV) and genomic structural variations (SV) were identified, together with single nucleotide polymorphisms (SNPs). The structure and expression of genes for leaf morphology and flowering were compared between the three morphotypes revealing candidate genes for these traits in B. rapa. The pak choi genome assembly and its comparison with other B. rapa genome assemblies provides a valuable resource for the genetic improvement of this important vegetable crop and as a model to understand the diversity of morphological variation across Brassica species.
Keywords: Brassica rapa, genome, pak choi, genetic variation, leaf‐heading genes, flowering genes
Introduction
Brassica crop species consist of three diploid species, B. rapa (AA), B. nigra (BB) and B. oleracea (CC), and three amphidiploid species, Brassica juncea (AABB), Brassica napus (AACC) and Brassica carinata (BBCC), which together form the well‐established ‘triangle of U’ model (Nagaharu, 1935). B. rapa comprises several subspecies with diverse morphology, including turnip (subsp. rapa) with its enlarged edible root, the seed oil crop yellow sarson (subsp. trilocularis), and leafy vegetables such as the non‐heading pak choi (subsp. chinensis) and heading Chinese cabbage (subsp. pekinensis) (Bonnema et al., 2011; Qi et al., 2017).
The diploid Brassica genomes have experienced a shared whole‐genome triplication event (WGT) (Wang et al., 2014) and are an important resource for the study of polyploidy in relation to plant evolution and crop improvement (Peace, 2017; Wang et al., 2014; Yang et al., 2016). Both the diploid and polyploid Brassica species host an extensive range of genomic variation, including presence–absence variants (PAV), structural variants (SV) and copy number variants (CNV), which can be characterized through the comparison of high‐quality genome assemblies (Bayer et al., 2017; Sun et al., 2018; Zhang et al., 2019). The availability of the genomes of heading Chinese cabbage and yellow sarson and the resequencing of multiple genotypes has enabled rapid progress in B. rapa genomics (Belser et al., 2018; Cheng et al., 2016; Wang et al., 2014; Zhang et al., 2018). However, the lack of a genome assembly for a non‐heading morphotype limits our understanding of the genomic basis for morphological diversity (Cheng et al., 2016).
Pak choi, a non‐heading form of Chinese cabbage, has been cultivated in southern China for more than 1600 years ago (Wang and Kole, 2015) and is now a globally important vegetable. It is closely related to both yellow sarson and heading Chinese cabbage, though presents a non‐heading phenotype (Qi et al., 2017). Thus, pak choi is a valuable resource for analysing the relationship between genomic differences and agronomically important morphological variation in this species (Belser et al., 2018; Cheng et al., 2016). Many important genes and regulators of leaf development and flowering have previously been identified in B. rapa based on quantitative trait loci (QTL), genome‐wide association studies (GWAS) and transcriptome analyses (Cheng et al., 2016; Su et al., 2018; Xiao et al., 2014; Xiao et al., 2013). In addition, many genome structural variants and SNPs have been identified by genome comparison and pangenome analyses (Bayer et al., 2018; Golicz et al., 2016; Sun et al., 2018).
In this study, we have produced a high‐quality pak choi reference genome assembly using single‐molecule sequencing (PacBio) and chromosome conformation capture (Hi‐C) technologies. This reference provides an opportunity for comparison of intraspecific genome diversity between B. rapa morphotypes. Comparison of the pak choi and heading Chinese cabbage genomes identified 1 324 570 SNPs and 244 216 small insertions/deletions (indels), together with 764 pak choi‐specific genes and 1044 Chinese cabbage‐specific genes. An additional 1 643 615 SNPs and 303 350 indels were identified between pak choi and yellow sarson, with 1289 pak choi‐specific genes and 972 yellow sarson‐specific genes were also identified in comparisons between pak choi and yellow sarson. In addition, we also identified 1431 Chinese cabbage‐specific PAV genes and 829 yellow sarson‐specific genes. Thirteen genes previously identified as having a role in leaf shape and polarity were also characterized, along with 18 genes related to flowering. This pak choi genome assembly provides a valuable resource for comparative studies and trait analysis, not only in Brassica rapa but also in the broader context of Brassica crop improvement.
Results and discussion
The pak choi genome assembly and validation
Genome assemblies are currently available for two B. rapa cultivars, a heading Chinese cabbage type and a yellow sarson oilseed type (Belser et al., 2018; Wang et al., 2014; Zhang et al., 2018). Here we produced a 370 Mb genome assembly of a non‐heading purple pak choi cultivar. The use of long‐read PacBio sequence data and the Canu assembler produced a draft assembly with an N50 contig size of 2.82 Mb, longer than previous B. rapa genome assemblies (Table 1). Subsequent scaffolding with Hi‐C data was carried out to generate chromosome‐length scaffolds (Figure S1). Ten scaffolds corresponding to the 10 chromosomes were assembled, giving a final size of 341 Mb, with the remaining 29 Mb as unassigned contigs (Table S1). The genome size of B. rapa has been previously estimated to be 455 Mb based on flow cytometry (Zhang et al., 2018), and however, our results from kmer analysis estimate a nuclear genome size of 406 Mb (Figure S2), suggesting that we have assembled around 91 % of the nuclear genome. To determine the accuracy and completeness of the assembly, Benchmarking Universal Single‐Copy Orthologs (BUSCOs) were assessed. Of 1440 BUSCOs, 98.1% were complete, with only 1.1% missing in the assembly (Table S2). Single‐ and multi‐copy genes accounted for 85.8% and 12.3% of the complete genes, respectively. In comparison, complete and missing BUSCOs in the Chinese cabbage assembly were 97.9% and 1.5%, respectively, while in the yellow sarson assembles 97.7% and 1.5% were complete and missing. These suggest that the pak choi assembly is the most complete of the B. rapa genome assemblies to date.
Table 1.
Comparisons of assembly statistics and annotation of the pak choi genome and published Chinese cabbage and yellow sarson genome assemblies
| Pak choi genome | Chinese cabbage genome | Yellow sarson genome | |
|---|---|---|---|
| Assembly feature | |||
| Total assembly size (Mb) | 370.42 | 353.14 | 401.92 |
| Total chromosome size (Mb) | 341.14 a | 296.58 | 357.07 |
| Contig number | 1985 | 1498 | 1037 |
| Contig N50 (Mb) | 2.82 | 1.45 | 2.27 |
| Longest length (Mb) | 22.37 | 9.42 | 22.13 |
| Genome annotation | |||
| Gene model | 45 363 | 46 250 | 46 721 |
| Percentage of anchored genes (%) | 98.50% | 98.58% | 98.14% |
See Table S1.
Transposable elements and other repeat sequences are abundant and widely dispersed throughout plant genomes (Maumus and Quesneville, 2016). Approximately 48.68% of the pak choi assembly sequences were annotated as repetitive elements, including DNA transposons (9.02%), retrotransposons (33.74%) and unclassified elements (2.9%) (Table S3). In the long‐read pak choi assembly, we detected a higher proportion of bases accounting for long terminal repeat retrotransposon (LTR), the latter covering a total length of 109 Mb and representing 29.4% of the assembled genome, almost twice the length identified in the Chinese cabbage (57.6 Mb) (Zhang et al., 2018). In addition, we accurately defined the location of the centromeres of ten chromosomes in pak choi assembly (Table S4) and determined centromeric repeat sequences, including centromeric satellite repeats CentBr, CRB, TR238 and PCRBr (Figure S3).
RNA‐seq and ab initio based gene prediction were combined to annotate the protein‐coding genes, identifying 45 363 candidates, covering 26.29% of the assembly, and with an average size of 1125 bp (Table 1). The gene density was approximately 11.2 genes per 100 kilobase (kb), with the majority of genes (44 686; 98.5%) present on chromosomally anchored contigs. A total of 1599 tRNA, 4495 rRNA, 255 microRNA (miRNA) genes and 1062 small nuclear RNA (snRNA) were also identified (Table S5). The quality of gene annotation was further evaluated by BUSCO, and approximately 97.9% of the embryophyte genes were detected in the pak choi, which was higher than in the previously reported Chinese cabbage and yellow sarson (Table S6).
Comparison between Chinese cabbage, yellow sarson and pak choi
Genomic variation is an important source of diversity for selection and breeding. Variations include insertions, deletions, inversions and duplications. Comparisons of the pak choi and Chinese cabbage genomes identified 1 324 570 SNPs and 244 216 indels in the aligned syntenic blocks, with an average of 3.88 SNPs and 0.72 indels per kb. Furthermore, a total of 11 931 pak choi‐specific regions covering 13.34 Mb, and 10 502 heading Chinese cabbage‐specific regions covering 11.68 Mb longer than 499 bp were identified, and only 147 pak choi and 140 heading Chinese cabbage‐specific regions longer than 5 kb were detected (Figure S4a). The longest PAV sequence segment was a 29 899‐bp pak choi‐specific segment and was found from 40 383 002 to 40 412 900 bp on chromosome 3, while the longest Chinese cabbage‐specific segment was 17 299 bp on chromosome 9 from 35 982 202 to 35 999 500 bp. The SNPs, indels and PAVs are unevenly distributed across the genome (Figure 1a).
Figure 1.
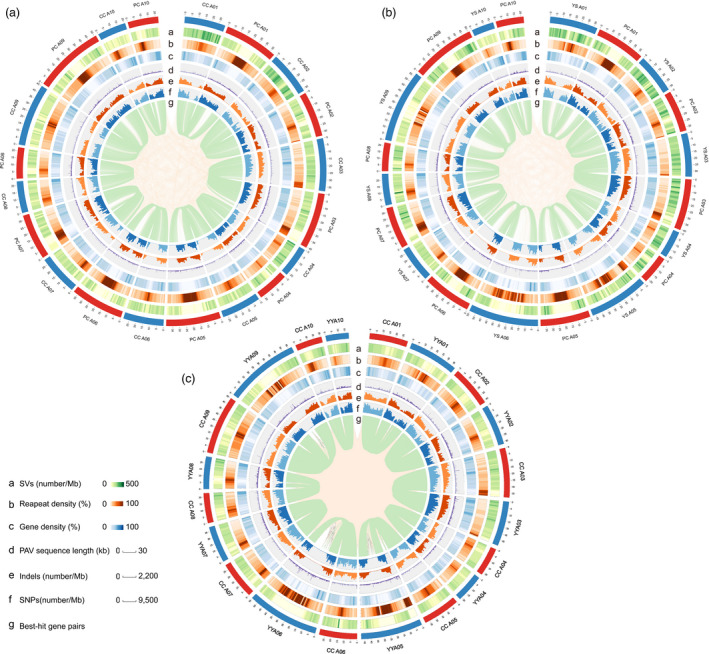
Genomic landscape of pak choi, Chinese cabbage and yellow sarson. (a) Genomic comparison of pak choi (PC) and Chinese cabbage (CC). (b) Genomic comparison of pak choi and yellow sarson (YS). (c) Genomic comparison of Chinese cabbage and yellow sarson. The distribution of SVs, repeat element density, gene density, distribution of PAV sequences, number of indels, number of SNPs and gene pairs between the two genomes are shown as identified using the best‐hit method. All the components were calculated using 1‐Mb sliding windows.
Comparisons of the pak choi and yellow sarson genomes revealed 1 643 615 SNPs and 303 350 indels in the aligned syntenic blocks, with an average of 4.81 SNPs and 0.89 indels per kb (Figure 1b), respectively. Meanwhile, a total of 14 872 pak choi‐specific regions covering 17.2 Mb, and 14 160 yellow sarson‐specific regions covering 15.6 Mb were identified. However, only 201 and 182 morphotype‐specific regions longer than 5 kb were identified in the pak choi and yellow sarson genomes, respectively (Figure S4b). In total, we found 2985 pak choi‐specific regions that were absent both in yellow sarson and Chinese cabbage, covering 3.14 Mb of pak choi genome. Furthermore, 2632 Chinese cabbage‐specific regions were absent both in yellow sarson and pak choi, covering 2.56 Mb of Chinese cabbage genome. In addition, 5037 yellow sarson‐specific regions were absent both in Chinese cabbage and pak choi (Figure 1c), covering 5.10 Mb of yellow sarson genome.
The three B. rapa genomes showed a high degree of gene collinearity (Figure 2a). Furthermore, comparative analysis revealed that 35 430 pak choi and Chinese cabbage genes were syntenic using SynOrths (Cheng et al., 2012). Comparisons also identified 33 422 syntenic genes between pak choi and yellow sarson, and 34 464 genes syntenic genes between Chinese cabbage and yellow sarson, revealed that most gene order was conserved in B. rapa. Using a whole‐genome alignment approach, 5794, 5957 and 8349 collinear fragments were identified between the pak choi genome and Chinese cabbage and yellow sarson genomes, respectively (Figure 2c‐e). In general, three genomes were relatively stable except the centromeres, which may be difficult to orientate correctly as too many repeated sequences limit the utility of HiC (Figure 2c‐e). Centromeric regions have a low recombination rate, and sequences of these regions are always difficult to order and orient correctly (Belser et al., 2018). We then mapped the long read of pak choi to pak choi, Chinese cabbage and yellow sarson centromeric regions, finding that several rearrangements are correct, despite the mis‐assembly in all three centromeric regions of chromosome A07 (Figure S5).
Figure 2.
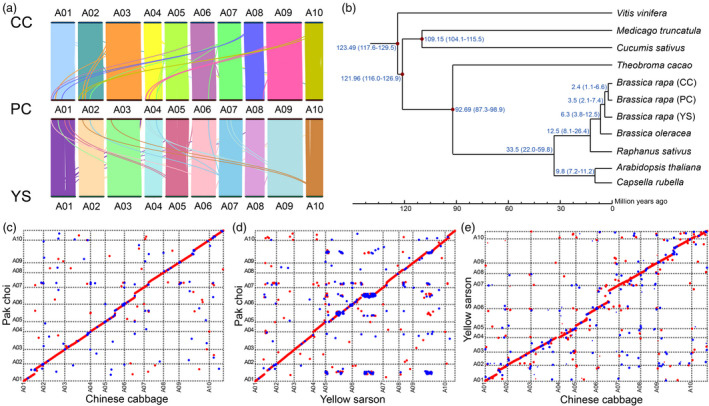
Synteny, phylogenetic evolution and mummerplot comparisons of the three Brassica rapa species. (a) Gene order comparison. Each line connects a pair of best bidirectional hits orthologous genes between the pak choi, Chinese cabbage and yellow sarson genomes. (b) Phylogenetic analysis of pak choi with other Brassiceae species. The estimated species divergence time (Mya) and 95% confidential intervals are shown at each branch site. The divergence used for time recalibration is highlighted by red dots. (c) Nucmer comparison of the pak choi genome and Chinese cabbage genome assembly. (d) Nucmer comparison of the pak choi genome and yellow sarson genome assembly. (e) Nucmer comparison of the Chinese cabbage genome and yellow sarson genome assembly. Chromosomal inversions and breakage in assembly orientation in relation to the chromosomal sequence on the X‐axis are shown in blue.
Divergence of the common Brassica ancestor from A. thaliana is predicted to have occurred around 33.5 million years ago (Mya), with the estimated divergence between yellow sarson, Chinese cabbage and pak choi estimated to be approximately 3.5 and 2.4 Mya, respectively (Figure 2b). Divergence of B. rapa and B. oleracea based on diverse nuclear sequences was estimated 4–8.5 Mya (Liu et al., 2014; Sun et al., 2019) suggesting that this occurred prior to the B. rapa morphotype divergence. B. napus was formed 7500–12 500 years ago by interspecific hybridization between B. rapa and B. oleracea (Chalhoub et al., 2014). Within B. rapa species, the yellow sarson diverged from the other B. rapa varieties (including Chinese cabbage and pak choi) approximately 0.86 Mya based on the chloroplast genomes (Li et al., 2017).
Genes with structural variations between Chinese cabbage, yellow sarson and pak choi
To assess structural variation of genes, the pak choi assembly was aligned with both the Chinese cabbage and yellow sarson genomes as previously described (Sun et al., 2018). As a result, a total of 35 874 and 32 582 structurally conserved pak choi genes were identified compared to the Chinese cabbage and yellow sarson genomes, respectively, including genes with missense mutations only, non‐frameshift indels and no amino acid changes (Table 2). Furthermore, 5135 and 7036 pak choi genes showed large‐effect mutations compared with the Chinese cabbage and yellow sarson genomes, respectively (Table S7), such as start or stop codon mutations, splice acceptor or splice donor mutations, frameshift mutations or premature stop codon mutations. In addition, 3124 and 4307 pak choi genes with incomplete coding sequences (CDS) were also revealed compared with the Chinese cabbage and yellow sarson genomes, respectively (Table S8). Among these genes, 1995 and 2841 were pak choi genes with at least one exon missing compared with the Chinese cabbage and yellow sarson genomes, respectively.
Table 2.
Gene variations between the pak choi (PC) genome compared with the Chinese cabbage (CC) and yellow sarson (YS) genomes
| Variation type | PC vs CC | PC vs YS | Classification |
|---|---|---|---|
| Structurally conserved genes | 35 874 | 32 582 | Classification Ⅰ |
| Without amino acid substitutions | 16 396 | 10 737 | Classification Ⅰ |
| No DNA variation in the CDS region | 12 753 | 7006 | Classification Ⅰ |
| No DNA variation in the CDS and intron region | 9968 | 4905 | Classification Ⅰ |
| No DNA variation in the genic region a | 1887 | 346 | Classification Ⅰ |
| With 3n indel in CDS | 5022 | 6018 | Classification Ⅰ |
| With amino acid changes | 19 478 | 21 845 | Classification Ⅰ |
| With missense mutation in CDS | 19 462 | 21 822 | Classification Ⅰ |
| Genes with large‐effect mutations | 5135 | 7036 | Classification Ⅱ |
| Premature stop codon | 3689 | 5184 | Classification Ⅱ |
| Splice acceptor mutation | 343 | 471 | Classification Ⅱ |
| Splice donor mutation | 217 | 304 | Classification Ⅱ |
| Start codon mutation | 258 | 366 | Classification Ⅱ |
| Stop codon mutation | 386 | 505 | Classification Ⅱ |
| With 3n+‐1 indel in CDS | 2346 | 3544 | Classification Ⅱ |
| Genes with incomplete CDS | 3124 | 4307 | Classification Ⅲ |
| At least one exon missing | 1995 | 2841 | Classification Ⅲ |
Genic regions contain 2 kb upstream and downstream of the gene body. Classification Ⅰ, Ⅱ, Ⅲ mean structurally conserved genes, genes with large‐effect mutations and genes with large structural variation, respectively.
Subsequently, we evaluated the PAV genes between Chinese cabbage, yellow sarson and pak choi, with the criterion requiring at least 75% of coding sequences to overlap with PAV sequences. In total, 764 pak choi‐specific genes and 1044 Chinese cabbage‐specific genes were identified (Table S9), together with 1289 pak choi‐specific and 972 yellow sarson‐specific genes by using the same method (Table S9).
Comparison of genes related to leaf development between pak choi and Chinese cabbage
The difference between heading Chinese cabbage and non‐heading pak choi is due to the interaction between the upper (adaxial) and lower (abaxial) regions during the development of the leaf primordium (Cheng et al., 2016). Leaf shape and polarity are also involved in three pathways, including the HD‐ZIPIII‐KANADI (KAN), TAS3‐ETT‐ARF4 and AS1‐AS2 pathways, and then converge on the YABBY genes (Aaron and Mark, 2009; Husbands et al., 2009; Kidner and Timmermans, 2007; Pekker et al., 2005; Stamm and Kumar, 2010). KAN, a member of transcription factors belonging to the GARP family, is a key regulator of abaxial identity, leaf growth and meristem formation (Huang et al., 2014). However, the function of these genes has diverged in different species, suggesting that pathways from diverse sources could have been recruited to provide multiple redundant specifications of leaf polarity.
By analysing PAVs and specific SVs between pak choi and Chinese cabbage, 13 orthologues of Arabidopsis adaxial–abaxial polarity pathway genes were identified in B. rapa (BrYABBY1, BrKAN1.1, BrKAN1.2, BrKAN2.2, BrKAN3.1, BrKAN3.2, BrBRXL1, BrBRXL2.1, BrBRXL2.2, BrARF3, BrREV, BrKNAT4 and BrATHB15) (Figure 3 and Figure S6 and Table 3). In B. rapa, we found nine KAN genes, which were the orthologues of four Arabidopsis KAN genes (Figure S7). Encouragingly, we identified five KAN genes with large variations between the Chinese cabbage and pak choi (Figure 3a‐e). We compared the gene structures of BrKAN1.1, BrKAN1.2, BrKAN2.2, BrKAN3.1 and BrKAN3.2 between the pak choi and Chinese cabbage genome, demonstrating 1895‐bp, 9829‐bp, 2100‐bp, 988‐bp and 591‐bp deletions in the gene sequences of pak choi genome, respectively. Furthermore, we identified 275‐bp, 1370‐bp, 241‐bp and 7‐bp deletions within the 1 kb upstream of BrKAN1.1, BrKAN1.2, BrKAN3.1 and BrKAN3.2 (Figure 3), respectively. None of these variations were caused by transposon insertions. Furthermore, premature stop codon mutation was detected in BrARF3, BrBRXL1, BrKAN3.1, BrKAN3.2, BrKNAT4, BrREV, BrYABBY1, BrATHB15 and BrBRXL2.1 (Table 3). Meanwhile, BrATHB15, BrARF3 and BrKAN3.2 also identified mutation with 3n+‐1 indel in CDS (Table S7).
Figure 3.
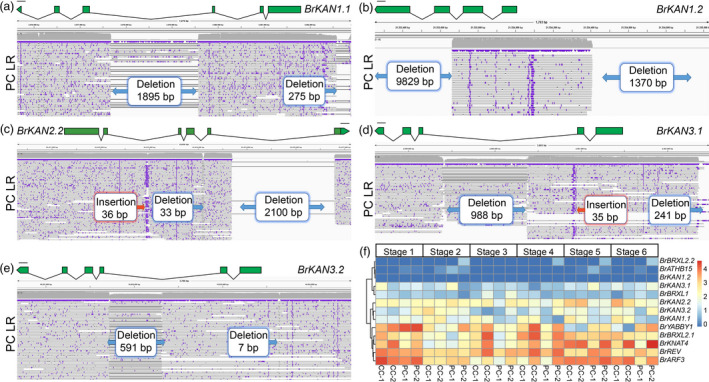
Gene variations and expression patterns in the putative genes involved in leaf shape and polarity between the pak choi (PC) and Chinese cabbage genomes (CC). IGV alignments showing the variations of BrKAN1.1 (a), BrKAN1.2 (b), BrKAN2.2 (c), BrKAN3.1 (d) and BrKAN3.2 (e) using long reads of pak choi genome. The exon (green box), intron (black line) and 1 kb upstream sequence were shown in the figure. (f) The expression heatmap of 13 genes at six growing stages. PC LR is short for pak choi long reads.
Table 3.
The SV and PAV genes for leaf‐heading morphotype
| Genes | B. rapa gene ID | Arabidopsis ID | Annotation | Variation type |
|---|---|---|---|---|
| BrARF3 | BraA05g01028P | AT2G33860 | Auxin response factor ARF3 | SV: Premature stop codon, Splice acceptor mutation, with 3n+‐1 indel in CDS |
| BrATHB15 | BraA07g02323P | AT1G52150 | Homeobox‐leucine zipper ATHB‐15 | PAV: CC absent |
| BrBRXL1 | BraA05g00877P | AT2G35600 | Brevis radix | SV: Premature stop codon |
| BrBRXL2.1 | BraA06g02590P | AT3G14000 | Brevis radix‐like 2 | SV: Premature stop codon, Splice acceptor mutation, Splice donor mutation |
| BrBRXL2.2 | BraA10g004350.3C | AT3G14000 | Brevis radix‐like 2 | PAV: PC absent |
| BrKAN1.1 | BraA02g00640P | AT5G16560 | Transcription repressor KANADI 1 | SV: Stop codon mutation |
| BrKAN1.2 | BraA02g031490.3C | AT5G16560 | Transcription repressor KANADI 1 | PAV: PC absent |
| BrKAN2.2 | BraA09g032840.3C | AT1G32240 | Transcription factor KANADI 2 | PAV: PC absent |
| BrKAN3.1 | BraA01g00911P | AT4G17695 | Transcription factor KANADI 3 | SV: Premature stop codon |
| BrKAN3.2 | BraA08g01201P | AT4G17695 | Transcription factor KANADI 3 | SV: Premature stop codon, with 3n+‐1 indel in CDS |
| BrKNAT4 | BraA03g00439P | AT5G11060 | Homeobox protein knotted‐1‐like 4 | SV: Premature stop codon |
| BrREV | BraA10g01717P | AT5G60690 | Homeobox‐leucine zipper REVOLUTA | SV: Premature stop codon |
| BrYABBY1 | BraA03g02273P | AT2G45190 | Axial regulator YABBY 1 | SV: Premature stop codon |
To further investigate the expression of the adaxial–abaxial polarity pathway genes in these two morphotypes, we performed transcriptome sequencing using leaves at six stages (S1–S6) started from seedlings to heading stages. BrKAN1.1, BrKAN2.2 and BrKAN3.2 were differentially expressed between the Chinese cabbage and pak choi accessions (Figure 3f), being up‐regulated in the Chinese cabbage cultivars during leaf‐heading stages (stage 5 and 6), with no differences in expression during the first stage (Figure 3f). Meanwhile, BrYABBY1 was also expressed dynamically between the Chinese cabbage and pak choi accessions throughout the development stages, being down‐regulated in the Chinese cabbage cultivars during leaf‐heading stages (Figure 3f). These results suggest that both BrKAN and BrYABBY genes may play a role in adaxial–abaxial patterning of leaf primordium in B. rapa.
Comparison of genes related to flowering time between the pak choi and yellow sarson genomes
Flowering time is a distinguishing phenotype of pak choi (late flowering) compared to yellow sarson (Belser et al., 2018). In this study, we examined the structure variation and expression of 18 orthologues to Arabidopsis genes controlling flowering time, including BrAP1A, BrBBX19, BrBOFH, BrCSTF77, BrEMF1, BrEMF2, BrFLC2, BrFPA1, BrFPA2, BrFRI, BrGA1, BrLFR, BrLHY, BrMAF4, BrPHYA, BrRGA1, BrSVP and BrTOE2 (Figure 4a‐f and Figure S8 and Table S10). Among these genes, BrFRI and BrRGA1 were absent in yellow sarson (Figure S8), while BrMAF4, BrCSTF77, BrBBX19 and BrBOFH were defined as absent in pak choi because of large deletion (Figure 4 and Figure S6). Subsequently, we found that the deletion of BrMAF4 in pak choi is a 6,043‐bp Copia LTR insertion in the first intron of BrMAF4 in yellow sarson (Figure 4a). Furthermore, premature stop codon mutation was detected in BrFLC2, BrFPA1, BrLFR, BrLHY, BrEMF1, BrEMF2, BrPHYA, BrTOE2 and BrSVP. Meanwhile, BrEMF1, BrEMF2, BrPHYA and BrTOE2 also identified mutation with 3n+‐1 indel in CDS. In addition, splice acceptor mutation was detected in BrEMF2 (Table S7 and Figure S8).
Figure 4.
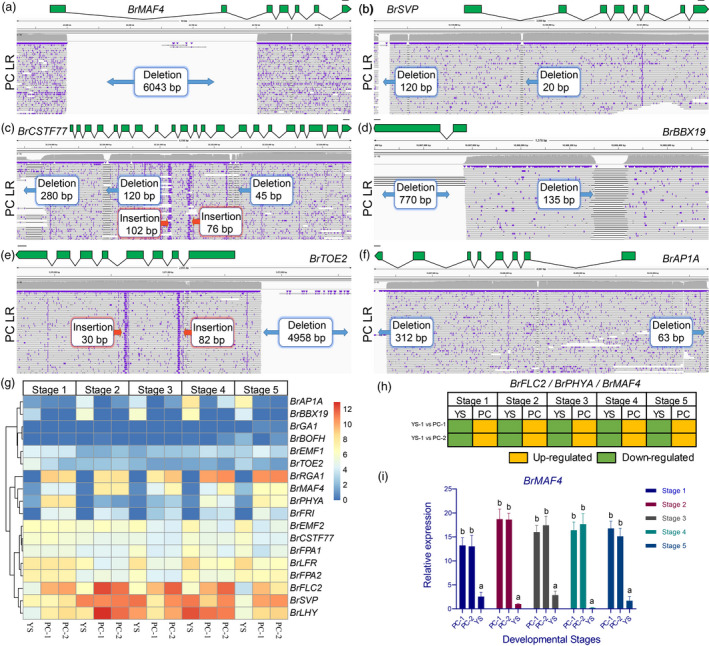
Gene variations and expression patterns in the putative genes involved in the flowering pathway between the pak choi (PC) and yellow sarson (YS) genomes. IGV alignments showing the variations of BrMAF4 (a), BrSVP (b), BrCSTF77 (c), BrBBX19 (d), BrTOE2 (e) and BrAP1A (f) using long reads of pak choi genome. (g) The expression heatmap of 18 genes at five growing stages. (h) Expression pattern of BrFLC2, BrPHYA and BrMAF4 at five stages. The exon (green box), intron (black line) and 1 kb upstream sequence were shown in the figure. (i) Real‐time PCR of BrMAF4 at five stages. PC LR is short for pak choi long reads.
Gene expression was compared between two pak choi and one yellow sarson cultivar at five stages (Figure 4g), with 14 genes displaying a significant difference in expression between pak choi and yellow sarson during flowering (stage 5) (Figure 4g). Furthermore, nine of the 14 genes were down‐regulated in yellow sarson during one or more developmental stages, while BrBOFH, BrEMF2, BrLFR, BrFPA2 and BrAP1A were up‐regulated in yellow sarson. Encouragingly, BrFLC2, BrPHYA and BrMAF4 were down‐regulated during all the developmental stages in yellow sarson (Figure 4h), while BrAP1A was all up‐regulated during the developmental stages in yellow sarson. The expression of BrMAF4 was subsequently validated using RTPCR (Figure 4i). While there was no major difference in the BrMAF4 promoter between pak choi and yellow sarson, genomic comparison identified a 6043 bp insertion within intron one and exon two in yellow sarson (Figure 4a), which altered the protein sequence of this gene (Figure S9). Several flowering genes have previously been studied in B. rapa, including BrFLC1, BrFLC2, BrFLC3, BrFLC5 and BrVIN3 (Dechaine et al., 2014; Su et al., 2018; Wu et al., 2012), and however our findings suggest that Floral repressor MAF4, which down‐regulates two floral pathway integrators, FLOWERING LOCUS T and SUPPRESSOR OF OVEREXPRESSION OF CONSTANS 1, in Arabidopsis (Shen et al., 2014) may play a role in differential flowering between B. rapa morphotypes.
In conclusion, this study reported, for the first time, a high‐quality pak choi genome, consisting of 44 686 predicted protein‐coding genes at the chromosome level. Comparison between the genomes of different morphotypes highlights the role of gene PAVs and SVs on important traits for breeding programmes. These findings provide new insight into the genomic diversity of Brassica rapa species, paving the way for further molecular breeding of pak choi.
Experimental procedures
Plant materials and sequencing
Genome sequencing and assembly was performed on a B. rapa L. subsp. chinensis Makino inbred line (ZYCX), which has purple leaf trait and is widely used as a parent in breeding experiments (Figure S10). Genomic DNA was extracted from leaf samples using a modified cetyltrimethylammonium bromide method (Allen et al., 2006). Libraries for Illumina PCR‐free paired‐end genome sequencing were constructed according to the manufacturer’s protocol (Illumina) and sequenced using the Illumina HiSeq X Ten platform (Illumina Inc., San Diego, CA). A PacBio library with a 20‐kb targeted size was generated using the Pacific Biosciences SMRTbell Template Prep Kit 1.0 following the manufacturer’s protocol (Pendleton et al., 2015) and sequenced using the PacBio Sequel platform using a Sequel Binding Kit 2.0, Sequel Sequencing Kit 2.1 and Sequel SMRT Cell 1 M v2 (Frasergen Biotechnology Co., Ltd, Wuhan, China).
De novo assembly of the PacBio SMRT reads
Following the removal of adaptor sequences, subreads ranging in size from 6.1 to 10 kb were used for genome assembly. Falcon v0.4 (Chin et al., 2016) was used to construct initial contigs with the following parameters: length_cutoff = 7000 length_cutoff_pr = 7000. Next, Canu v1.5 (Koren et al., 2017) was used for genome assembly with the Corrected‐Error‐Rate parameter set at 0.040, resulting in a total assembly length of 370 Mb with an N50 of length of 2.82 Mb.
Hi‐C library construction, chromosome assembly and evaluation
Hi‐C library preparation was carried out using the NEBNext® Ultra™ II DNA Library Prep Kit for Illumina®. In brief, fresh leaves were fixed with formaldehyde and lysed, and then, the cross‐linked DNA was digested with MboI. The sticky ends were labelled with biotin and joined adjacently to form a chimeric connection and then physically cut to a size of 300–500 bp.
The Illumina X‐Ten platform was then used for sequencing with pair end reads of 150 bp. The Hi‐C data were aligned to the assembled genome using bowtie2 (Langmead and Salzberg, 2012), and the contact frequency between genomic loci was computed using Juicer v1.5 (Durand et al., 2016a) with a window size of 100 kb. The interaction heatmap of the contact frequency matrix was visualized using Juicebox v1.5 (Durand et al., 2016b).
BUSCO was used to assess the integrity of genome assembly and gene annotation (Simão et al., 2015). The ‘Embryophyta_odb9’ containing 1,440 single‐copy orthologous genes was used as the search dataset, and the pak choi, published Chinese cabbage and yellow sarson genomes were also evaluated.
Generation of Illumina RNA‐seq data and transcriptome analyses
RNA‐seq data were generated using the leaves of two pak choi, two Chinese cabbage and one yellow sarson plant at up to six stages: 1.5, 10, 20, 41, 79 and 96 days after sowing (DAS). The whole plant of 1.5 DAS seedlings was used for analysis. For plants of 10 and 20 DAS, the second leaves were used, while for 41, 79 and 96 DAS plants, mixtures of the sixth to eighth leaves from outside were used. Each experiment was repeated independently at least three times unless stated otherwise. RNA‐seq libraries prepared using the Illumina mRNA‐seq Library Preparation kit and sequenced on the Illumina HiSeq 2000 platform with 100 paired‐end reads sequencing.
NGS QC Toolkit v2.3.3 (Patel and Jain, 2012) was used to discard pair end reads containing adapters, poly‐N or low‐quality bases (PHRED‐like score < 20) exceeding 20 %. Remaining reads were mapped to the genome using HISAT v2.0.4 (Kim et al., 2015) with default settings. StringTie was used to reconstruct the transcripts guided by the genomic annotation information (Mihaela et al., 2015). Novel transcripts were identified using Cuffcompare (a tool of Cufflinks) (Trapnell et al., 2010). The coding ability of new transcripts was predicted by Coding Potential Calculator (Kong et al., 2007). We then used Bowtie2 (Langmead and Salzberg, 2012) to align clean reads to the reference genome and then used RSEM (RNA‐seq by expectation‐maximization) to calculate gene expression levels (Li and Dewey, 2011). DEseq2 version: 1.22.2 (Love et al., 2014) was used to identify differentially expressed genes (DEGs) with a fold change of ≥2 and adjusted P‐value of ≤0.05. Gene ontology (GO) class enrichment was carried out using GOseq software (Young et al., 2010) according to the Wallenius non‐central hyper‐geometric distribution method.
The relative quantitative analysis of BrMAF4 expression normalized using the GAPDH gene was performed using Light cycler version 2.0 software (Livak and Schmittgen, 2001). The BrMAF4 and GAPDH primer pairs were designed using Primer3 software (Table S11).
Repeat annotation
Tandem repeat annotation was carried out using a combination of homologous and de novo predictions. First, RepeatMasker v4.0.9 (http://www.repeatmasker.org/) (Tarailograovac and Chen, 2004) was used to identify well‐characterized transposable elements (TEs) at the DNA and protein level using RepBase (http://www.girinst.org/repbase) as the query library (Jurka et al., 2005). A de novo repeat library was constructed using Repeatmodeler v1.0.11 (http://www.repeatmasker.org/RepeatModeler/) and LTR_FINDER (Xu and Wang, 2007) with default parameters. Using the de novo repeat library as a query, novel TEs were then identified using RepeatMasker.
Centromeric repeat sequences of pak choi genome, including those of CentBr, CRB, TR238 and PCRBr (Koo et al., 2011; Lim et al., 2007), were identified by using BLAST. Based on the distribution of these elements, centromere regions were located in each chromosome of assembly.
Non‐coding RNA annotation
tRNAscan‐SE v2.0 (Lowe and Eddy, 1997) was used to identify tRNA sequences using default parameters. The rRNA sequence of B. rapa, B. oleracea, B. napus and Arabidopsis thaliana was selected as reference sequences to identify rRNA using BLASTN. miRNA and snRNA genes were also identified using infernal based on covariance models deposited in the Rfam database (release 13.0) (http://rfam.xfam.org/).
Gene prediction and functional annotation
Augustus (version 2.5.5) (Mario et al., 2006) was used to predict coding genes de novo. Protein sequences of closely related Brassicaceae species, including A. thaliana, B. rapa (Chinese cabbage), B. napus and B. oleracea, were downloaded from Ensembl (Flicek et al., 2012) and mapped to the pak choi genome using TBLASTN. RNA‐Seq reads were also mapped to the pak choi assembly using TopHat v2.1.1 (Trapnell et al., 2012) with default parameters to identify exon regions and splice positions. Transcriptome‐based gene structures were then identified using Cufflinks (Trapnell et al., 2012). Finally, MAKER was used to integrate these gene models into a consensus protein‐coding gene set (Campbell et al., 2014). Putative functions of each gene were assigned according to the best BLAST hits in the A. thaliana database, and by searching publicly protein databases including SwissProt, TrEMBL, InterPro and NR. The functional ontology of each gene was retrieved from InterPro using Gene Ontology software (Ashburner et al., 2000). These genes were also mapped to the KEGG pathway in order to identify their best‐matched categories (Kanehisa and Goto, 2000).
Identification of SNPs and indels among pak choi, Chinese cabbage and yellow sarson
Single nucleotide polymorphisms (SNPs) and insertion/deletion polymorphisms (indels, length < 100 bp) were firstly identified using Mummer (Kurtz et al., 2004) by respectively comparing the pak choi genome with that of Chinese cabbage and yellow sarson. The detailed analysis information was followed by published SNPs and indels identification pipeline among two genomes (Sun et al., 2018). Firstly, the pak choi genome was mapped to its corresponding Chinese cabbage sequences with nucmer with the parameters ‘‐mumreference ‐g 1000 ‐c 90 ‐l 40’. Secondly, the delta‐filter was used to filter mapping noise and determine the one‐to‐one alignment blocks with parameters ‘‐r ‐q’. Alignments with aligned positions in one genome that were located more than 10 Mb away in another genome were further filtered. Show‐snps was then used to obtain SNPs and small indels (<100 bp). Chinese cabbage genome‐based SNPs and indels were detected with the parameter ‘‐ClrTH’, and pak choi genome‐based parameters were detected with the parameter ‘‐ClqTH’. Furthermore, all clean Illumina reads of pak choi were mapped to the Chinese cabbage and yellow sarson genome using BWA‐MEM (Li, 2013). The GATK pipeline was then used for variations calling with the default parameters using Illumina reads (McKenna et al., 2010). Only variations detected with both tools were identified as high‐quality variants.
Structural variation analysis among pak choi, Chinese cabbage and yellow sarson
To determine gene structure variation between pak choi and Chinese cabbage, areas 2 kb upstream and downstream of the longest transcript of each pak choi and Chinese cabbage gene were selected then mapped to each genome using BWA‐MEM (Li, 2013).
Based on the published protocol (Sun et al., 2018), genes showing structure variation were clustered into several categories: Genes without amino acid substitutions or with only missense mutations and/or non‐frameshift indels (length = 3n bp) were classed as structurally conserved genes. Genes with complete CDSs but containing SNPs or indels (3 ± 1 nt) that might produce initiation codons, termination codons, premature termination, splicing‐donor‐site or splicing‐acceptor‐site mutations, and ORF frameshifts were classified as genes with large‐effect mutations. The genes with incomplete CDS were classified as large structural variation. The identification of gene structure variation between pak choi and yellow sarson was performed in the same way.
Identification of PAV sequences and PAV genes
A sliding‐window method was used to identify the PAV sequences in pak choi, Chinese cabbage and yellow sarson. To identify pak choi‐specific sequences, the pak choi genome was first divided into 500‐bp overlapping windows with a step size of 100 bp. BWA‐MEM (Li, 2013) was then applied to map each window against the pak choi and Chinese cabbage genomes, with parameter settings of ‐w 500 ‐‐M. The sequences of windows that could not be mapped or that mapped to the Chinese cabbage genome with a primary alignment coverage less than 25% but could be properly mapped to the pak choi genome were defined as pak choi‐specific sequences. Chinese cabbage‐ and yellow sarson‐specific sequences and PAV genes were determined using the same method (Sun et al., 2018). Identification of PAV sequences and PAV genes was carried out using a publicly available perl script (https://github.com/caulai/Mo17_genome_assembly/).
To validate the variations, we further aligned long reads of pak choi to Chinese cabbage and yellow sarson using NGMLR LR mapper, and variants were called using Sniffles with a minimum read depth of 10 (Sedlazeck et al., 2018). We then checked the variations of the heading and flowering‐related genes that we identified.
Comparative genome analysis of pak choi, Chinese cabbage and yellow sarson
Putative orthologous pairs among pak choi, Chinese cabbage and yellow sarson were detected according to the best hit in BLASTp searches with parameter settings of ‐e 1e‐5. The best bidirectional orthologous genes between each two genomes were selected for further analysis. Syntenic gene blocks were then detected using McScan (Tang et al., 2010) with parameter settings of ‐u 10 ‐s 2 ‐k 50 ‐e 10. To verify the overall completeness of the pak choi assembly, the three genomes were then compared using nucmer alignments in the Mummer package (Kurtz et al., 2004), which were subsequently filtered for 1‐on‐1 alignment and rearrangements with parameter settings of ‐l 10000 ‐c 90.
Estimation of divergence time between pak choi and other species
To estimate the divergence time between pak choi and other Brassica species, the Bayesian relaxed molecular‐clock approach was used with MCMCTree, which is part of the PAML package (Yang, 2007). The Markov chain Monte Carlo (MCMC) process was run using the following parameters: burn‐in = 1 000 000, sample number = 1 000 000 and sample frequency = 50. The calibration time of divergence of these plant species was obtained from the TimeTree database (http://www.time.org/) (Hedges and Kumar, 2007) and published reference (Hohmann et al., 2015).
Conflicts of interest
All authors confirm that they have no conflict of interest.
Author contributions
PRL, SCY and FLZ conceived and designed the study. PRL led the sequencing and data analysis and wrote the manuscript together with DE. TBS performed transcriptome analysis. XYZ provided the sequencing material. WHW, YJY, DSZ and PEB provided comments relating to the manuscript. DE revised the manuscript. All authors read and approved the final manuscript.
Supporting information
Figure S1 Hi‐C interaction heatmap of the pak choi genome.
Figure S2 KmerFreq‐AR analysis of pak choi genome size.
Figure S3 Distribution of centromeric repeats in pak choi genome.
Figure S4 Length distribution of PAV sequences in the Chinese cabbage, yellow sarson and pak choi genomes.
Figure S5 The IGV alignments of centromeric regions using pak choi long reads.
Figure S6 Identification of structural variants of the eight remaining heading genes.
Figure S7 Phylogenies of the KAN genes from A. thaliana and B. rapa annotations.
Figure S8 Identification of structural variants of the 12 remaining flowering genes.
Figure S9 Alignment of BrMAF4‐annotated protein sequences between the pak choi and yellow sarson genomes.
Figure S10 The pak choi phenotype (ZYCX).
Table S1 Assembly statistics of each chromosome in the pak choi (subsp. chinensis) genome.
Table S2 Statistics of genome completeness in the three B. rapa genome assemblies according to BUSCO.
Table S3 Statistics of repetitive sequences in the pak choi (subsp. chinensis) genome.
Table S4 Statistics of centromere information on pak choi chromosomes.
Table S5 Summary of non‐coding RNA (ncRNA) genes in the pak choi (subsp. chinensis) genome.
Table S6 Statistics of gene annotation completeness in the three B. rapa genome assemblies according to BUSCO.
Table S10 SV and PAV genes related to flowering in the pak choi and yellow sarson genomes.
Table S11 Primers used for qRT‐PCR assays.
Table S7 Pak choi genes with large‐effect mutations compared with the Chinese cabbage and yellow sarson genomes.
Table S8 Pak choi genes with large structure variations compared with the Chinese cabbage and yellow sarson genomes.
Table S9 Summary of PAV genes in the Chinese cabbage, yellow sarson and pak choi genomes.
Acknowledgements
This research was supported by the Collaborative Innovation Center of BAAFS (KJCX201907‐2), the Scientist Training Program of BAAFS (JKZX201906), the National Natural Science Foundation of China (No. 31801852), the Key Program of Beijing Municipal Science and Technology Committee (Z191100004019010) and the earmarked fund for China Agriculture Research System (CARS‐23‐A‐05).
Li, P. , Su, T. , Zhao, X. , Wang, W. , Zhang, D. , Yu, Y. , Bayer, P. E. , Edwards, D. , Yu, S. and Zhang, F. (2021) Assembly of the non‐heading pak choi genome and comparison with the genomes of heading Chinese cabbage and the oilseed yellow sarson. Plant Biotechnol. J, 10.1111/pbi.13522
Contributor Information
David Edwards, Email: Dave.Edwards@uwa.edu.au.
Shuancang Yu, Email: yushuancang@nercv.org.
Fenglan Zhang, Email: zhangfenglan@nercv.org.
Data availability statement
The genome sequence and annotation file of pak choi are available at SAMN12996754. All raw sequencing data of the genome and transcriptome are available at NCBI under accession number PRJNA576336.
References
- Aaron, S. and Mark, E. (2009) Recent advances and emerging trends in plant hormone signalling. Nature, 459, 1071–1078. [DOI] [PubMed] [Google Scholar]
- Allen, G.C. , Flores‐Vergara, M.A. , Krasynanski, S. , Kumar, S. and Thompson, W.F. (2006) A modified protocol for rapid DNA isolation from plant tissues using cetyltrimethylammonium bromide. Nat. Protoc. 1, 2320–2325. [DOI] [PubMed] [Google Scholar]
- Ashburner, M. , Ball, C.A. , Blake, J.A. , Botstein, D. , Butler, H. , Cherry, J.M. , Davis, A.P. et al. (2000) Gene ontology: tool for the unification of biology. The Gene Ontology Consortium. Nat. Genet. 25, 25–29. [DOI] [PMC free article] [PubMed] [Google Scholar]
- Bayer, P.E. , Golicz, A.A. , Tirnaz, S. , Chan, C.K.K. , Edwards, D. and Batley, J. (2018) Variation in abundance of predicted resistance genes in the Brassica oleracea pangenome. Plant Biotechnol. J. 17, 789–800. [DOI] [PMC free article] [PubMed] [Google Scholar]
- Bayer, P.E. , Hurgobin, B. , Golicz, A.A. , Chan, C.K.K. , Yuan, Y. , Lee, H.T. , Renton, M. et al. (2017) Assembly and comparison of two closely related Brassica napus genomes. Plant Biotechnol. J. 15, 1602–1610. [DOI] [PMC free article] [PubMed] [Google Scholar]
- Belser, C. , Istace, B. , Denis, E. , Dubarry, M. , Baurens, F.C. , Falentin, C. , Genete, M. et al. (2018) Chromosome‐scale assemblies of plant genomes using nanopore long reads and optical maps. Nat. Plants, 4, 879–887. [DOI] [PubMed] [Google Scholar]
- Bonnema, G. , Carpio, D.P.D. and Zhao, J.J. (2011) Diversity analysis and molecular taxonomy of Brassica vegetable crops, pp. 81–124. New York: CRC Press. [Google Scholar]
- Campbell, M.S. , Holt, C. , Moore, B. and Yandell, M. (2014) Genome annotation and curation using MAKER and MAKER‐P. Curr. Protoc. Bioinform. 48, 4.11.1–4.11.39. [DOI] [PMC free article] [PubMed] [Google Scholar]
- Chalhoub, B. , Denoeud, F. , Liu, S. , Parkin, I.A. , Tang, H. , Wang, X. , Chiquet, J. et al. (2014) Early allopolyploid evolution in the post‐Neolithic Brassica napus oilseed genome. Science, 345, 950–953. [DOI] [PubMed] [Google Scholar]
- Cheng, F. , Sun, R. , Hou, X. , Zheng, H. , Zhang, F. , Zhang, Y. , Liu, B. et al. (2016) Subgenome parallel selection is associated with morphotype diversification and convergent crop domestication in Brassica rapa and Brassica oleracea . Nat. Genet. 48, 1218–1224. [DOI] [PubMed] [Google Scholar]
- Cheng, F. , Wu, J. , Fang, L. and Wang, X. (2012) Syntenic gene analysis between Brassica rapa and other Brassicaceae species. Front. Plant Sci. 3, 198. [DOI] [PMC free article] [PubMed] [Google Scholar]
- Chin, C.S. , Peluso, P. , Sedlazeck, F.J. , Nattestad, M. , Concepcion, G.T. , Clum, A. , Dunn, C. et al. (2016) Phased diploid genome assembly with single‐molecule real‐time sequencing. Nat. Methods, 13, 1050–1054. [DOI] [PMC free article] [PubMed] [Google Scholar]
- Dechaine, J.M. , Brock, M.T. and Weinig, C. (2014) QTL architecture of reproductive fitness characters in Brassica rapa . BMC Plant Biol. 14, 66. [DOI] [PMC free article] [PubMed] [Google Scholar]
- Durand, N.C. , Robinson, J.T. , Shamim, M.S. , Machol, I. , Mesirov, J.P. , Lander, E.S. and Aiden, E.L. (2016b) Juicebox provides a visualization system for Hi‐C contact maps with unlimited zoom. Cell Syst. 3, 99–101. [DOI] [PMC free article] [PubMed] [Google Scholar]
- Durand, N. , Shamim, S. , Machol, I. , Rao, S. , Huntley, M.H. , Lander, E. and Aiden, E.L. (2016a) Juicer provides a one‐click system for analyzing loop‐resolution Hi‐C experiments. Cell Syst. 3, 95–98. [DOI] [PMC free article] [PubMed] [Google Scholar]
- Flicek, P. , Amode, M.R. , Barrell, D. , Beal, K. , Brent, S. , Carvalhosilva, D. , Clapham, P. et al. (2012) Ensembl 2012. Nucleic Acids Res. 40, D84–D90. [DOI] [PMC free article] [PubMed] [Google Scholar]
- Golicz, A.A. , Bayer, P.E. , Barker, G.C. , Edger, P.P. , Kim, H. , Martinez, P.A. , Chan, C.K. et al. (2016) The pangenome of an agronomically important crop plant Brassica oleracea . Nat. Commun. 7, 13390. [DOI] [PMC free article] [PubMed] [Google Scholar]
- Hedges, S. and Kumar, S. (2007) TimeTree: A public knowledge‐base of divergence times among organisms. Bioinformatics, 22, 2971–2972. [DOI] [PubMed] [Google Scholar]
- Hohmann, N. , Wolf, E. , Lysak, M. and Koch, M. (2015) A time‐calibrated road map of Brassicaceae species radiation and evolutionary history. Plant Cell, 27, 2770–2784. [DOI] [PMC free article] [PubMed] [Google Scholar]
- Huang, T. , Harrar, Y. , Lin, C. , Reinhart, B. , Newell, N. , Talavera‐Rauh, F. , Hokin, S. et al. (2014) Arabidopsis KANADI1 acts as a transcriptional repressor by interacting with a specific cis‐element and regulates auxin biosynthesis, transport, and signaling in opposition to HD‐ZIPIII Factors. Plant Cell, 26, 246–262. [DOI] [PMC free article] [PubMed] [Google Scholar]
- Husbands, A.Y. , Chitwood, D.H. , Yevgeniy, P. and Timmermans, M.C.P. (2009) Signals and prepatterns: new insights into organ polarity in plants. Genes Dev. 23, 1986–1997. [DOI] [PMC free article] [PubMed] [Google Scholar]
- Jurka, J. , Kapitonov, V.V. , Pavlicek, A. , Klonowski, P. , Kohany, O. and Walichiewicz, J. (2005) Repbase Update, a database of eukaryotic repetitive elements. Cytogenetic Genome Res. 110, 462–467. [DOI] [PubMed] [Google Scholar]
- Kanehisa, M. and Goto, S. (2000) KEGG: Kyoto encyclopedia of genes and genomes. Nucleic Acids Res. 28, 27–30. [DOI] [PMC free article] [PubMed] [Google Scholar]
- Kidner, C. and Timmermans, M.J. (2007) Mixing and matching pathways in leaf polarity. Curr. Opin. Plant Biol. 10, 13–20. [DOI] [PubMed] [Google Scholar]
- Kim, D. , Langmead, B. and Salzberg, S.L. (2015) HISAT: a fast spliced aligner with low memory requirements. Nat. Methods, 12, 357–360. [DOI] [PMC free article] [PubMed] [Google Scholar]
- Kong, L. , Zhang, Y. , Ye, Z.Q. , Liu, X. , Zhao, S.Q. , Wei, L. and Gao, G. (2007) CPC: assess the protein‐coding potential of transcripts using sequence features and support vector machine. Nucleic Acids Res. 35, W345–349. [DOI] [PMC free article] [PubMed] [Google Scholar]
- Koo, D.H. , Hong, C.P. , Batley, J. , Chung, Y.S. , Edwards, D. , Bang, J.W. , Hur, Y. et al. (2011) Rapid divergence of repetitive DNAs in Brassica relatives. Genomics, 97, 173–185. [DOI] [PubMed] [Google Scholar]
- Koren, S. , Walenz, B.P. , Berlin, K. , Miller, J.R. , Bergman, N.H. and Phillippy, A.M. (2017) Canu: scalable and accurate long‐read assembly via adaptive k‐mer weighting and repeat separation. Genome Res. 27, 722–736. [DOI] [PMC free article] [PubMed] [Google Scholar]
- Kurtz, S. , Phillippy, A. , Delcher, A.L. , Smoot, M. , Shumway, M. , Antonescu, C. and Salzberg, S.L. (2004) Versatile and open software for comparing large genomes. Genome Biol. 5, R12. [DOI] [PMC free article] [PubMed] [Google Scholar]
- Langmead, B. and Salzberg, S.L. (2012) Fast gapped‐read alignment with Bowtie 2. Nat. Methods, 9, 357–359. [DOI] [PMC free article] [PubMed] [Google Scholar]
- Li, H. (2013) Aligning sequence reads, clone sequences and assembly contigs with BWA‐MEM. arXiv 1303.3997v2, [q‐bio.GN]. [Google Scholar]
- Li, B. and Dewey, C. (2011) RSEM: accurate transcript quantification from RNA‐Seq data with or without a reference genome. BMC Bioinform. 12(1), 323. [DOI] [PMC free article] [PubMed] [Google Scholar]
- Li, P. , Zhang, S. , Li, F. , Zhang, S. , Zhang, H. , Wang, X. , Sun, R. et al. (2017) Phylogenetic analysis of chloroplast genomes elucidates the relationships of the six economically important Brassica species comprising the triangle of U. Front Plant Sci. 8(54), 111. [DOI] [PMC free article] [PubMed] [Google Scholar]
- Lim, K.B. , Yang, T.J. , Hwang, Y.J. , Kim, J.S. , Park, J.Y. , Kwon, S.J. , Kim, J. et al. (2007) Characterization of the centromere and peri‐centromere retrotransposons in Brassica rapa and their distribution in related Brassica species. Plant J. Cell Mol. Biol. 49, 173–183. [DOI] [PubMed] [Google Scholar]
- Liu, S. , Liu, Y. , Yang, X. , Tong, C. , Edwards, D. , Parkin, I.A. , Zhao, M. et al. (2014) The Brassica oleracea genome reveals the asymmetrical evolution of polyploid genomes. Nat. Commun. 5, 3930. [DOI] [PMC free article] [PubMed] [Google Scholar]
- Livak, K. and Schmittgen, T. (2001) Analysis of relative gene expression data using real‐time quantitative PCR and the 2‐△△Ct method. Methods (San Diego, Calif.), 25(4), 402. [DOI] [PubMed] [Google Scholar]
- Love, M.I. , Wolfgang, H. and Simon, A. (2014) Moderated estimation of fold change and dispersion for RNA‐seq data with DESeq2. Genome Biol. 15, 550. [DOI] [PMC free article] [PubMed] [Google Scholar]
- Lowe, T.M. and Eddy, S.R. (1997) tRNAscan‐SE: a program for improved detection of transfer RNA genes in genomic sequence. Nucleic Acids Res. 25, 955–964. [DOI] [PMC free article] [PubMed] [Google Scholar]
- Mario, S. , Oliver, K. , Irfan, G. , Alec, H. , Stephan, W. and Burkhard, M. (2006) AUGUSTUS: ab initio prediction of alternative transcripts. Nucleic Acids Res. 34(Web, Server):W435–W439. [DOI] [PMC free article] [PubMed] [Google Scholar]
- Maumus, F. and Quesneville, H. (2016) Impact and insights from ancient repetitive elements in plant genomes. Curr. Opin. Plant Biol. 30, 41–46. [DOI] [PubMed] [Google Scholar]
- McKenna, A. , Hanna, M. , Banks, E. , Sivachenko, A. , Cibulskis, K. , Kernytsky, A. , Garimella, K. et al. (2010) The Genome Analysis Toolkit: a MapReduce framework for analyzing next‐generation DNA sequencing data. Genome Res. 20, 1297–1303. [DOI] [PMC free article] [PubMed] [Google Scholar]
- Mihaela, P. , Pertea, G.M. , Antonescu, C.M. , Tsung‐Cheng, C. , Mendell, J.T. and Salzberg, S.L. (2015) StringTie enables improved reconstruction of a transcriptome from RNA‐seq reads. Nat. Biotechnol. 33, 290–295. [DOI] [PMC free article] [PubMed] [Google Scholar]
- Nagaharu, U. (1935) Genome analysis in Brassica with special reference to the experimental formation of B. napus and peculiar mode of fertilization. Jpn. J. Bot. 7, 389–452. [Google Scholar]
- Patel, R.K. and Jain, M. (2012) NGS QC Toolkit: a toolkit for quality control of next generation sequencing data. PLoS One, 7, e30619. [DOI] [PMC free article] [PubMed] [Google Scholar]
- Peace, C.P. (2017) DNA‐informed breeding of rosaceous crops: promises, progress and prospects. Hortic. Res. 4, 17006. [DOI] [PMC free article] [PubMed] [Google Scholar]
- Pekker, I. , Alvarez, J. and Eshed, Y. (2005) Auxin response factors mediate Arabidopsis organ asymmetry via modulation of KANADI activity. Plant Cell, 17, 2899–2910. [DOI] [PMC free article] [PubMed] [Google Scholar]
- Pendleton, M. , Sebra, R. , Pang, A.W.C. , Ummat, A. , Franzen, O. , Rausch, T. , Stütz, A.M. et al. (2015) Assembly and diploid architecture of an individual human genome via single‐molecule technologies. Nat. Methods, 12, 780–786. [DOI] [PMC free article] [PubMed] [Google Scholar]
- Qi, X. , An, H. , Ragsdale, A.P. , Hall, T.E. , Gutenkunst, R.N. , Pires, J.S. and Barker, M. (2017) Genomic inferences of domestication events are corroborated by written records in Brassica rapa . Mol. Ecol. 26, 3373–3388. [DOI] [PubMed] [Google Scholar]
- Sedlazeck, F.J. , Rescheneder, P. , Smolka, M. , Fang, H. , Nattestad, M. , Haeseler, A. and Schatz, M.C. (2018) Accurate detection of complex structural variations using single‐molecule sequencing. Nat. Methods, 15, 461–468. [DOI] [PMC free article] [PubMed] [Google Scholar]
- Shen, L. , Thong, Z. , Gong, X. , Shen, Q. , Gan, Y. and Yu, H. (2014) The putative PRC1 RING‐finger protein AtRING1A regulates flowering through repressing MADS AFFECTING FLOWERING genes in Arabidopsis . Development, 141, 1303–1312. [DOI] [PubMed] [Google Scholar]
- Simão, F.A. , Waterhouse, R.M. , Ioannidis, P. , Kriventseva, E.V. and Zdobnov, E.M. (2015) BUSCO: assessing genome assembly and annotation completeness with single‐copy orthologs. Bioinformatics, 31, 3210–3212. [DOI] [PubMed] [Google Scholar]
- Stamm, P. and Kumar, P.P. (2010) The phytohormone signal network regulating elongation growth during shade avoidance. J. Exp. Bot. 61, 2889–2903. [DOI] [PubMed] [Google Scholar]
- Su, T. , Wang, W. , Li, P. , Zhang, B. , Li, P. , Xin, X. , Sun, H. et al. (2018) A genomic variation map provides insights into the genetic basis of spring Chinese cabbage (Brassica rapa L. ssp. pekinensis) selection. Mol. Plant, 11, 1360–1376. [DOI] [PubMed] [Google Scholar]
- Sun, D. , Wang, C. , Zhang, X. , Zhang, W. , Jiang, H. , Yao, X. , Liu, L. et al. (2019) Draft genome sequence of cauliflower (Brassica oleracea L. var. botrytis) provides new insights into the C genome in Brassica species. Hortic. Res. 6, 82–92. [DOI] [PMC free article] [PubMed] [Google Scholar]
- Sun, S. , Zhou, Y. , Chen, J. , Shi, J. , Zhao, H. , Zhao, H. , Song, W. et al. (2018) Extensive intraspecific gene order and gene structural variations between Mo17 and other maize genomes. Nat. Genet. 50, 1289–1295. [DOI] [PubMed] [Google Scholar]
- Tang, H. , Bowers, J.E. , Wang, X. and Paterson, A.H. (2010) Angiosperm genome comparisons reveal early polyploidy in the monocot lineage. Proc. Natl. Acad. Sci. USA, 107, 472–477. [DOI] [PMC free article] [PubMed] [Google Scholar]
- Tarailograovac, M. and Chen, N. (2004) Using RepeatMasker to identify repetitive elements in genomic sequences. Curr. Protoc. Bioinform. 4, 4–10. [DOI] [PubMed] [Google Scholar]
- Trapnell, C. , Roberts, A. , Goff, L. , Pertea, G. , Kim, D. , Kelley, D.R. , Pimentel, H. et al. (2012) Differential gene and transcript expression analysis of RNA‐seq experiments with TopHat and Cufflinks. Nat. Protoc. 7, 562–578. [DOI] [PMC free article] [PubMed] [Google Scholar]
- Trapnell, C. , Williams, B.A. , Pertea, G. , Mortazavi, A. , Kwan, G. , Van Baren, M.J. , Salzberg, S.L. et al. (2010) Transcript assembly and quantification by RNA‐Seq reveals unannotated transcripts and isoform switching during cell differentiation. Nat. Biotechnol. 28, 511–515. [DOI] [PMC free article] [PubMed] [Google Scholar]
- Wang, X. and Kole, C. (2015) The Brassica rapa Genome. Economic/Academic Importance of Brassica rapa , pp. 1–15. New York: Springer. [Google Scholar]
- Wang, X. , Wang, H. , Wang, J. , Sun, R. , Wu, J. , Liu, S. , Bai, Y. et al. (2014) The genome of the mesopolyploid crop species Brassica rapa . Nat. Genet. 43, 1035–1039. [DOI] [PubMed] [Google Scholar]
- Wu, J. , Wei, K. , Cheng, F. , Li, S. , Wang, Q. , Zhao, J. , Bonnema, G. et al. (2012) A naturally occurring InDel variation in BraA.FLC.b (BrFLC2) associated with flowering time variation in Brassica rapa . BMC Plant Biol. 12, 151. [DOI] [PMC free article] [PubMed] [Google Scholar]
- Xiao, D. , Wang, H.G. , Basnet, R. , Zhao, J.J. , Lin, K. , Hou, X.L. and Bonnema, G. (2014) Genetic dissection of leaf development in Brassica rapa using a genetical genomics approach. Plant Physiol. 164, 1309–1325. [DOI] [PMC free article] [PubMed] [Google Scholar]
- Xiao, D. , Zhao, J.J. , Hou, X.L. , Basnet, R.K. , Carpio, D.P.D. , Zhang, N.W. , Bucher, J. et al. (2013) The Brassica rapa FLC homologue FLC2 is a key regulator of flowering time, identified through transcriptional co‐expression networks. J. Exp. Bot. 64, 4503–4516. [DOI] [PMC free article] [PubMed] [Google Scholar]
- Xu, Z. and Wang, H. (2007) LTR_FINDER: an efficient tool for the prediction of full‐length LTR retrotransposons. Nucleic Acids Res. 35, W265–W268. [DOI] [PMC free article] [PubMed] [Google Scholar]
- Yang, Z. (2007) PAML 4: Phylogenetic analysis by maximum likelihood. Mol. Biol. Evol. 24, 1586–1591. [DOI] [PubMed] [Google Scholar]
- Yang, J. , Liu, D. , Wang, X. , Ji, C. , Cheng, F. , Liu, B. , Hu, Z. et al. (2016) The genome sequence of allopolyploid Brassica juncea and analysis of differential homoeolog gene expression influencing selection. Nat. Genet. 48, 1225–1232. [DOI] [PubMed] [Google Scholar]
- Young, M.D. , Wakefield, M.J. , Smyth, G.K. and Oshlack, A. (2010) Gene ontology analysis for RNA‐seq: accounting for selection bias. Genome Biol. 11, 1–12. [DOI] [PMC free article] [PubMed] [Google Scholar]
- Zhang, L. , Cai, X. , Wu, J. , Liu, M. , Grob, S. , Cheng, F. , Liang, J. et al. (2018) Improved Brassica rapa reference genome by single‐molecule sequencing and chromosome conformation capture technologies. Hortic. Res. 5, 50–60. [DOI] [PMC free article] [PubMed] [Google Scholar]
- Zhang, L. , Hu, J. , Han, X. , Li, J. , Gao, Y. , Richards, C.M. , Zhang, C. et al. (2019) A high‐quality apple genome assembly reveals the association of a retrotransposon and red fruit colour. Nat. Commun. 10, 1494–1506. [DOI] [PMC free article] [PubMed] [Google Scholar]
Associated Data
This section collects any data citations, data availability statements, or supplementary materials included in this article.
Supplementary Materials
Figure S1 Hi‐C interaction heatmap of the pak choi genome.
Figure S2 KmerFreq‐AR analysis of pak choi genome size.
Figure S3 Distribution of centromeric repeats in pak choi genome.
Figure S4 Length distribution of PAV sequences in the Chinese cabbage, yellow sarson and pak choi genomes.
Figure S5 The IGV alignments of centromeric regions using pak choi long reads.
Figure S6 Identification of structural variants of the eight remaining heading genes.
Figure S7 Phylogenies of the KAN genes from A. thaliana and B. rapa annotations.
Figure S8 Identification of structural variants of the 12 remaining flowering genes.
Figure S9 Alignment of BrMAF4‐annotated protein sequences between the pak choi and yellow sarson genomes.
Figure S10 The pak choi phenotype (ZYCX).
Table S1 Assembly statistics of each chromosome in the pak choi (subsp. chinensis) genome.
Table S2 Statistics of genome completeness in the three B. rapa genome assemblies according to BUSCO.
Table S3 Statistics of repetitive sequences in the pak choi (subsp. chinensis) genome.
Table S4 Statistics of centromere information on pak choi chromosomes.
Table S5 Summary of non‐coding RNA (ncRNA) genes in the pak choi (subsp. chinensis) genome.
Table S6 Statistics of gene annotation completeness in the three B. rapa genome assemblies according to BUSCO.
Table S10 SV and PAV genes related to flowering in the pak choi and yellow sarson genomes.
Table S11 Primers used for qRT‐PCR assays.
Table S7 Pak choi genes with large‐effect mutations compared with the Chinese cabbage and yellow sarson genomes.
Table S8 Pak choi genes with large structure variations compared with the Chinese cabbage and yellow sarson genomes.
Table S9 Summary of PAV genes in the Chinese cabbage, yellow sarson and pak choi genomes.
Data Availability Statement
The genome sequence and annotation file of pak choi are available at SAMN12996754. All raw sequencing data of the genome and transcriptome are available at NCBI under accession number PRJNA576336.