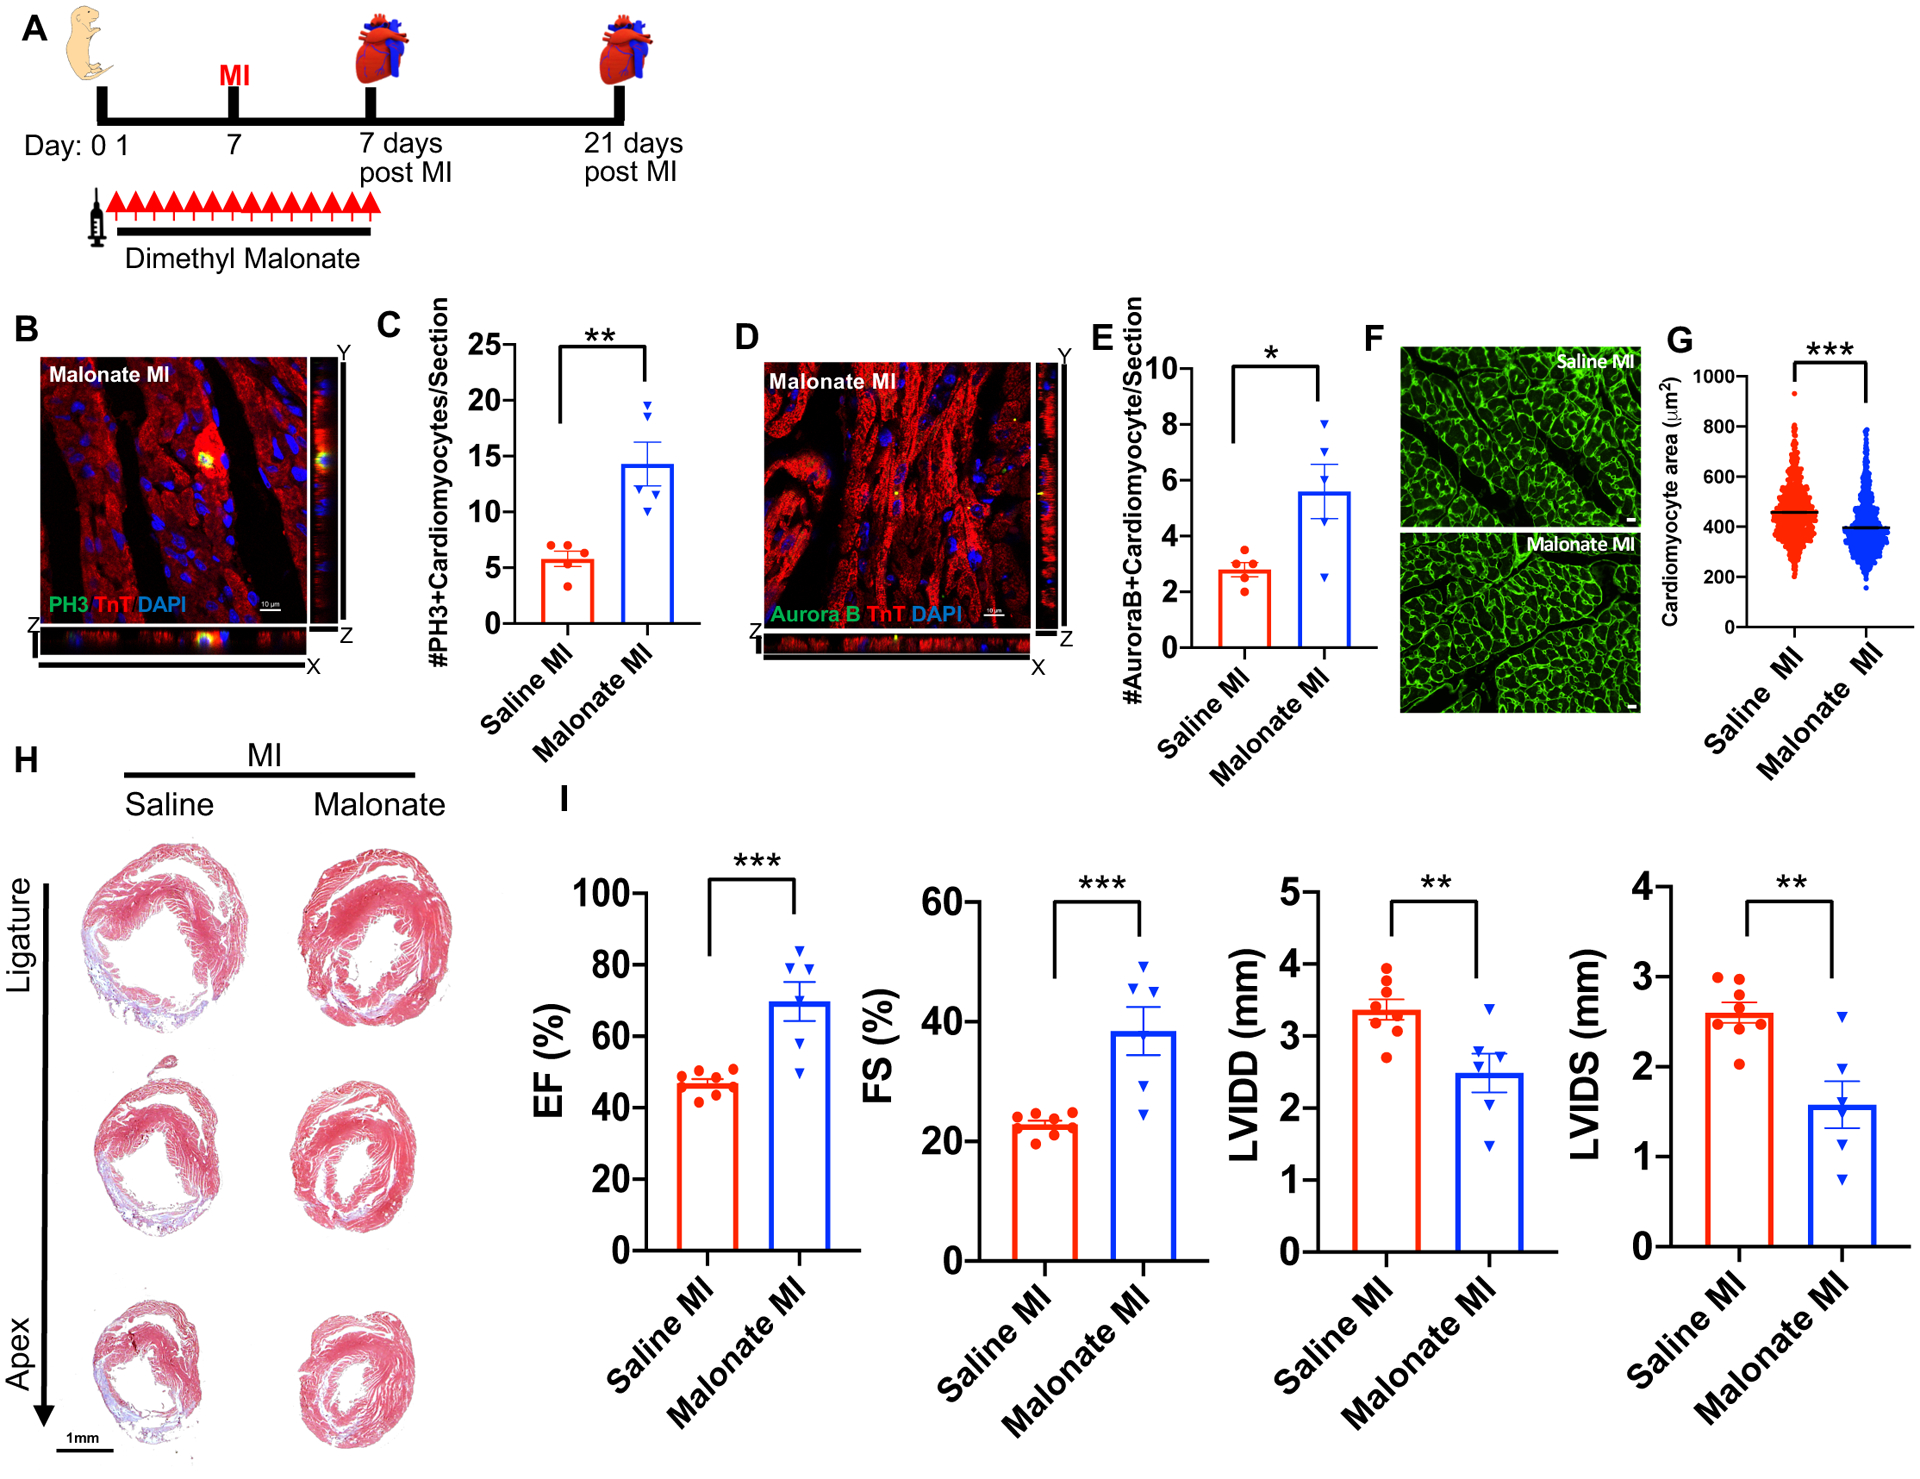
Figure 2. Malonate promotes cardiomyocyte proliferation and heart regeneration in the postnatal heart following MI.

(A) Schematic of dimethyl malonate injection and MI strategy. (B, C) Immunostaining and quantification of pH3 positive cardiomyocytes showing a significant increase in the levels of mitotic myocytes in dimethyl malonate injected hearts at 7 days post-MI compared to controls. Scale bar, 10 μm. (D, E) Immunostaining and quantification of Aurora B positive cardiomyocytes demonstrating a significant increase in myocyte cytokinesis in the dimethyl malonate injected mice. Scale bar, 10 μm. (F, G) Wheat germ agglutinin (WGA) staining and cell size quantification showing decrease in the cardiomyocyte size in malonate injected hearts at 21 days post-MI. Quantitative analyses represent counting of multiple fields from independent samples per group (~ 700 cells per group). Scale bar, 10 μm. (H) Trichrome staining of malonate injected hearts at 21 days post-MI at P7, showing complete regeneration in dimethyl malonate injected mice compared to control. Scale bar, 1 mm. (I) Left ventricular systolic function quantified by EF, FS, LVIDD and LVIDS at 3 weeks post-MI demonstrating functional recovery in dimethyl malonate injected MI hearts compared to the saline injected controls. (n=5–8 mice per group). *P< 0.05, **P<0.005, ***P<0.0001 by two-tailed unpaired Student’s t-test.
