

Abstract
Functional corticomuscular coupling (FCMC) between the brain and muscles has been used for motor function assessment after stroke. Two types, iso-frequency coupling (IFC) and cross-frequency coupling (CFC), are existed in sensory-motor system for healthy people. However, in stroke, only a few studies focused on IFC between electroencephalogram (EEG) and electromyogram (EMG) signals, and no CFC studies have been found. Considering the intrinsic complexity and rhythmicity of the biological system, we first used the wavelet package transformation (WPT) to decompose the EEG and EMG signals into several subsignals with different frequency bands, and then applied transfer entropy (TE) to analyze the IFC and CFC relationship between each pair-wise subsignal. In this study, eight stroke patients and eight healthy people were enrolled. Results showed that both IFC and CFC still existed in stroke patients (EEG → EMG: 1:1, 3:2, 2:1; EMG → EEG: 1:1, 2:1, 2:3, 3:1). Compared with the stroke-unaffected side and healthy controls, the stroke-affected side yielded lower alpha, beta and gamma synchronization (IFC: beta; CFC: alpha, beta and gamma). Further analysis indicated that stroke patients yielded no significant difference of the FCMC between EEG → EMG and EMG → EEG directions. Our study indicated that alpha and beta bands were essential to concentrating and maintaining the motor capacities, and provided a new insight in understanding the propagation and function in the sensory-motor system.
Keywords: Cross-frequency coupling, Functional corticomuscular coupling, Iso-frequency coupling, Stroke
Introduction
Motor dysfunction is a major consequence after stroke (De Oliveira et al. 2020; Rathore et al. 2002) and it is generally believed that the loss of motor ability is caused by impairments in neural network controling movement (Chen et al. 2018). Functional corticomuscular coupling (FCMC) between the motor cortex and the effector muscles, as a neurophysiological measure, has been used for motor function after stroke (Fang et al. 2009; Meng et al. 2009; Mima et al. 2001b). It has been considered as a key to signal transmission between functionally related motor cortex and the effector muscles through direct and indirect pathways (Grosse et al. 2003; Jang and Seo 2014; Van Wijk et al. 2012), resulting the linearity and non-linearity in the motor control system. Previous studies have pointed that the linear relationship can be reflected by iso-frequency coupling (IFC) analysis, while the nonlinearity can be described by both iso-frequency and cross-frequency coupling (CFC) analysis (Ping et al. 2016; Sinha et al. 2019; Xie et al. 2020). However, only a few studies in stroke focused on IFC, and no research on CFC. The underlying mechanisms how the cortical cortex oscillates synchronously with the muscles after stroke remain unknown.
IFC between the motor cortex and muscles presents the synchronization among neural groups at the same frequency. Extensive studies on IFC have indicated that cortical oscillatory are coupled with muscle activation in the alpha band (8–14 Hz) during sustained contractions (Raethjen et al. 2002) and fast transitions between two force targets (Mehrkanoon et al. 2014), the beta band (15–35 Hz) for controlling and maintaining steady-state force output (Baker et al. 1997; Conway et al. 1995b; Gross et al. 2000; Halliday et al. 1998; Mehrkanoon et al. 2014; Salenius et al. 1997a), and the gamma band (35–60 Hz) in relation to stronger muscle force production (Brown et al. 1998; Mima and Hallett, 1999) and dynamic force (Mehrkanoon et al. 2014; Wolfgang et al. 2007). These studies reveal that FCMC with different rhythmic oscillations plays different roles in neural communication and interaction between the central nervous system and the periphery. Similar studies also have been carried out on the stroke patients, since Mima et al. (Mima et al. 2001b) first reported that the FCMC for the hand and forearm muscles was smaller on the affected side of subcortical stroke patients during weak tonic contraction tasks. Fang et al. (Fang et al. 2009), Meng et al. (Meng et al. 2009) and von Carlowitz-Ghori et al. (von Carlowitz-Ghori et al. 2014) also have reported that stroke patients had significant lower FCMC on affected sides during a steady-state force task. Chen et al. (Chen et al. 2019)also found that the strength in both directions was reduced and the gaps between the descending and ascending directions were disappeared over all scales for stroke patients. The decrease in FCMC indicates that the impairment in the lesioned hemisphere possibly leads to the discontinuity of information transmission in the sensory-motor systems (Mima et al. 2001b; Schytz et al. 2010), and it provides a novel perspective in exploring the pathological mechanism of stroke.
CFC, as a way to explore the nonlinear association of multiple frequency neural oscillations, presents the synchronization across different frequency bands and neural systems (Yang et al. 2016d). Five principal CFC types exist in the oscillation system: phase-frequency coupling (PFC), phase-phase coupling (PPC), phase-amplitude coupling (PAC), amplitude-amplitude coupling (AAC) and frequency-frequency coupling (FFC) (Hyafil et al. 2015b; Yang et al. 2016e). Extensive studies have shown that strong CFC exists in multiple brain areas (Hyafil et al. 2015b). For example, Zhang et al. (2019) found that the theta-gamma PAC in the working memory state increased with learning days and was higher than that in free choice state and rest state. Yu et al. (2020) found that the theta-alpha, delta-alpha and delta-beta PPC changed obviously once seizure occurs, and such alteration is earlier than the appearance of clinical symptoms in seizure. However, only a few researches about the application of CFC between the cortical oscillations and external somatosensory input. Yang et al. (2016a) found that FFC between EEG and EMG was detected with both integer (1:2, 1:3, 1:4) and non-integer (2:3) harmonics, and likely relates to sensory pathways. Only a few studies have suggested that CFC plays important roles in various motor control tasks (Tobimatsu et al. 1999; Yang et al. 2016d). Moreover, the clinical relevance of cross-frequency coupling has also been demonstrated (He et al. 2016). Though these previous studies demonstrated the existence of CFC exists between the brain and muscles in the motor system (Yang et al. 2016c), CFC has not been studied in stroke patients. Considering the abnormal mechanism and changes of non-linearity in the brain after stroke, we hypothesized that a changed CFC might also exist in stroke patients.
Above all, the main contribution of this work is to explore the abnormal cortex-muscle FCMC after stroke. To investigate the complex and directional characteristics in a specific band, we used the wavelet package transformation (WPT) to decompose the EEG and EMG signals into several subsignals with different frequency bands, and then applied transfer entropy (TE) to analyze the IFC and CFC relationship between each pair-wise subsignal. This study provides a new insight into the directional characteristics of the FCMC in both iso-frequency and cross-frequency coupling, and might be helpful for understanding the underlying pathological mechanisms after stroke.
Materials and methods
Subjects
Eight stroke patients who had persistent dys-coordination of the left upper limb (Table 1; mean age, 52.6 ± 9.6 years; range, 37–66 years) and eight healthy controls (mean age, 49.4 ± 6.2 years; range, 43–55 years) without any history of neurological disease were enrolled in this study. The participants were tested using the Oldfield questionnaire (Oldfield 1971). The investigation was approved by the ethical review board of Yanshan University. All participants have signed an informed consent form.
Table 1.
Demographic information of stroke patients
| Patients | Age | Months since stroke | STM for affected side | Lesion site | Stroke type |
|---|---|---|---|---|---|
| 1 | 44 | 5 | 8 | R Periventricular | Ischemia |
| 2 | 52 | 15 | 4 | R Temporal lobe, external capsule | Ischemia |
| 3 | 38 | 6 | 6 | L Frontal Lobe, Centrum Semiovale, Periventricular | Ischemia |
| 4 | 55 | 10 | 6 | Pons | Ischemia |
| 5 | 47 | 12 | 8 | R Basal Ganglia | Hemorrhage |
| 6 | 54 | 8 | 9 | Pons | Ischemia |
| 7 | 57 | 13 | 7 | R Basal Ganglia | Hemorrhage |
| 8 | 63 | 11 | 5 | Pons | Hemorrhage |
R right hemisphere, L left hemisphere, STM Shang tian min functional clinical assessment scale that evaluates the motor function of the hemiplegic side, includes 12 levels
Data recording and experimental paradigm
Experiment paradigm
During the experiments, the subjects sat in an electrically shielded and dimly-lit room. All subjects needed to grip a shank which connected to a force sensor in their hands (Fig. 1). For patients, both right and left hands needed to be tested, while for healthy subjects, only the right hand needed to be tested. Visual feedback was provided to the subjects via a monitor with two different colored lines: the red line indicated the target force (TF) and the green line represented the exerted force (EF) by the subjects. The subjects needed to maintain the green line tracking the red line at any moment.
Fig. 1.
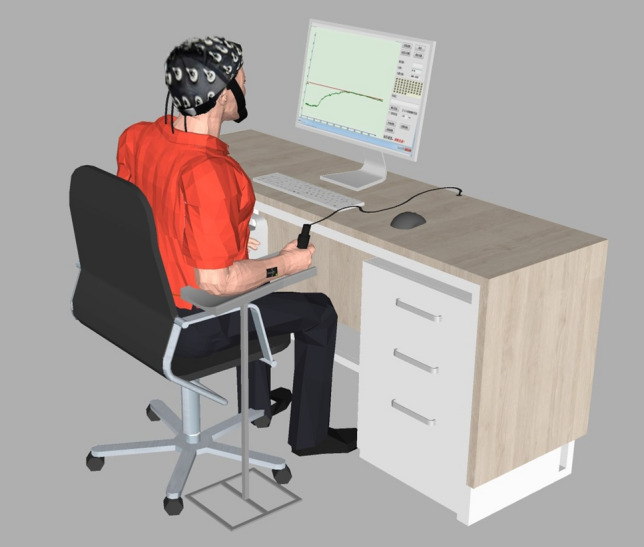
The Synchronous acquisition of the EEG and EMG signals
The subjects were instructed to maintain a weak tonic contraction [20% of maximum voluntary contraction (MVC)]. Before the task, each subject performed an isometric contraction of the grip with maximal effort lasting 5 s for three times and the mean value was calculated. The task was segmented into four sessions of 60 s, with 60 s break between sessions. Within a session, there were 2 s ready, 50 s steady-state force output with 20% and 8 s relax.
Data recording and preprocessing
Scalp EEG and EMG signals were recorded synchronously by 64-channel eego™ sports system and one-channel Trigno™ wireless EMG system. EEG signals were recorded from 32 scalp positions based on the international 10–20 system and EMG signals from the flexor digitorum superficialis (FDS). Before the electrode application, the hair and the skin surface needed to be cleaned. The EEG and EMG signals were amplified (1000), and digitized (1000 Hz).
A combined filter was adapted to remove the interferences in EEG recordings. First, a high-pass filter was used to remove baseline drift. Then, an adaptive notch filter (Nasrolahzadeh et al. 2018; Stoica and Nehorai 1988) was used to remove the 50 Hz power signal and its harmonics. After that, Imformax-based independent component analysis (ICA) was applied to remove EOG signal. Finally, canonical correlation analysis (CCA) (De Clercq et al. 2006) was used to remove the EMG signal from the EEG signal. As for EMG signals, an adaptive notch filter was also used to remove the 50 Hz power signal and its harmonics, and a 0.5–150 Hz bandpass filter was used to remove the direct current high frequency interference. After that, the EMG signals were rectified before subsequent analysis.
Data analysis
The WPT and TE methods were performed for the corticomuscular relationship analysis. The WPT was separately performed on the EEG and EMG signals to obtain several subsignals with different frequency bands. The TE was then applied to obtain the relationship between each pair-wise subsignal.
Wave Package decomposition
The EEG and EMG signals were denoted by series and (, ), respectively. To describe the information transfer in different bands, the WPT method was introduced to decompose the preprocessed and into and resolution levels, respectively, and and equally-wide subspaces in frequency domain can be obtained correspondingly. The subsignal of at the subspace on the level and at the subspace on the level, defined and , can be reconstructed by
| 1 |
| 2 |
where , , . and are WPT coefficients at the subspace on the level and the subspace on the level; and are the wavelet function. If the highest frequency of the signal was and for and , then the width of frequency band at the subspace is between and , and at the subspace is between and .
Transfer Entropy
The central concept of the TE is that the future of a signal Y is better predicted by the observation on the past and present of signal , and is measured by uncertainty reduction via conditional entropy follows (Vicente et al. 2011). The TE from to , termed , can be derived from conditional entropies as follows
| 3 |
where t is a discrete valued time-index and u denotes the prediction time, a discrete valued time-interval; and are m- and n- dimensional delay vectors; is the entropy of the process conditional on its past, and can be calculated as
| 4 |
can be also calculated as
| 5 |
where formula (3) can be rewritten as
| 6 |
The TE from to can be defined as , and is obtained by the same process. In this way, the TE of each pair-wise subsignal was evaluated and further obtained the information transfer across all frequency bands. Statistical significance was computed by comparing with the baseline during relaxed period (So et al. 2016). Additionally, as the algorithm described, the WPT and TE methods can be applied to the IFC and CFC analysis between and signals (Liang et al. 2015). The iso-frequency means that the frequency ratio between and was equal to 1:1.
Statistical analysis
Statistical significance
The surrogate data method by randomizing the phase of the original data obtained was used to test the statistical significance of the TE values (Schreiber and Schmitz 1996). This would destroy the causal interaction but guarantee the same amplitude characteristics between the surrogate data and the original data. The method was performed 10,000 times and the TE values in both directions were calculated, respectively. After that, the mean values across all 10,000 times, named , were calculated. Therefore, if the TE values was larger than the in the same direction, we could conclude there was significant causal interaction.
Statistical area
To quantitatively describe the TE values in specific frequency band (), the EEG frequency was first defined as the standard. The significant area under the TE curve in a specific band, defined as, was calculated by
| 7 |
where the coupling strength was higher if the value was larger. However, the significant area of cross-frequency coupling cannot be measured in the same coordinate at this time, because the two coupled signals are calculated under different frequency conditions. Therefore, the significant area of CFC is defined according to formula (7) based on EEG signals. After that, repeated measures analysis of variance (rANOVA) was performed to investigate the differences between stroke patients and healthy controls based on the significant area.
Results
Analysis of the brain activity
Before statistical analysis, we calculated the TE values for each pairwise EEG-EMG of 32 scalp positions, and averaged across all subjects. Considering that the patients were left hemiplegia and the lesions were basically located in the right brain, we defined the left hand of patients as the stroke-affected side, the right hand as the stroke-unaffected side, and the right hand of healthy people as the control. After that, we plotted the topographic distribution in both directions for affected side, unaffected side and healthy controls, respectively (Fig. 2). The strongest interaction was almost entirely localized in the motor cortex contralateral to the performing hand task. Compared with the unaffected side and healthy controls, the TE values were weaker at the affected side in both directions. Additionally, there was a tendency that the TE value at the affected side was also located in the left motor cortex ipsilateral to the task side. The highest TE values were selected for the subsequent analysis.
Fig. 2.

The topographic distribution where the strongest interaction in both directions for stroke-affected side, stroke-unaffected side and healthy controls, respectively. And the colorbar indicates the level of coherence (red, higher level; blue, lower level)
Iso- and cross-frequency coupling analysis
Figure 3 shows the grand averages of TE values between EEG and EMG in two pathways for all subjects. Comparing the first column [subgraph (A), (C) and (E)] with the second column [subgraph (B), (D) and (F)], we found that the distribution were significantly different among the stroke-affected side, stroke-unaffected side and healthy controls. The distribution of the TE values for stroke-affected side was scattered in a wide frequency range, while that for the others, especially healthy controls, was concentrated in several specific frequencies with certain proportions. We calculated the frequency ratios of EEG frequency to EMG frequency, defined as EEG: EMG, and marked these in Fig. 3. In these subgraphs, the information transmission was mainly from higher frequency EEG to lower frequency EMG in the descending pathway, while from lower frequency EMG to higher frequency EEG in the ascending pathway. Consequently, it seemed to be lower TE values for stroke-affected side than stroke-unaffected side and healthy controls. Additionally, for all subjects, the highest TE mainly focused on the diagonal (1:1), namely between the EEG and EMG at the same frequency band.
Fig. 3.

The grand average of TE values in two directions for stroke-affected side, stroke-unaffected side and healthy controls, respectively. (A) and (B) for the stroke-affected side, (C) and (D) for stroke-unaffected side and (E) and (F) for healthy controls. In all subgraphs, the frequency ratios are calculated from EEG frequency to EMG frequency. The colorbar indicates the level of TE values (red, higher level; blue, lower level)
Significant area analysis
To quantity the differences between the descending and ascending pathways within the iso- frequency and cross-frequency coupling, we calculated the significant area in the specific frequency bands (theta (1–4 Hz), delta (4–8 Hz), alpha (8–15 Hz), beta (15–35 Hz) and gamma (35–60 Hz)) according to the formula (7)). In this study, and in theta-range, and in delta-range, and in alpha-range, and in beta-range, and in gamma-range were all calculated. The WPT and TE methods can describe the FCMC characteristics in more detail if the frequency resolution was small enough. However, since the EEG signal is of frequency band characteristics and the FCMC is mainly dominant at some specific bands with certain bandwidth. Here both and were set as 1 Hz. Considering that the highest frequency of the EEG and EMG signals was at 256 Hz after resampling, which meant that both and were 256 Hz, both i and j should be set to 8, and accordingly 256 () subspaces can be obtained with frequency bands 0 –1 Hz, 1 –2 Hz,, 255 –256 Hz in that order. In each EEG: EMG ratio, three-way repeated measures analysis of variance (rANOVA) was performed with subject (3 levels: stroke-affected side, stroke-unaffected side and healthy controls) as a between-subject factors, direction (2 levels: descending and ascending) and frequency band (5 levels: theta, delta, alpha, beta and gamma) as within-subject factors, and the significant area values as the dependent variable. Greenhouse–geisser was used to correct the degrees of freedom in (rANOVA) analysis. And all analyses were adjusted for multiple comparisons using Bonferroni correction. In this study, an alpha of was considered significant. SPSS 19.0 for windows (SPSS Inc., Chicago, IL, USA) was used for all statistical computations.
Statistical significance for iso-frequency coupling analysis
To further quantitatively analyze the IFC differences among stroke-affected side, stroke-unaffected side and healthy controls, Fig. 4 shows the grand averages of TE values on the diagonal of Fig. 3, and the normalized significant area under the curve in both pathways at five bands (delta, theta, alpha, beta, gamma). As Fig. 4(F) shown, the significant IFC mainly focuses on beta and gamma bands, while little at delta, theta and alpha bands. However, there are significant differences between beta and gamma bands. The significant correlation at beta band was in the descending pathway, while gamma band is in the ascending pathway. Furthermore, the value for stroke-affected side was lower than that for stroke-unaffected side (F(1,14) = 6.075, p = 0.005, Bonferroni) and healthy controls (F(1,14) = 8.473, p = 0.002, Bonferroni) at beta band. On the contrary, the value for stroke-affected side was stronger than that for stroke-unaffected side (F(1,14) = 5.492, p = 0.014, Bonferroni)and healthy controls (F(1,14) = 11.427, p = 0.006, Bonferroni) at gamma band.
Fig. 4.

Comparison of the grand average of values for stroke-affected side, stroke-unaffected side and healthy controls in both pathways. (A)–(F) show the statistical results for theta, delta, alpha, beta band and gamma bands. F shows the grand averages of TE values on the diagonal of Fig. 3
To analyze the directional differences in iso-frequency coupling among stroke-affected side, stroke-unaffected side and healthy controls, Fig. 5 shows the TE grand averages in both directions. The results showed that the areas in descending pathway were higher than that in the opposition at the delta (F(1,14) = 4.375, p = 0.012, Bonferroni) and beta (F(1,14) = 3.094, p = 0.025, Bonferroni) bands for healthy controls. Similarly, the significant areas in descending pathway were higher than that in ascending pathway at the beta (F(1,14) = 3.482, p = 0.031, Bonferroni) band for stroke-unaffected side. However, no significant difference exists in two pathways for stroke-affected side.
Fig. 5.

Statistical analysis of the grand average of at different bands between descending and ascending pathways for stroke-affected side, stroke-unaffected side and healthy controls, respectively
Statistical significance for cross-frequency coupling analysis
To further quantitatively analyze the CFC differences among stroke-affected side, stroke-unaffected side and healthy control, Fig. 6 shows the significant area of TE values at special frequency bands with different ratios in two pathways. The results showed that the significant CFC mainly focused on the alpha, beta and gamma bands, while little at delta and theta bands. However, there are significant differences at alpha, beta and gamma bands with different ratios. Figure 6 (A), (D) show significant differences between alpha and gamma bands with the ratio at 3:2 in two directions. The significant area values of stroke-affected side were smaller than that all of the healthy controls (EEG → EMG at alpha: F(1,14) = 3.361, p = 0.026; EMG → EEG at alpha: F(1,14) = 2.255, p = 0.019; EEG → EMG at gamma: F(1,14) = 7.621, p = 0.007; EMG → EEG at gamma: F(1,14) = 3.042, p = 0.015, Bonferroni) and stroke-unaffected side (EEG → EMG at alpha: F(1,14) = 1.209, p = 0.041; EMG → EEG at alpha: F(1,14) = 2.041, p = 0.037; EEG → EMG at gamma: F(1,14) = 5.436, p = 0.009; EMG → EEG at gamma: F(1,14) = 2.417, p = 0.018, Bonferroni). Additionally, Fig. 6(B) and (E) also show significant differences at alpha (affected vs. unaffected: F(1,14) = 2.143, p = 0.031; unaffected vs. healthy: F(1,14) = 7.452, p = 0.002; affected vs. healthy: F(1,14) = 8.082, p = 0.001; Bonferroni), beta (affected vs. unaffected: F(1,14) = 6.351, p = 0.005; affected vs. healthy: F(1,14) = 7.132, p = 0.003; Bonferroni) and gamma (affected vs. unaffected: F(1,14) = 5.735, p = 0.004,; affected vs. healthy: F(1,14) = 8.058, p = 0.002; Bonferroni) with ratio at 2:1 in EEG → EMG direction. However, only at alpha band is in the opposition (affected vs. unaffected: F(1,14) = 2.143, p = 0.002; unaffected vs. healthy: F(1,14) = 7.452, p = 0.031; affected vs. healthy: F(1,14) = 8.082, p = 0.001; Bonferroni). We also find several differences on gamma band in descending (affected vs. unaffected: F(1,14) = 3.164, p = 0.023; affected vs. healthy: F(1,14) = 3.891, p = 0.017; Bonferroni) and ascending pathway (affected vs. unaffected: F(1,14) = 6.263, p = 0.004; unaffected vs. healthy: F(1,14) = 7.531, p = 0.005; affected vs. healthy: F(1,14) = 18.082, p = 0.000; Bonferroni) with ratio at 3:1. Above results also show lower coupling in stroke-affected side than the stroke-unaffected side and healthy controls.
Fig. 6.

The significant area of TE with the ratios at 1:1, 3:2, 2:1 and 3:1 in two directions. A and D show significant area with ratio at 3:2, B and E with ratio at 2:1 and E and F with ratio at 3:1. The CFC ratio was given as EEG frequency over EMG frequency. “*” denotes p < 0.05, “**” denotes p < 0.01, and “***” denotes p < 0.001
Again, we analyzed the cross-frequency coupling directional differences among stroke-affected side, stroke-unaffected side and healthy controls. Figure 7 shows the grand averages of TE values in both directions with different CFC ratios, and we can conclude that there were no significant differences between descending and ascending pathways.
Fig. 7.

Grand-average of TE values in two directions. The CFC ratio was given as EEG frequency over EMG. The first column represents the significant area with ratio at 3:2, the second and third columns with ratios at 2:1 and 3:1
Relation between FCMC and clinical assessment scale
To obtain the relationship between the FCMC and the clinical assessment scale for stroke patients, we performed person correlation analysis between the significant area at gamma band and the STM test with different ratios in descending pathway, as shown in Fig. 8. According to Pearson correlation analysis, there were strong positive correlations between the values and the STM test at gamma band with ratios at 3:2 (r = 0.643, p < 0.05) and 2:1 (r = 0.646, p < 0.05), while less correlations with ratio at 3:1 (r = 0.427, p > 0.05). These results indicated that the CFC mechanism based on TE could be used as an indicator for rehabilitation status assessment of stroke patients.
Fig. 8.

Correlation between the in TE values and the STM test for stroke patients in descending pathway
Discussion
This study mainly focused on the FCMC between the motor cortex and muscles in stroke patients and explored the IFC and CFC differences among the stroke-affected side, stroke-unaffected side and healthy controls. We found that both IFC and CFC still existed in stroke patients. Compared with the stroke-unaffected side and healthy controls, the stroke-affected side yielded lower alpha, beta and gamma synchronization (IFC: beta; CFC: alpha, beta and gamma). For stroke patients, the ability to concentrate and maintain steady steady-state force was reduced, which indicated that alpha and beta bands were essential to concentrating and maintaining the motor capacities. Statistal analysis indicated stroke patients yielded no significant difference of the FCMC between EEG → EMG and EMG → EEG directions. These findings suggested that CFC might provide a new perspective to observe the alteration of synchronized activity between the brain and muscles when stroke occurs, and the investigation of functional connectivity across the full frequency spectrum could give us a deeper understanding of stroke sensory-motor system.
Cross-frequency coupling in the motor control system
CFC might thus serve as a mechanism to transfer information from one large-scale network operating at behavioral timescales to another fast, local network required for effective computation and synaptic modification, thus integrating functional systems across multiple spatiotemporal scales (Canolty and Knight 2010). As the association between the multiple frequency neural oscillations, the CFC is present across different frequency bands and neural systems (Hyafil et al. 2015a). However, three requirements for a network to generate the CFC are neural oscillations at two distinct frequencies, coupling between the neural circuits that generate the individual oscillations, and circuit parameters such as cross-circuit coupling strength. The sensory-motor system as a loop network meets the above requirements. Both cerebral brain and muscle frameworks can yield different frequencies and have their own oscillations network (Yang et al. 2016d). Additionally, the sensory-motor system is a nonlinear dynamic network(Vlaar et al. 2017), which can also result in the cross-frequency synchronization.
There are several approaches in which cross-frequency interactions might occur in the sensory-motor system. Given that each oscillation is characterized by three properties (amplitude, frequency, and phase) and may couple through any pair of such features, five principal CFC types exist in the oscillation system: phase-frequency coupling (PFC) (Ray and Maunsell 2010; Roberts et al. 2013a), phase-phase coupling (PPC) (Canavier 2015; Canavier et al. 2009), phase-amplitude coupling (PAC) (Onslow et al. 2014), amplitude-amplitude coupling (AAC) (de Pasquale et al. 2012; Siegel et al. 2012) and frequency-frequency coupling (FFC) (Chen et al. 2010; Yang et al. 2016e). Different types of neural oscillators always yield distinct signatures in neural dynamics (Roberts et al. 2013b) (Hyafil et al. 2015a). However, there are only few researches demonstrated CFC between the cortical oscillations and external somatosensory input (Yang et al. 2016a, 2016b). Winnie K.Y. So reveals instantaneous decrease in information transfer from EEG to the high frequency component of EMG (100-200 Hz) during the onset of movement (So et al. 2016). Yuan (Yang et al. 2016d) pointed out that both integer (1:2, 1:3, 1:4) and non-integer (2:3) harmonics coupling existed between cortical oscillations and muscle activity during isotonic wrist flexion. These studies have shown that during the performance of a simple motor task nonlinear coupling between the motor cortex and effector muscles is likely to be present. Our study also showed significant FFC concentrated in several specific frequencies with certain proportions (EEG → EMG: 1:1, 3:2, 2:1; EMG to EEG: 1:1, 2:1, 2:3, 3:1) in healthy control. Differently, we also analyzed IFC and CFC directional differences among stroke-affected side, stroke-unaffected side and healthy controls, and found that significant IFC synchronization in sensory-motor system was different between descending and ascending pathways, while no similarity for CFC. The cross-frequency coupling demonstrated an information shift to low frequency in signaling in the sensory-motor system. However, the physiological mechanism may be indefinable.
Decreased corticomuscular coupling in stroke patients
Our study showed significant beta synchronization in EEG → EMG direction and gamma range in EMG → EEG direction, while lower IFC at beta band for the stroke-affected and stroke-unaffected sides. The results are consistent with other existing studies and confirm that the functional coupling of the stroke patients was reduced at beta band. It indicated that, to a certain extent, beta band was essential for maintaining the motor capacities. It has been shown that beta-rhythm mainly roots in primary motor cortex and the oscillations in beta band are associated with controlling and maintaining steady-state force (Baker et al. 1997; Conway et al. 1995a; Groß et al. 2000; Halliday et al. 1998; Mehrkanoon et al. 2014; Salenius et al. 1997b). Furthermore, Previous researches also pointed out that the stroke could lead to the decrease of nerve oscillation activity (Schytz et al. 2010), and the weakening even loss of beta oscillation with the decrease of synaptic connections in cortex and spinal cord (Dai et al. 2017; Meng et al. 2008; Wheaton et al. 2008). This further illustrates the significance of the findings of this study. In addition, the functional coupling of stroke patients at gamma band in ascending pathway was enhanced. This is contrary to the loss of gamma band in dynamic stroke patients (Ma et al. 2014). This has never been reported in previous studies. Based on the available literatures, we could inferr that it might be related to the tasks performed by the subjects (Krause et al. 2014; Nakamura and Tateno 2019; Naros et al. 2016). Although the task performed in this paper is static force, the ability of stroke patients to maintain the stability of static motion is poor due to long-term inactivity, which may lead to dynamic changes of action, and thus may cause gamma band oscillation (Schoffelen et al. 2011).
Similarly, the results also showed that the coupling strength on the stroke-affected side was smaller than that on the stroke-unaffected side. Further analysis showed that the significant CFC mainly focused on the alpha, beta and gamma bands, especially on gamma band. Except for the EMG → EEG direction with ratio at 2:1, the significant area values were significantly at gamma band with different ratios in two directions. It may be related to the function of gamma band in the nonlinear interaction process of nerve oscillation (Müller et al. 1999). For stroke patients, when the cross-frequency coupling was weakened, that was, the nonlinear interaction between the brain and the muscles was reduced, and the control commands issued by the brain were affected by brain damage during the information transmission. The oscillating activities of tissues and organs involved in information transmission are also weakened, resulting in the loss of effective information and the coupling oscillations, which leads to the weakening of information interaction and frequency bands translation of stroke patients. At beta band, the coupling strength of stroke-affected was smaller than that of the healthy controls with the ratio at 2:1. This was consistent with the results on IFC analysis, and further confirmed the importance of beta band in maintaining steady-state force. At alpha band, there were significant differences with ratios at 3:2 and 2:1, possibly because the alpha band was associated with maintaining attention (Mima et al. 2002). Stroke patients have trouble in concentrating for the damage of nervous system, and then leads to the weakening of coupling on alpha band. Besides, the coupling of the stroke-unaffected side was smaller than that of the healthy controls with the ratio at 2:1. This reduced function coupling may be due to the requirement to provide the compensation of the stroke-unaffected side for the stroke-affected side.
Distinction between descending and ascending pathways following stroke
The closed-loop control and feedback of the neuromuscular system lead to two-way information transmission in FCMC (Grosse et al. 2003; Mima et al. 2001a; Riddle et al. 2004; Witham et al. 2011). In this study, we also investigated the information flow between the motor cortex and the effector muscles. We discovered that significantly IFC in descending pathway was higher than that in ascending pathway at beta band for healthy controls. It is in accordance with the previous report that the FCMC at 19–30 Hz band from EEG to EMG is significantly larger than that from EMG to EEG (Mima et al. 2001a). With respect to why interaction strength at beta band in the descending direction was significantly higher than that in the ascending direction, Mima et al. (2001a) reported that the FCMC in beta band might reflect motor and control mechanisms from the cortex to the muscle during a weak tonic contraction. Secondly, the structural differences might result in the differences between the two pathways. Our study on patients found that information flow of stroke-unaffected side was the same as that of healthy controls. This might be caused by the damage for the motor function of stroke-unaffected side, so the information transmission and neural oscillatory activity were not changed. However, we found no significant difference in bidirectional coupling on the affected side. It is different from the findings of Y. Gao et al. in which the coupling for stroke patients in both two directions was enhanced, and the interaction in the ascending direction was significantly stronger than in the descending direction (Gao et al. 2018). They explained that it might be due to abnormal control caused by motor cortex injury, which prevented the activation of motor neurons and motor cortex. These differences may be related to the state of rehabilitation. In previous study, stroke patients are all in the period of 1–2 months after stroke. At this time, stroke patients are at acute stage or recovery stage. In this paper, all stroke patients are at sequelae stage. Next, the ascending pathway, which conveys feedback information from muscle to cerebral cortex, is relatively less injury for stroke-affected side.
Additionally, we explored the CFC directional differences among stroke-affected side, stroke-unaffected side and healthy controls in both directions with different ratios. The results showed that there was no significant difference for three levels of subject. With respect to why there is no significant difference between the two directions of information flow under cross-frequency coupling, it is still unclear. One possible explanation is that the CFC may focus more on switching between fast and slow oscillations (Canolty and Knight 2010).We will delve into the directional difference in the future work.
Conclusion
To describe these features, we applied the wavelet package and the transfer entropy methods to quantitatively analyze the functional connectivity in specific bands between the EEG and EMG signals during an steady-state force task, and thus consequently extended our understanding of how cortical oscillation drives are coupled with muscle activation in the sensory-motor systems. We found the stroke-affected side yielded lower alpha, beta and gamma synchronization (IFC: beta; CFC: alpha, beta and gamma), which indicated that alpha and beta bands are essential to concentrating and maintaining the motor capacities. Further analysis indicated stroke patients yielded no significant difference of the FCMC between EEG → EMG and EMG → EEG directions. Our results indicated that there were direct and indirect synchronized activity between the brain and muscles and demonstrated the clinical relevance of FCMC.
Acknowledgements
This research was supported by National Nature Science Foundation of China (Grant No. 61673336), Postdoctoral Science Foundation Funded Project (Grant No. 2019M651066) and Science and Scientific Research and Development Project of Qinhuangdao (Grant No. 201805A004). Authors would like to thank editor and reviewers for helpful comments to improve this manuscript.
Compliance with ethical standards
Conflict of interest
The authors declare that they have no conflict of interes.
Footnotes
Publisher's Note
Springer Nature remains neutral with regard to jurisdictional claims in published maps and institutional affiliations.
Contributor Information
Ping Xie, Email: pingx@ysu.edu.cn.
Xiaoling Chen, Email: xlchen@ysu.edu.cn.
References
- Baker S, Olivier E, Lemon R. Coherent oscillations in monkey motor cortex and hand muscle EMG show task-dependent modulation. J Physiol. 1997;501:225–241. doi: 10.1111/j.1469-7793.1997.225bo.x. [DOI] [PMC free article] [PubMed] [Google Scholar]
- Brown P, Salenius S, Rothwell JC, Hari R. Cortical correlate of the piper rhythm in humans. J Neurophysiol. 1998;80:2911–2917. doi: 10.1152/jn.1998.80.6.2911. [DOI] [PubMed] [Google Scholar]
- Canavier CC. Phase-resetting as a tool of information transmission. Curr Opin Neurobiol. 2015;31:206–213. doi: 10.1016/j.conb.2014.12.003. [DOI] [PMC free article] [PubMed] [Google Scholar]
- Canavier CC, Kazanci FG, Prinz AA. Phase resetting curves allow for simple and accurate prediction of robust N: 1 phase locking for strongly coupled neural oscillators. Biophys J . 2009;97:59–73. doi: 10.1016/j.bpj.2009.04.016. [DOI] [PMC free article] [PubMed] [Google Scholar]
- Canolty RT, Knight RT. The functional role of cross-frequency coupling. Trends Cognit Sci. 2010;14:506–515. doi: 10.1016/j.tics.2010.09.001. [DOI] [PMC free article] [PubMed] [Google Scholar]
- Chen C, Kilner JM, Friston KJ, Kiebel SJ, Jolly RK, Ward NS. Nonlinear coupling in the human motor system. J Neurosci. 2010;30:8393–8399. doi: 10.1523/JNEUROSCI.1194-09.2010. [DOI] [PMC free article] [PubMed] [Google Scholar]
- Chen X, Xie P, Zhang Y, Chen Y, Cheng S, Zhang L. Abnormal functional corticomuscular coupling after stroke. Neuro Image Clin. 2018;19:147–159. doi: 10.1016/j.nicl.2018.04.004. [DOI] [PMC free article] [PubMed] [Google Scholar]
- Chen X, Zhang Y, Cheng S, Xie P. Transfer spectral entropy and application to functional corticomuscular coupling. IEEE Trans Neural Syst Rehabil Eng. 2019;27:1092–1102. doi: 10.1109/TNSRE.2019.2907148. [DOI] [PubMed] [Google Scholar]
- Conway B, Halliday D, Farmer S, Shahani U, Maas P, Weir A, Rosenberg J. Synchronization between motor cortex and spinal motoneuronal pool during the performance of a maintained motor task in man. J Physiol. 1995;489:917–924. doi: 10.1113/jphysiol.1995.sp021104. [DOI] [PMC free article] [PubMed] [Google Scholar]
- Conway BA, Halliday DM, Farmer SF, Shahani U, Maas P, Weir AI, Rosenberg JR. Synchronization between motor cortex and spinal motoneuronal pool during the performance of a maintained motor task in man. J Physiol. 1995;489:917–924. doi: 10.1113/jphysiol.1995.sp021104. [DOI] [PMC free article] [PubMed] [Google Scholar]
- Dai C, Suresh NL, Suresh AK, Rymer WZ, Hu X. Altered motor unit discharge coherence in paretic muscles of stroke survivors. Front Neurol. 2017;8:202. doi: 10.3389/fneur.2017.00202. [DOI] [PMC free article] [PubMed] [Google Scholar]
- De Clercq W, Vergult A, Vanrumste B, Van Paesschen W, Van Huffel S. Canonical correlation analysis applied to remove muscle artifacts from the electroencephalogram. IEEE Trans Biomed Eng. 2006;53:2583–2587. doi: 10.1109/TBME.2006.879459. [DOI] [PubMed] [Google Scholar]
- De Oliveira JL, Avila M, Martins TC, Alvarezsilva M, Winkelmannduarte EC, Salgado ASI, Cidralfilho FJ, Reed WR, Martins D (2020) Medium- and long-term functional behavior evaluations in an experimental focal ischemic stroke mouse model. Cognitive Neurodynamics [DOI] [PMC free article] [PubMed]
- de Pasquale F, Della Penna S, Snyder AZ, Marzetti L, Pizzella V, Romani GL, Corbetta M. A cortical core for dynamic integration of functional networks in the resting human brain. Neuron. 2012;74:753–764. doi: 10.1016/j.neuron.2012.03.031. [DOI] [PMC free article] [PubMed] [Google Scholar]
- Fang Y, Daly JJ, Sun J, Hvorat K, Fredrickson E, Pundik S, Sahgal V, Yue GH. Functional corticomuscular connection during reaching is weakened following stroke. Clin Neurophysiol. 2009;120:994–1002. doi: 10.1016/j.clinph.2009.02.173. [DOI] [PMC free article] [PubMed] [Google Scholar]
- Gao Y, Ren L, Li R, Zhang Y. electroencephalogram–electromyography coupling analysis in stroke Based on symbolic Transfer entropy. Front Neurol. 2018;8:716. doi: 10.3389/fneur.2017.00716. [DOI] [PMC free article] [PubMed] [Google Scholar]
- Groß J, Tass P, Salenius S, Hari R, Freund HJ, Schnitzler A. Cortico-muscular synchronization during isometric muscle contraction in humans as revealed by magnetoencephalography. J Physiol. 2000;527:623–631. doi: 10.1111/j.1469-7793.2000.00623.x. [DOI] [PMC free article] [PubMed] [Google Scholar]
- Gross J, Tass PA, Salenius S, Hari R, Freund HJ, Schnitzler A. Cortico-muscular synchronization during isometric muscle contraction in humans as revealed by magnetoencephalography. J Physiol. 2000;527:623–631. doi: 10.1111/j.1469-7793.2000.00623.x. [DOI] [PMC free article] [PubMed] [Google Scholar]
- Grosse P, Guerrini R, Parmeggiani L, Bonanni P, Pogosyan A, Brown P. Abnormal corticomuscular and intermuscular coupling in high-frequency rhythmic myoclonus. Brain. 2003;126:326–342. doi: 10.1093/brain/awg043. [DOI] [PubMed] [Google Scholar]
- Halliday DM, Conway BA, Farmer SF, Rosenberg JR. Using electroencephalography to study functional coupling between cortical activity and electromyograms during voluntary contractions in humans. Neurosci Lett. 1998;241:5–8. doi: 10.1016/s0304-3940(97)00964-6. [DOI] [PubMed] [Google Scholar]
- He F, Sarrigiannis PG, Billings SA, Wei H, Rowe J, Romanowski CAJ, Hoggard N, Hadjivassilliou M, Rao DG, Grunewald RA. Nonlinear interactions in the thalamocortical loop in essential tremor: a model-based frequency domain analysis. Neuroscience. 2016;324:377–389. doi: 10.1016/j.neuroscience.2016.03.028. [DOI] [PubMed] [Google Scholar]
- Hyafil A, Giraud A-L, Fontolan L, Gutkin B. Neural cross-frequency coupling: connecting architectures, mechanisms, and functions. Trends Neurosci. 2015;38:725–740. doi: 10.1016/j.tins.2015.09.001. [DOI] [PubMed] [Google Scholar]
- Hyafil A, Giraud A, Fontolan L, Gutkin B. Neural cross-frequency coupling: connecting architectures, mechanisms, and functions. Trends Neurosci. 2015;38:725–740. doi: 10.1016/j.tins.2015.09.001. [DOI] [PubMed] [Google Scholar]
- Jang SH, Seo JP. The distribution of the cortical origin of the corticoreticular pathway in the human brain: A diffusion tensor imaging study. Somatosens Mot Res. 2014;31:204–208. doi: 10.3109/08990220.2014.917292. [DOI] [PubMed] [Google Scholar]
- Krause V, Wach C, Südmeyer M, Ferrea S, Schnitzler A, Pollok B. Cortico-muscular coupling and motor performance are modulated by 20 Hz transcranial alternating current stimulation (tACS) in Parkinson’s disease. Front Hum Neurosci. 2014;7:928. doi: 10.3389/fnhum.2013.00928. [DOI] [PMC free article] [PubMed] [Google Scholar]
- Liang Z, Wang Y, Sun X, Li D, Voss LJ, Sleigh JW, Hagihira S, Li X. EEG entropy measures in anesthesia. Front Comput Neurosci. 2015;9:16. doi: 10.3389/fncom.2015.00016. [DOI] [PMC free article] [PubMed] [Google Scholar]
- Ma P, Chen Y, Du Y, Su Y, Wu X, Liang Z, Xie P. Analysis of corticomuscular coherence during rehabilitation exercises after stroke. J Biomed Eng. 2014;31:971–977. [PubMed] [Google Scholar]
- Mehrkanoon S, Breakspear M, Boonstra TW. The reorganization of corticomuscular coherence during a transition between sensorimotor states. Neuroimage. 2014;100:692–702. doi: 10.1016/j.neuroimage.2014.06.050. [DOI] [PubMed] [Google Scholar]
- Meng F, Tong K-Y, Chan S-T, Wong W-W, Lui K-H, Tang K-W, Gao X, Gao S. Cerebral plasticity after subcortical stroke as revealed by cortico-muscular coherence. IEEE Trans Neural Syst Rehabil Eng. 2008;17:234–243. doi: 10.1109/TNSRE.2008.2006209. [DOI] [PubMed] [Google Scholar]
- Meng F, Tong K-Y, Chan S-T, Wong W-W, Lui K-H, Tang K-W, Gao X, Gao S. Cerebral plasticity after subcortical stroke as revealed by cortico-muscular coherence. IEEE Trans Neural Syst Rehabil Eng. 2009;17:234–243. doi: 10.1109/TNSRE.2008.2006209. [DOI] [PubMed] [Google Scholar]
- Mima T, Hallett M. Corticomuscular coherence: a review. J Clin Neurophysiol. 1999;16:501. doi: 10.1097/00004691-199911000-00002. [DOI] [PubMed] [Google Scholar]
- Mima T, Matsuoka T, Hallett M. Information flow from the sensorimotor cortex to muscle in humans. Clin Neurophysiol. 2001;112:122–126. doi: 10.1016/s1388-2457(00)00515-0. [DOI] [PubMed] [Google Scholar]
- Mima T, Ohara S, Nagamine T. Cortical–muscular coherence. International congress series. Amsterdam: Elsevier; 2002. pp. 109–119. [Google Scholar]
- Mima T, Toma K, Koshy B, Hallett M. Coherence between cortical and muscular activities after subcortical stroke. Stroke. 2001;32:2597–2601. doi: 10.1161/hs1101.098764. [DOI] [PubMed] [Google Scholar]
- Müller MM, Keil A, Gruber T, Elbert T. Processing of affective pictures modulates right-hemispheric gamma band EEG activity. Clin Neurophysiol. 1999;110:1913–1920. doi: 10.1016/s1388-2457(99)00151-0. [DOI] [PubMed] [Google Scholar]
- Nakamura O, Tateno K. Random pulse induced synchronization and resonance in uncoupled non-identical neuron models. Cogn Neurodyn. 2019;13:303–312. doi: 10.1007/s11571-018-09518-5. [DOI] [PMC free article] [PubMed] [Google Scholar]
- Naros G, Naros I, Grimm F, Ziemann U, Gharabaghi A. Reinforcement learning of self-regulated sensorimotor β-oscillations improves motor performance. Neuroimage. 2016;134:142–152. doi: 10.1016/j.neuroimage.2016.03.016. [DOI] [PubMed] [Google Scholar]
- Nasrolahzadeh M, Mohammadpoory Z, Haddadnia J. Higher-order spectral analysis of spontaneous speech signals in Alzheimer’s disease. Cogn Neurodyn. 2018;12:583–596. doi: 10.1007/s11571-018-9499-8. [DOI] [PMC free article] [PubMed] [Google Scholar]
- Oldfield RC. The assessment and analysis of handedness: the Edinburgh inventory. Neuropsychologia. 1971;9:97–113. doi: 10.1016/0028-3932(71)90067-4. [DOI] [PubMed] [Google Scholar]
- Onslow ACE, Jones MW, Bogacz R (2014) A canonical circuit for generating phase-amplitude coupling. PLOS ONE p. 9 [DOI] [PMC free article] [PubMed]
- Ping X, Fang-Mei Y, Xin-Xin L, Yong Y, Xiao-Ling C, Li-Tai Z. Functional coupling analyses of electroencephalogram and electromyogram based on variational mode decomposition-transfer entropy. Acta Phys Sin. 2016;65:248702. [Google Scholar]
- Raethjen J, Lindemann M, Dümpelmann M, Wenzelburger R, Stolze H, Pfister G, Elger CE, Timmer J, Deuschl G. Corticomuscular coherence in the 6–15 Hz band: is the cortex involved in the generation of physiologic tremor? Exp Brain Res. 2002;142:32–40. doi: 10.1007/s00221-001-0914-7. [DOI] [PubMed] [Google Scholar]
- Rathore SS, Hinn AR, Cooper LS, Tyroler HA, Rosamond WD. Characterization of Incident Stroke Signs and Symptoms Findings From the Atherosclerosis Risk in Communities Study. Stroke. 2002;33:2718–2721. doi: 10.1161/01.str.0000035286.87503.31. [DOI] [PubMed] [Google Scholar]
- Ray S, Maunsell JH. Differences in gamma frequencies across visual cortex restrict their possible use in computation. Neuron. 2010;67:885–896. doi: 10.1016/j.neuron.2010.08.004. [DOI] [PMC free article] [PubMed] [Google Scholar]
- Riddle CN, Baker MR, Baker SN. The effect of carbamazepine on human corticomuscular coherence. Neuroimage. 2004;22:333–340. doi: 10.1016/j.neuroimage.2003.12.040. [DOI] [PubMed] [Google Scholar]
- Roberts MJ, Lowet E, Brunet NM, Ter Wal M, Tiesinga P, Fries P, De Weerd P. Robust gamma coherence between macaque V1 and V2 by dynamic frequency matching. Neuron. 2013;78:523–536. doi: 10.1016/j.neuron.2013.03.003. [DOI] [PubMed] [Google Scholar]
- Roberts MJ, Lowet E, Brunet NM, Wal MT, Tiesinga P, Fries P, Weerd PD. Robust Gamma Coherence between Macaque V1 and V2 by Dynamic Frequency Matching. Neuron. 2013;78:523. doi: 10.1016/j.neuron.2013.03.003. [DOI] [PubMed] [Google Scholar]
- Salenius S, Portin K, Kajola M, Salmelin R, Hari R. Cortical control of human motoneuron firing during isometric contraction. J Neurophysiol. 1997;77:3401–3405. doi: 10.1152/jn.1997.77.6.3401. [DOI] [PubMed] [Google Scholar]
- Schoffelen J-M, Poort J, Oostenveld R, Fries P. Selective movement preparation is subserved by selective increases in corticomuscular gamma-band coherence. J Neurosci. 2011;31:6750–6758. doi: 10.1523/JNEUROSCI.4882-10.2011. [DOI] [PMC free article] [PubMed] [Google Scholar]
- Schreiber T, Schmitz A. Improved Surrogate Data for Nonlinearity Tests. Phys Rev Lett. 1996;77:635. doi: 10.1103/PhysRevLett.77.635. [DOI] [PubMed] [Google Scholar]
- Schytz HW, Hansson A, Phillip D, Selb J, Boas DA, Iversen HK, Ashina M. Spontaneous low-frequency oscillations in cerebral vessels: applications in carotid artery disease and ischemic stroke. J Stroke Cerebrovasc Dis. 2010;19:465–474. doi: 10.1016/j.jstrokecerebrovasdis.2010.06.001. [DOI] [PMC free article] [PubMed] [Google Scholar]
- Siegel M, Donner TH, Engel AK. Spectral fingerprints of large-scale neuronal interactions. Nat Rev Neurosci. 2012;13:121–134. doi: 10.1038/nrn3137. [DOI] [PubMed] [Google Scholar]
- Sinha N, Dewald JPA, Heckman C, Yang Y. Cross-frequency coupling in descending motor pathways: theory and simulation. Front Syst Neuroence. 2019;13:86. doi: 10.3389/fnsys.2019.00086. [DOI] [PMC free article] [PubMed] [Google Scholar]
- So WKY, Yang L, Jelfs B, She Q, Wong SWH, Mak JN, Chan RHM (2016) Cross-frequency information transfer from EEG to EMG in grasping.In International conference of the IEEE engineering in medicine and biology society, pp. 4531–4534 [DOI] [PubMed]
- Stoica P, Nehorai A. Performance analysis of an adaptive notch filter with constrained poles and zeros. IEEE Trans Acoust Speech Signal Process. 1988;36:911–919. [Google Scholar]
- Tobimatsu S, Zhang YM, Kato M. Steady-state vibration somatosensory evoked potentials : physiological characteristics and tuning function. Clin Neurophysiol. 1999;110:1953–1958. doi: 10.1016/s1388-2457(99)00146-7. [DOI] [PubMed] [Google Scholar]
- Van Wijk BCM, Beek PJ, Daffertshofer A. Neural synchrony within the motor system: what have we learned so far? Front Hum Neurosci. 2012;6:252–252. doi: 10.3389/fnhum.2012.00252. [DOI] [PMC free article] [PubMed] [Google Scholar]
- Vicente R, Wibral M, Lindner M, Pipa G. Transfer entropy—a model-free measure of effective connectivity for the neurosciences. J Comput Neurosci. 2011;30:45–67. doi: 10.1007/s10827-010-0262-3. [DOI] [PMC free article] [PubMed] [Google Scholar]
- Vlaar MP, Solisescalante T, Vardy AN, Der Helm FCTV, Schouten AC. Quantifying nonlinear contributions to cortical responses evoked by continuous wrist manipulation. IEEE Trans Neural Syst Rehabil Eng. 2017;25:481–491. doi: 10.1109/TNSRE.2016.2579118. [DOI] [PubMed] [Google Scholar]
- von Carlowitz-Ghori K, Bayraktaroglu Z, Hohlefeld FU, Losch F, Curio G, Nikulin VV. Corticomuscular coherence in acute and chronic stroke. Clin Neurophysiol. 2014;125:1182–1191. doi: 10.1016/j.clinph.2013.11.006. [DOI] [PubMed] [Google Scholar]
- Wheaton LA, Bohlhalter S, Nolte G, Shibasaki H, Hattori N, Fridman E, Vorbach S, Grafman J, Hallett M. Cortico-cortical networks in patients with ideomotor apraxia as revealed by EEG coherence analysis. Neurosci Lett. 2008;433:87–92. doi: 10.1016/j.neulet.2007.12.065. [DOI] [PMC free article] [PubMed] [Google Scholar]
- Witham CL, Riddle CN, Baker MR, Baker SN. Contributions of descending and ascending pathways to corticomuscular coherence in humans. J Physiol. 2011;589:3789–3800. doi: 10.1113/jphysiol.2011.211045. [DOI] [PMC free article] [PubMed] [Google Scholar]
- Wolfgang O, Luis P, Marie-Claude HR, Rumyana K. Gamma-range corticomuscular coherence during dynamic force output. Neuroimage. 2007;34:1191–1198. doi: 10.1016/j.neuroimage.2006.10.018. [DOI] [PubMed] [Google Scholar]
- Xie P, Cheng S, Zhang Y, Liu Z, Liu H, Chen X, Li X. Direct Interaction on Specific Frequency Bands in Functional Corticomuscular Coupling. IEEE Trans Biomed Eng. 2020;67:762–772. doi: 10.1109/TBME.2019.2920983. [DOI] [PubMed] [Google Scholar]
- Yang Y, Solis-Escalante T, van de Ruit M, van der Helm FC, Schouten AC. Nonlinear coupling between cortical oscillations and muscle activity during isotonic wrist flexion. Front Comput Neurosci. 2016;10:126. doi: 10.3389/fncom.2016.00126. [DOI] [PMC free article] [PubMed] [Google Scholar]
- Yang Y, Solis-Escalante T, Yao J, Daffertshofer A, Schouten AC, van der Helm FC. A general approach for quantifying nonlinear connectivity in the nervous system based on phase coupling. Int J Neural Syst. 2016;26:1550031. doi: 10.1142/S0129065715500318. [DOI] [PubMed] [Google Scholar]
- Yang Y, Solis-Escalante T, Yao J, Van Der Helm FC, Dewald JP, Schouten AC. Nonlinear connectivity in the human stretch reflex assessed by cross-frequency phase coupling. Int J Neural Syst. 2016;26:1650043. doi: 10.1142/S012906571650043X. [DOI] [PubMed] [Google Scholar]
- Yang Y, Solisescalante T, De Ruit MV, Der Helm FCTV, Schouten AC. Nonlinear coupling between cortical oscillations and muscle activity during isotonic wrist flexion. Front Comput Neurosci. 2016;10:126–126. doi: 10.3389/fncom.2016.00126. [DOI] [PMC free article] [PubMed] [Google Scholar]
- Yang Y, Solisescalante T, Der Helm FCTV, Schouten AC. A Generalized Coherence Framework for Detecting and Characterizing Nonlinear Interactions in the Nervous System. IEEE Trans Biomed Eng. 2016;63:2629–2637. doi: 10.1109/TBME.2016.2585097. [DOI] [PubMed] [Google Scholar]
- Yu H, Zhu L, Cai L, Wang J, Liu C, Shi N, Liu J. Variation of functional brain connectivity in epileptic seizures: an EEG analysis with cross-frequency phase synchronization. Cogn Neurodyn. 2020;14:35–49. doi: 10.1007/s11571-019-09551-y. [DOI] [PMC free article] [PubMed] [Google Scholar]
- Zhang W, Guo L, Liu D, Xu G (2019) The dynamic properties of a brain network during working memory based on the algorithm of cross-frequency coupling. Cognitive Neurodynamics, pp 1–14 [DOI] [PMC free article] [PubMed]