Abstract
It has been found that gamma oscillations and the oscillation frequencies are regulated by the properties of external stimuli in many biology experimental researches. To unveil the underlying mechanism, firstly, we reproduced the experimental observations in an excitatory/inhibitory (E/I) neuronal network that the oscillation became stronger and moved to a higher frequency band (gamma band) with the increasing of the input difference between E/I neurons. Secondly, we found that gamma oscillation was induced by the unbalance between positive and negative synaptic currents, which was caused by the input difference between E/I neurons. When this input difference became greater, there would be a stronger gamma oscillation (i.e., a higher peak power in the power spectrum of the population activity of neurons). Further investigation revealed that the frequency dependency of gamma oscillation on the input difference between E/I neurons could be explained by the well-known mechanisms of inter-neuron-gamma (ING) and pyramidal-interneuron-gamma (PING). Finally, we derived mathematical analysis to verify the mechanism of frequency regulations and the results were consistent with the simulation results. The results of this paper provide a possible mechanism for the external stimuli-regulated gamma oscillations.
Keywords: Gamma oscillation, Excitatory/inhibitory neuronal network, Inter-neuron-gamma, Pyramidal-interneuron-gamma, Input difference
Introduction
Gamma oscillations (30–90 Hz) are involved in many perceptions and cognitive activities in the brain, the properties of which can be used to monitor the state of neurons and to obtain the important clues about neuronal dynamics of the brain (Hipp et al. 2011; Burns et al. 2011; Orekhova et al. 2015). Different experimental observations show that gamma oscillations and the oscillation frequencies are regulated by the properties of external stimuli (inputs) (Jadi and Sejnowski 2014a). It is found that the frequency of gamma oscillations in V1 cortex of awaking macaques increases monotonically with the increase of stimulus contrast (Ray and Maunsell 2010). It is also found that the increase of the stimulus size promotes the strong gamma oscillations in the primary visual cortex of awake monkeys (Ray and Maunsell 2011). It is further observed that the frequency and the strength of gamma oscillations grow linearly with the increase of either illumination contrast (Perry et al. 2015) or the light intensity (Saleem et al. 2017) in the visual cortex. However, the underlying mechanism of why gamma oscillations depend on the properties of external stimuli (inputs) is still under investigation.
In order to explain the above experimental observations, mathematical modeling could be a possible way. Over recent years, modelling methods that explain gamma oscillations and their different possible mechanisms, due to its significance and challenges, remains a hot topic among researchers. The first mechanism is based on neural firing synchronization (Kim and Lim 2018, 2020; Vida et al. 2006; Tiesinga and Sejnowski 2009; Bartos et al. 2007; Brunel and Wang 2003), i.e., gamma oscillations can be explained by the “spike-to-spike synchrony” (Tiesinga and Sejnowski 2009; Bartos et al. 2007): the network rhythm is caused by spike synchronization among neurons, which behaves as periodic oscillator. Gamma oscillations can be explained by another mechanism, firing-rate synchrony (Brunel and Wang 2003). Specifically, interconnected neurons in the network are regarded as self-feedback filters, which filter out other frequency components of the signal and leave the frequency components within high frequency band. The high-frequency oscillation formed by filtering has the similar shape to sine waves. Discharge of each neuron tends to be no periodic and its firing rate is much lower than the oscillation frequency. Some studies showed that gamma oscillations were induced mainly by inhibitory neurons (fast-spiking interneurons), which was known as the inter-neuron-gamma mechanism (ING) (Bartos et al. 2007). More studies suggested that gamma oscillations were induced mainly by the interaction of excitatory neurons and inhibitory neurons, which was known as the pyramidal-interneuron-gamma mechanism (PING) (Tiesinga and Sejnowski 2009). However, there are few modeling studies explaining that how gamma oscillations are regulated by the properties of the external inputs.
As discussed above, E/I network is usually used for the modeling of neural circuits and exploring the mechanism of gamma oscillations (Jadi and Sejnowski 2014a; Tiesinga and Sejnowski 2009; Brunel and Wang 2003; Malagarriga et al. 2019; Araki et al. 2020; Wallace et al. 2011). To explore the mechanism of gamma oscillations depending on the properties of external inputs, we need to map out the properties of external stimuli to the inputs of E/I neurons. Here is a simple mapping method (Jadi and Sejnowski 2014a) pointing out that the degree of change in the inputs to excitatory neurons is different from that in the inputs to inhibitory neurons, when the contrast of visual stimulus in the receptive fields of neurons (the center stimulus) or the contrast of visual stimulus outside the receptive fields (the surround stimulus) changes. Specifically, the increasing of the contrast of the center stimulus leads to the increment in the inputs to excitatory neurons but the inputs to inhibitory neurons are almost remains unchanged; the increasing of the contrast of the surround stimulus leads to an increment of the inputs to inhibitory neurons but the inputs to excitatory neurons are almost unchanged. Therefore, in this paper we constructed an E/I neural network model that composed of integrate-and-fire (IAF) neurons to reproduce the external stimuli-regulated gamma oscillations. Further we investigated the underlying mechanism of gamma oscillations regulated by the external inputs in two cases following the contrast-inputs mapping method discussed above. We have found that the larger difference between the external inputs to excitatory and inhibitory neurons, the higher frequency (note that frequency band of gamma oscillations occupies higher end of the frequency spectrum of neural activities) and the stronger oscillations (i.e., the higher peak power in the power spectrum of the population activity of neurons), which is consistent with the experimental observations.
This paper is organized as follows. In “Description of the neuronal network model” section, a local excitatory/inhibitory (E/I) neuronal network composing of integrate-and-fire (IAF) neurons with different external inputs to excitatory neurons (E-neurons) and inhibitory neurons (I-neurons) is established. “Enhancement of gamma oscillations with enlargement of input difference between E/I neurons” section proposes the simulation methods and shows the simulation results. The biology experimental observations, that the increase in frequency and the strength of gamma oscillations with the increase of the input difference between E-neurons and I-neurons, are reproduced with the network model by simulation in “Enhancement of gamma oscillations with enlargement of input difference between E/I neurons” section. The underlying mechanism is further revealed by simulation results and its mathematical analysis is discussed in “Dependency analysis of frequency on enlargement of input difference” and “Dependency analysis of gamma oscillation strength on input difference from the perspective of synaptic current” sections. “Discussion and conclusion” section gives discussions and conclusions.
Description of the neuronal network model
A neuronal network model consists of excitatory and inhibitory neurons (Wallace et al. 2011; Neymotin et al. 2011), where all neurons are connected with each other. Since integrate-and-fire (IAF) neuronal model (Sacerdote and Giraudo 2013) and conductance-based synapse model (Dayan and Abbott 2001) are simple but accurate enough in most situations to describe the kinetic characteristics of real biological neurons and synapses, respectively. Therefore, we use them in our E/I neuronal network model, which can be described as follows:
| 1 |
where , τ are the membrane potential and the membrane time constant of neuron i, respectively, is the equilibrium potential of leakage ions, R is the membrane resistance, denotes the synaptic current transmitted from neuron j to neuron i, N is the number of neurons in the network, is the external stimulus of neuron i, is the maximum conductance of synapse (the synaptic weight), is the reverse potential of synapse, is the synaptic conductance coefficient which denoting the opening level of the synaptic ion channel gate of neuron j connecting to neuron i, represents the background input of neuron i, which differs from neuron to neuron. The value for neuron i is drawn randomly and uniformly from the interval of .
The conductance coefficient can be described by Wang and Buzsáki (1996):
| 2 |
where α is the gate enhancement factor and β is the gate decay factor, d is the synaptic time delay, is the spiking time of neuron j. If , , otherwise .
The kinetic characteristics of E- and I-neurons in the network model are both described by Eq. (1), but their parameters are different in the following simulations (see Table 1 for details). In Table 1, is the spiking threshold potential and is the resting membrane potential. If the membrane potential of neuron i exceeds , the neuron i would emit an action potential and then reset to the resting membrane potential .
Table 1.
Neuronal parameters in our model
| Parameters | Type of neurons | |
|---|---|---|
| E neurons | I neurons | |
| N | 400 | 100 |
| Vth (mV) | − 45 | − 45 |
| Vreset (mV) | − 65 | − 65 |
| Esyn (mV) | 0 | − 75 |
| τ (ms) | 5 | 1 |
| R (mV) | 10 | 10 |
| VL (mV) | − 65 | − 65 |
| gmax | 0.00048 | 0.012 |
| α | 0.9 | 0.9 |
| β | 0.003 | 0.003 |
| d (ms) | 3 | 3 |
in Table 1 represents the strength of the synaptic weight, which is a constant value. The values of the synaptic weights () in Table 1 for E- and I-neurons should be set appropriately, which can be determined according to (Neymotin et al. 2011; Wang and Buzsáki 1996).
Enhancement of gamma oscillations with enlargement of input difference between E/I neurons
Simulation methods
We simulate the E/I network to reproduce the biology observations that gamma oscillations depend on the input difference between E/I Neurons. We supposed that the values S1 and S2 to be the external inputs to excitatory and inhibitory neurons respectively, mapped from the gray values of pixels of a visual stimulus (image) within their receptive fields (i.e., for E-neurons, for I-neurons). Since excitatory neurons and inhibitory neurons have different receptive fields (Jadi and Sejnowski 2014b), S1 and S2 have saliently different values if the distribution of the pixels in a visual stimulus (image) is evidently inhomogeneous (for example, if the image has large illumination contrast). Here is defined as the difference between the external inputs to E- and I-neurons, which is described by Eq. (3):
| 3 |
Researchers have observed the variation on gamma oscillations by changing the contrast of a visual stimulus in many biology experiments (Ray and Maunsell 2010; Adjamian et al. 2008; Henrie and Shapley 2005). For example, they used the grating stimulus with light strips and dark strips as the external stimulus. When the gray value of black stripes is greater than that of light stripes or the gray value of light stripes is greater than that of black stripe, the distribution of the pixels in the image is inhomogeneous and illumination contrast exists in the image. In order to mimic the contrast changes of the grating stimulus, firstly, we considered a balance network where , then we consider to regulate our E/I network by increasing the input difference in the following two cases according to the discussion in the Introduction section: (1) where we increase S2 gradually but keep S1 unchanged; (2) where we increase S1 gradually but keep S2 unchanged. The larger the value of is, the larger the input difference between E- and I-neurons is.
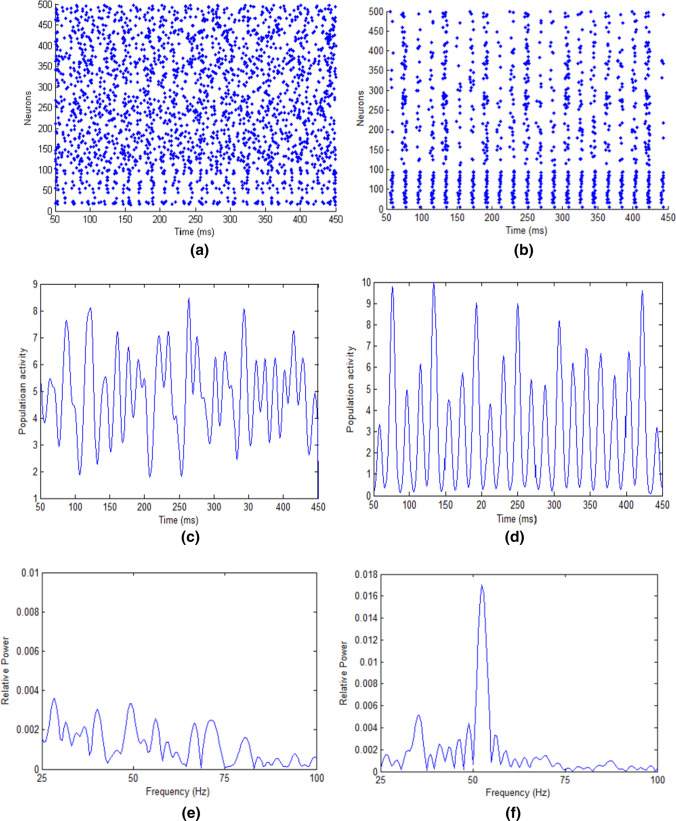
The network model is simulated in MATLAB 2012a environment with a clock-driven algorithm according to the parameters listed in Table 1 and the time step of the simulation time is set as 0.01 ms. Firstly, we simulate the network when there are the same inputs to E- and I-neurons (), i.e., no input difference between the external inputs (), and find the stochastic and irregular spiking activities emerging in the network as shown in Fig. 1a. Figure 1b is the average population activity calculated from Fig. 1a, which can be described by , where . M is the number of spikes of all neurons in the time interval of . G is the Gaussian filter described by , where σ is the standard deviation. σ is set as 3 ms similar to that given in (Jadi and Sejnowski 2014a). When the width of the Gaussian window is greater than the standard deviation, the width of the Gaussian window has little effect on the frequency power distribution. In this paper, the width of the Gaussian window is set as 100 ms. The relative power spectrum can then be obtained by FFT transformation on , so the frequency corresponding to the peak power in the relative power spectrum is the oscillation frequency. The relative power spectrum is shown in Fig. 1c is calculated from the population activity in Fig. 1b. The relative power is the ratio of the power of each frequency component to the sum of the powers of all frequency components in the relative power spectrum. For convenience, we use the power to represent the relative power hereinafter. As observed in Fig. 1c, many local power peaks are implying that there is no dominating frequency residing in the population activity (note that a frequency with large power in Fig. 1c means that the corresponding frequency component in the population activity of the network in Fig. 1b is strong). Namely, the network cannot generate gamma oscillations or network synchronization with the same external inputs to E- and I-neurons.
Fig. 1.
Network simulation results (50–450 ms in a 1 s simulation). Neurons indexed 1–100 are inhibitory neurons and neurons indexed 101–500 represent excitatory neurons. a Raster plots of the spiking times of neurons without input difference. b Average population activity without input difference. c The power spectrum of the average population activity without input difference. d Raster plots of the spiking times of neurons with the typical input that S2 is 3.1 and S1 is 2.5 (). e Average population activity with the typical input that S2 is 3.1 and S1 is 2.5 (). f The power spectrum of the average population activity with the typical input that S2 is 3.1 and S1 is 2.5 ()
We next simulated the network in the first regulation case that where we increase S2 gradually from 2.6 to 3.5 but keep S1 being 2.5. Figure 1d–f show the gamma oscillation of the E/I network caused by the typical input of and , i.e., the difference between the external inputs is 0.6. There is an evidently dominating frequency in Fig. 1f with the peak power being about 0.017. The appearance of the dominant frequency implies that the population activity oscillates around that frequency, and thereby the oscillation of the population activity is denoted by the dominant frequency. The dominant frequency (the peak frequency) in Fig. 1f is the one corresponding to the peak power, which is about 52 Hz (the frequency is within the gamma band). Therefore, we can conclude that gamma oscillation occurs in the network along with the input difference and the frequency of the gamma oscillation is 52 Hz. These results imply that gamma oscillation can be caused by the large difference between the external inputs to E-neurons and I-neurons. The regulation of gamma oscillation in the second case that where we increase S1 gradually from 2.6 to 3.5 but keep S2 being 2.5, e.g., and (), can also cause gamma oscillation. The simulation results of the second regulation case are similar to those of the first case.
Enhancement of gamma oscillations with enlargement of input difference between E/I neurons
To explore the mechanism that how gamma oscillations are regulated by the difference between the external inputs, we have carried out extensive simulations and summarized the regulations of the peak frequency and peak power (reflecting the enhancement of gamma oscillations) by the input difference in Fig. 2. Figure 2 shows that the peak frequency and peak power increase with the enlargement of the input difference between E- and I-neurons. Specifically, when S2 is kept constant (is kept to be 2.5) and S1 (the external input to E neurons) is increased gradually from 2.6 to 3.5, i.e., the difference between the external inputs is increased from 0.1 to 1.0, the peak frequency of gamma oscillations increases (the blue curve in Fig. 2a) and the peak power become stronger (the blue curve in Fig. 2b) as well. Similarly, the oscillations become faster (the red curve in Fig. 2a) when S2 (the external input to I-neurons) is increased gradually from 2.6 to 3.5, i.e., the difference between the inputs to E- and I-neurons is also increased from 0.1 to 1.0, and the power also gets stronger (the red curve in Fig. 2b). The increases in the peak power in the two regulation cases imply the enhancement of gamma oscillations. Nevertheless, Fig. 2 shows that both the frequency and power of gamma oscillations do not increase monotonically with the increasing of the input difference. For example, the frequency does not increase when the input difference increases from 0.2 to 0.3 (the blue curve in Fig. 2a); the power does not increase when the input difference increases from 0.6 to 0.7 (the blue curve in Fig. 2b). These may be caused by the random factors in each run of the simulation. During each run of the simulation, the background input is generated randomly. Therefore, the firing rate of each neuron differs in each simulation. We have shown the standard deviation for each data point in Fig. 2 (10 runs for each data point). The more upward curve for the case of the increase of S2 implies that the network’s gamma oscillation is more sensitive to the changes of the external inputs to I-neurons.
Fig. 2.
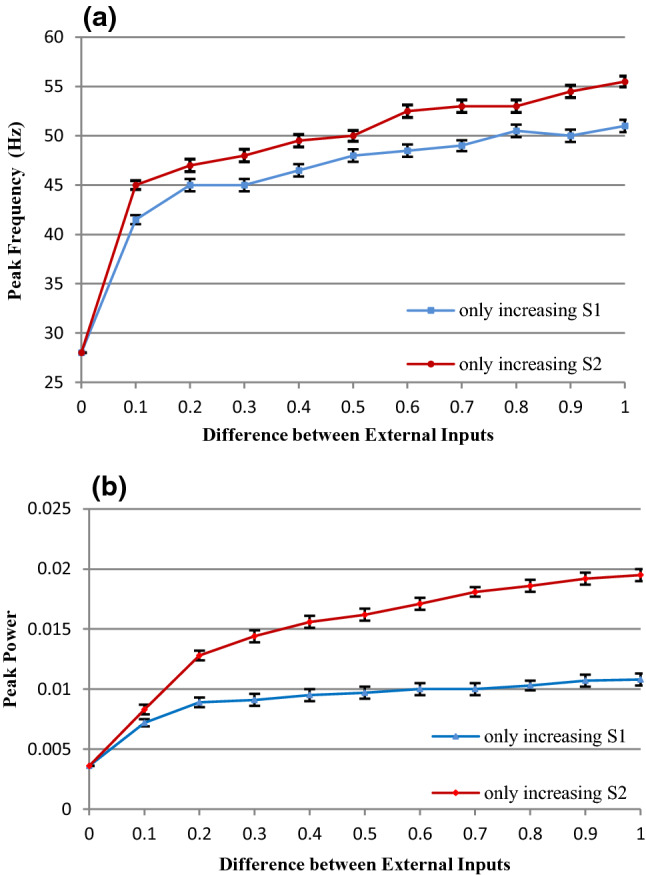
The relationship between the gamma oscillations and the input difference. a The peak frequency of the gamma oscillations versus the input difference. b The peak power of the gamma oscillations versus the input difference. (Color figure online)
In conclusion, the simulation results demonstrate that both the frequency and the strength of gamma oscillations increase with the increasing of the difference between the external inputs to excitatory and inhibitory neurons, which are consistent well with the existing biology experimental observations.
Dependency analysis of frequency on enlargement of input difference
In this section, we will analyze our simulation results that the frequency of input-regulated gamma oscillations increases with the increasing of the input difference between E- and I-neurons and then carry out the mathematical analysis to further verify the simulation results.
Analysis of the simulation results
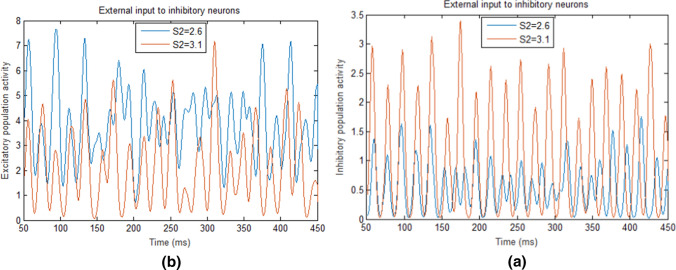
We have two ways to enlarge the input difference . The first way is to increase S2 while keeping S1 invariant. The second way is to increase S1 while keeping S2 invariant. For the first case, when the input to I-neurons (S2) is increased from 2.6 to 3.5 but the input to E-neurons (S1) is kept 2.5 (i.e., the difference between the external inputs is increased from 0.1 to 1.0), the firing rate of I-neurons in the network will increase (see the curve with the squares in Fig. 3a). This firing rate increase is intuitive because the firing rate of IAF model neurons increases monotonically with their inputs. The activity of inhibitory population also increases (an obvious activity enhancement can be observed in Fig. 4a when S2 is set as 2.6 and 3.1, respectively), thereby inhibiting the discharge activities of E-neurons and resulting in the decreases both in the firing rate of E-neurons (the curve with stars in Fig. 3a) and in the activity of excitatory population (Fig. 4b). However, the peak oscillation frequency of the network still increases because the peak oscillation frequency of the E/I network is mainly determined by the oscillation frequency of inhibitory neurons according to ING mechanism (ING mechanism suggests that the oscillation frequency is determined by the time duration for the recovery of the inhibitory neurons) (Bartos et al. 2007). Specifically, when S2 increases but S1 keeps unchanged, the activities of the inhibitory neurons dominate the E/I network, thereby the network behaves like an inhibitory network, leading to the gamma oscillation governed by ING mechanism (Tiesinga and Sejnowski 2009). According to ING mechanism, the oscillation frequency (peak frequency) of the network is determined by the firing rate of inhibitory neurons, thus the frequency of the E/I network increases with the increasing of the external input to inhibitory neurons.
Fig. 3.
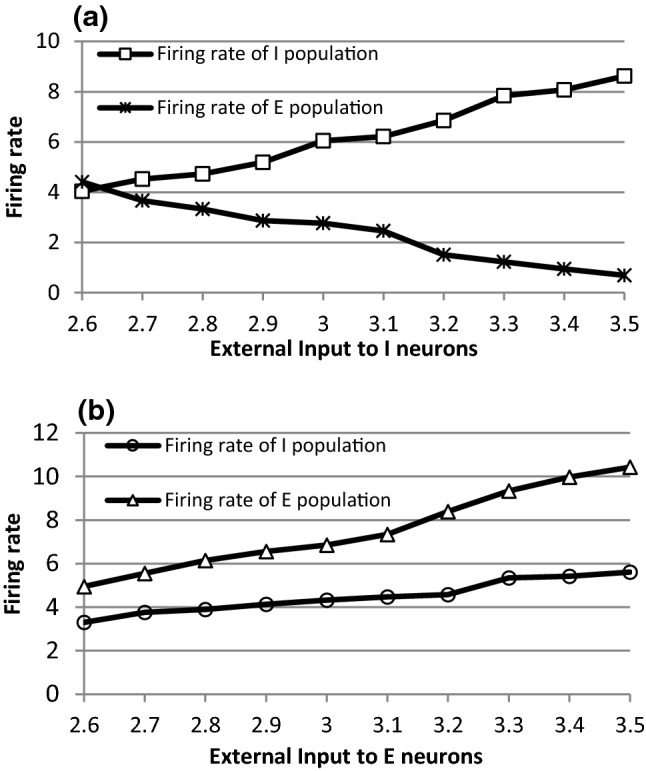
The average firing rates in the E/I network. a The change of the average firing rates of E- and I-populations with different external inputs to I-neurons. b The change of the average firing rates of E- and I-populations with different external inputs to E-neurons
Fig. 4.
E/I population activities in the E/I network with different external inputs to I-neurons (S2). a The activities of the inhibitory population when the external inputs to I-neurons (S2) are 2.6 (blue) and 3.1 (red), respectively. b The activities of the excitatory population when the external inputs to I-neurons (S2) are 2.6 (blue) and 3.1 (red), respectively. (Color figure online)
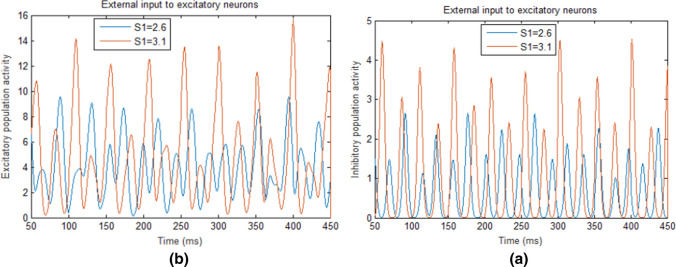
For the second case when the input to E-neurons (S1) is increased from 2.6 to 3.5 but the input to I-neurons (S2) is kept 2.5 (i.e., the difference between the external inputs is increased from 0.1 to 1.0), the average firing rate of E-neurons are enhanced (the curve with triangles in Fig. 3b) and the activity of excitatory population is also increased (see Fig. 5b). This leads to increasing excitatory synaptic inputs to inhibitory neurons and causes them to fire more frequently (see the curve with circles in Fig. 3b) or to show higher activities (see Fig. 5a). Since the activities of excitatory neurons dominate the network in this case, the network oscillation frequency does not follow ING mechanism but follow PING mechanism (PING mechanism suggests that the oscillation frequency is determined by the time duration for the recovery of the excitatory neurons from inhibition) (Tiesinga and Sejnowski 2009). Therefore, the oscillation frequency of the E/I network also increases in this case due to the increasing of average firing rate of E-neurons.
Fig. 5.
E/I population activities in the E/I network with different external inputs to E-neurons (S1). a The activities of the inhibitory population when the external inputs to E-neurons (S1) are 2.6 (blue) and 3.1 (red), respectively. b The activities of the excitatory population when the external inputs to E-neurons (S1) are 2.6 (blue) and 3.1 (red), respectively. (Color figure online)
Mathematical analysis
For a biological neuronal network discussed in the previous sections, it is very difficult to analyze the oscillation dependency on the input properties using mathematical theory. However, we can consider an ideal scenario where all E-neurons and all I-neurons fire synchronously, respectively. We analyze the oscillation frequency dependency on the input properties in such a scenario since the frequency is not sensitive to the level of synchronization of E- and I-neurons. For such a scenario, we can also view E-neuron group as one E-neuron and I-neuron group as one I-neuron since E- and I-neuron groups are synchronized. Therefore, we simplify our E/I network proposed above to a simplest model with only two neurons connected with each other (one excitatory neuron and one inhibitory neuron) to carry out the mathematical analysis. For example, according to the simulation of the first regulation case proposed in “Simulation methods” section where is increased gradually but is kept unchanged (the firing of E-neurons lags from I-neurons by small time interval ), the structure of the simplified network and the firing pattern of the synchronized E- and I-neurons are shown in Fig. 6. In Fig. 6a, the external input to I-neuron is increased from 2.6 to 3.5 and the external input to E-neuron remains unchanged at 2.5 (i.e., the input difference is increased from 0.1 to 1.0). The dots in Fig. 6b indicate the spikes of E- and I-neurons where I-neuron firstly emits a spike at time 0 and then the first spike of E-neuron is at time which is a little later than that of I-neuron. T is a discharge period of E- or I-neuron.
Fig. 6.
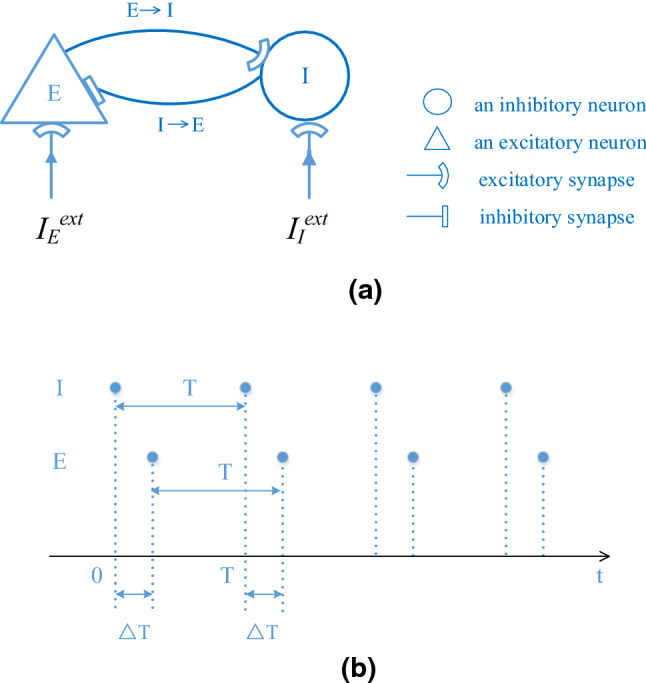
A simplified E/I network model. a The structure of the simplified E/I network consisting of one excitatory neuron and one inhibitory neuron connected with each other. b The firing of the synchronized E- and I-neurons in the simplified network. t is the spiking time of neurons
We derived the relationship between a discharge period T of I-neuron and the external input in the following “The mathematical derivation for a discharge period of I neuron” section and derive the relationship between a discharge period T of E-neuron and the external input in the following “The mathematical derivation for a discharge period of E-neuron” section respectively. Combining the analytical results of “The mathematical derivation for a discharge period of I neuron” and “The mathematical derivation for a discharge period of E-neuron” sections, we can find out the relationship between the input difference and the discharge period T, i.e., the relationship between the input difference and the firing frequency () as shown in Table 2 of “The results of the mathematical derivations”” section which further verify the simulation results shown in “Enhancement of gamma oscillations with enlargement of input difference between E/I neurons” section that the network frequency increases with the increasing of the input difference. The result of the mathematical analysis according to the simulation of the second regulation case proposed in “Simulation methods” section where is increased gradually but is kept unchanged (the firing of I-neurons lags from E-neurons by small time interval ) is similar to that of the first regulation case, which is not displayed here.
Table 2.
The discharge period and the corresponding frequency with the increasing of the input difference
| 0.1 | 0.2 | 0.3 | 0.4 | 0.5 | 0.6 | 0.7 | 0.8 | 0.9 | 1.0 | |
|---|---|---|---|---|---|---|---|---|---|---|
| T (ms) | 64.4 | 40.9 | 30.2 | 23.9 | 19.7 | 16.7 | 14.5 | 12.7 | 11.3 | 10.2 |
| f (Hz) | 15.5 | 24.4 | 33.2 | 41.9 | 50.8 | 59.9 | 69.2 | 78.6 | 88.3 | 98.1 |
The mathematical derivation for a discharge period of I neuron
In this section, we derive the relationship between a discharge period T of I-neuron and the external input according to the firing process of I-neuron described in Fig. 7. We have assumed that I-neuron firstly emits a spike at time and the following spike of E-neuron is at time . Then the synaptic current caused by the first spike of E-neuron is transmitted to I-neuron after the synaptic time delay d, which cause the second spike of I-neuron at time . This is a discharge period T of I-neuron as shown in Fig. 7b.
Fig. 7.
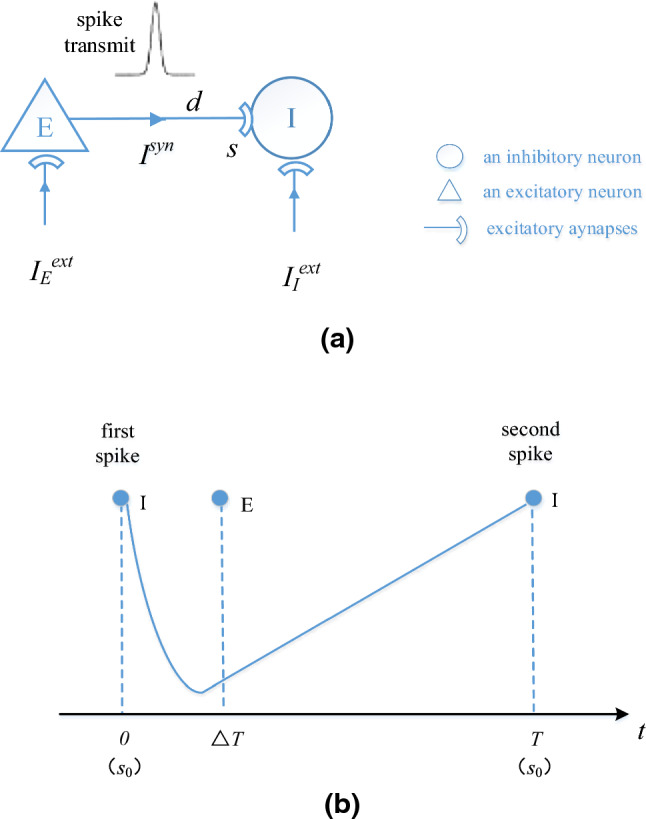
The firing process of I-neuron. a The spike transmission from E-neuron to I-neuron. b Two spikes of I-neuron in a discharge period T. The membrane potential of I-neuron is − 65 mV when t is 0 and the membrane potential of I-neuron is − 45 mV when t is T. represents the initial conductance coefficient. s represents the synaptic conductance coefficient at time t
As shown in Fig. 7b, I-neuron will decay after its first spike and the second spike will be emitted at time T after receiving the excitatory synaptic current from E-neuron. So the conductance coefficient s will decay to the initial conductance coefficient with the decay factor β at time T and can be described by the following equation:
| 4 |
Therefore, the conductance coefficient s at time t can be described as follows:
| 5 |
Thus, the analytical solution of can be given by Eq. (4):
| 6 |
Substituting Eq. (6) into (5), the analytical solution of s can be obtained:
| 7 |
According to Eq. (1), the simplified network with only two neurons can also be described as follows:
| 8 |
Since IAF neurons can be considered as a linear system before the membrane potential of neurons reaches the spiking threshold potential, the membrane potential can be calculated by the accumulation of the individual components which are determined by the input or initial components. For example, is the initial component and , , and are the input components. So, we can first calculate each component separately as follows:
| 9 |
Then, the membrane potential of I-neuron at time t can be accumulated as follows:
| 10 |
However, here the synaptic current in Eq. (10) are assumed as a constant determined by the dynamic at the moment when the spike by E-neuron arrives at the synapse. Since it is too complicated to obtain its analytical solution, at time can be calculated by Eq. (11):
| 11 |
Finally, the analytical solution of can be obtained by substituting the expression of solved from Eq. (11) into (10):
| 12 |
where , , , , , , , and . It is worthy of noting that the parameters here are a little different from those of the simulations above due to the change of the network structure. According to the firing process of I-neuron as shown in Fig. 7, I-neuron emits the second spike, i.e., when . Namely, Eq. (12) can be rewritten as the following mathematical equation including the variables T and , i.e., the relationship between a discharge period T of I-neuron and the external input is:
| 13 |
The mathematical derivation for a discharge period of E-neuron
In this section, we derive the relationship between a discharge period T of E-neuron and the external input according to the firing process of E-neuron described in Fig. 8. We assume that I-neuron firstly emits a spike at time and the following spike of E-neuron is at time . Then the synaptic current from I-neuron is transmitted to the E-neuron after the synaptic delay d, which causes the second spike of E-neuron at time T. This is a discharge period T of E-neuron, as shown in Fig. 8b.
Fig. 8.
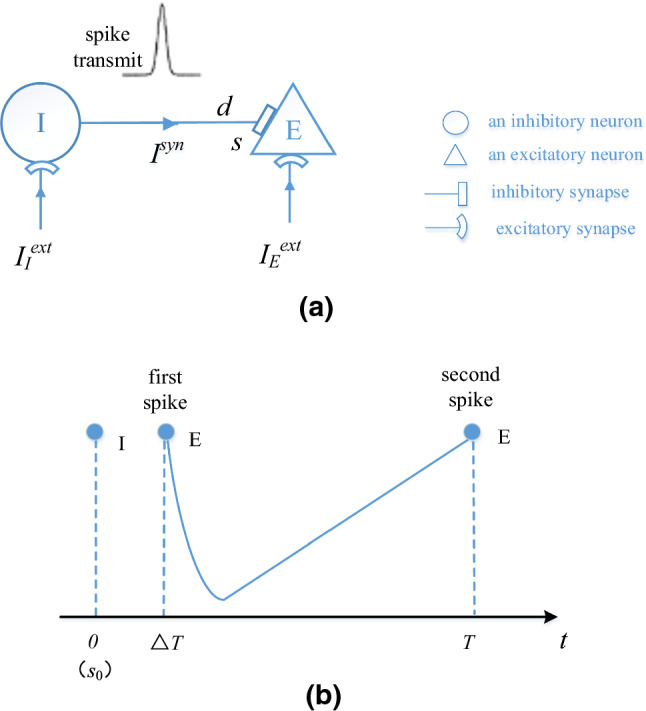
The firing process of E-neuron. a The spike transmission from I-neuron to E-neuron. b Two spikes of E-neuron in a discharge period T. The membrane potential of E-neuron is − 65 mV when t is , and the membrane potential of E-neuron is − 45 mV when t is
As shown in Fig. 8b, the initial conductance coefficient at time t can be described as:
| 14 |
Here we only consider the case of in Eq. (14), so the analytical solution of can be obtained by the following equation:
| 15 |
Namely,
| 16 |
Therefore, s at time t can be described by Eq. (17):
| 17 |
Substituting Eq. (16) into (17), the analytical solution of s can be obtained:
| 18 |
Similar to the calculation of in “The mathematical derivation for a discharge period of I neuron” section, the membrane potential of E-neuron can be calculated by the accumulation of the individual components which are determined by the input or initial components. For example, is the initial component and , , and are the input components. So, we can first calculate each component separately as follows:
| 19 |
Then, the membrane potential of E-neuron at time t can be accumulated as follows:
| 20 |
We also assume here as a constant determined by the dynamic at the moment d when the spike by I-neuron arrives at the synapse. So, at time d can be calculated by Eq. (21):
| 21 |
Finally, we can obtain the analytical solution of by substituting the solution of solved from Eq. (21) into (20):
| 22 |
where , , , , , , , and . It is worthy of noting that the parameters here are a little different from those of the simulations above due to the change of the network structure. According to the firing process of E-neuron as shown in Fig. 8, E-neuron emits the second spike, i.e., when . That is to say, Eq. (22) can be rewritten as the following mathematical equation including the variables T and , i.e., the relationship between a discharge period T of E-neuron and the external input is:
| 23 |
The results of the mathematical derivations
Combining Eqs. (13) and (23), the mathematical analysis for the relationship between the discharge period T (i.e., the frequency f) and the external inputs (i.e., the input difference is from 0.1 to 1.0, because is increased from 2.6 to 3.5 and is kept unchanged at 2.5) can be summarized as a system of equations including two invariables T and :
| 24 |
By the calculation of Eq. (24) in Matlab, we can obtain the different values of the variables T and and obtain the corresponding frequencies () of the simple network, when the external inputs are assigned the different values from 2.6 to 3.5 and is kept at 2.5 (i.e., the input difference increases from 0.1 to 1.0), as shown in Table 2. From Table 2, we can find that the discharge period T of neurons decreases as the input difference increases from 0.1 to 1.0, which indicates that the network frequency increases. In “Analysis of the simulation results” section, our simulation results have shown that the frequency of gamma oscillation increases with the increasing of the input difference. Therefore, the result of the mathematical analysis is consistent with the result of modeling simulations.
Dependency analysis of gamma oscillation strength on input difference from the perspective of synaptic current
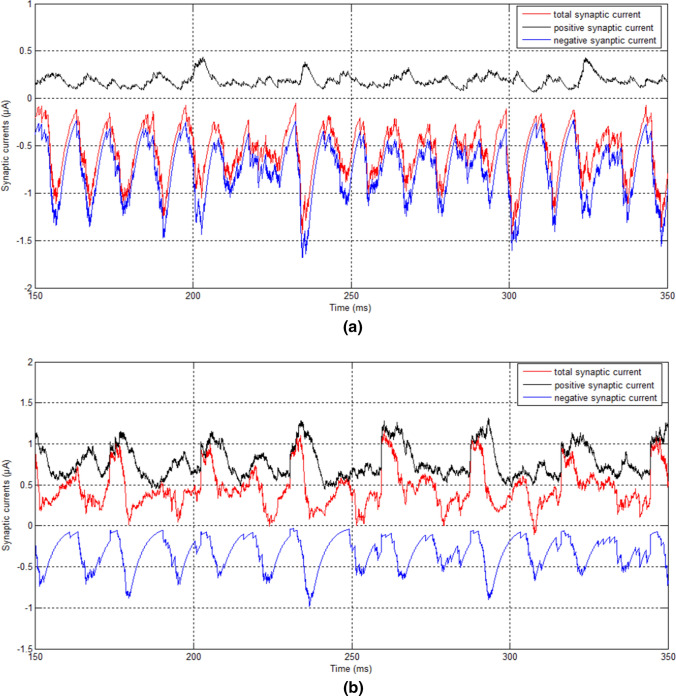
We next discuss the mechanism for the dependency of strength of input-regulated gamma oscillations on the enlargement of input difference. We believe that the mechanism may be relevant to the unbalanced state (synaptic currents) of the E/I network. When the network is in balance of the synaptic currents, i.e., the excitatory and inhibitory synaptic currents will be canceled with each other and the total synaptic current received by any neuron is near zero, the neurons in the network can be viewed as isolated neurons with no synaptic connections and fire spikes independently with each other. Such nearly isolated neurons cannot induce gamma oscillations and network synchronization, as shown in Fig. 1a–c. On the other hand, if the inputs to E- and I-neurons are different, for the first case when , for example when the input to E-neurons is 2.5 and the input to I-neurons is 3.5, the network will become unbalanced. Since the inhibitory neurons receive large inputs whereas excitatory neurons receive small inputs, the firing rates of inhibitory neurons are higher than those of excitatory neurons (see Fig. 3a), resulting in unbalanced synaptic currents between inhibition and excitation. Figure 9a shows that the summation of the negative synaptic currents from all inhibitory neurons (see blue curve and Eq. 25) is much stronger than the summation of the positive currents from all excitatory neurons (see black curve and Eq. 25) for a typical neuron randomly taken from the network, which leads to a negative aggregate current (the aggregate current is the total synaptic current which is defined by Eq. 25) fluctuating around − 0.56 μA (red curve). This negative aggregate synaptic current makes the network behave like an inhibitory network that is apt to fall in synchronization. The larger the input difference, the stronger the negative aggregate synaptic current, thereby the stronger the average aggregate synaptic current (the average aggregate synaptic current is obtained by averaging aggregate synaptic currents over time), resulting in the higher peak power (see Fig. 10a).
Fig. 9.
The aggregate synaptic current of a typical neuron taken randomly from the network received from other neurons in the unbalanced E/I network. a The case of the input to E-neurons is 2.5 and the input to I-neurons is 3.5. b The case of the input to E-neurons is 3.5 and the input to I-neurons is 2.5. (Color figure online)
Fig. 10.
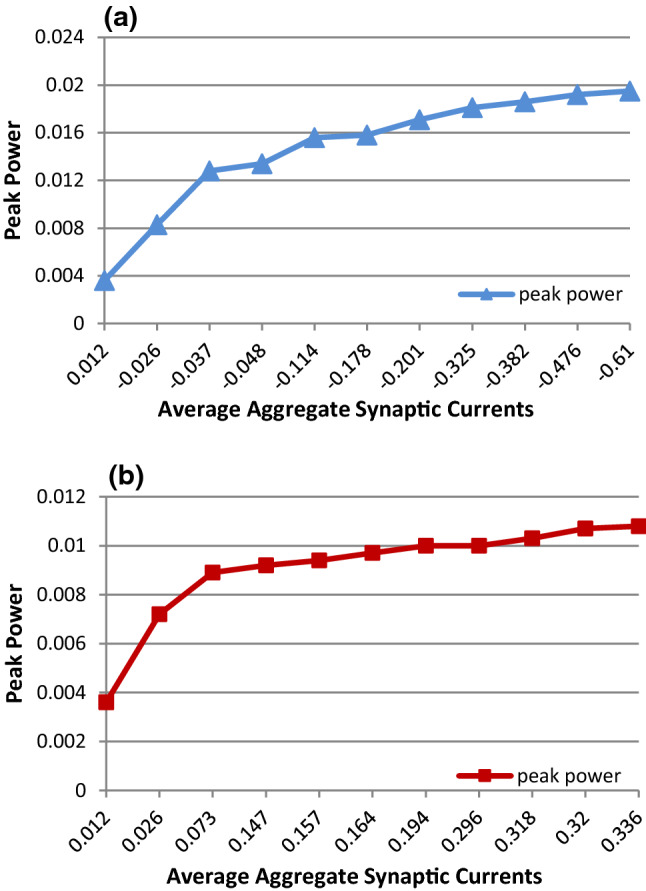
The relationship between the average aggregate synaptic current and the peak power of gamma oscillations
The aggregate synaptic current discussed in the previous paragraph is defined by:
| 25 |
where is the aggregate synaptic current received by any given neuron i, is the sum of the synaptic currents received by neuron i from all inhibitory neurons, is the sum of the synaptic currents received by neuron i from all excitatory neurons.
For the other case (e.g., the input to E-neurons is 3.5 and the input to I-neurons is 2.5), the summation of the positive currents from all excitatory neurons (see black curve in Fig. 9b and Eq. 25) is stronger than that of the negative synaptic currents from all inhibitory neurons (see blue curve in Fig. 9b and Eq. 25), leading to a positive aggregate synaptic current fluctuating around 0.46 μA (see red curve in Fig. 9b). This positive aggregate synaptic current makes the network behave like an excitatory network. Since an excitatory network could fall in synchronization in case of short synaptic delay and gamma oscillation is usually generated in local neural circuit where synaptic delay is short, the larger input difference will cause the larger positive aggregate synaptic current, thereby the stronger the average aggregate synaptic current, resulting in the higher peak power (see Fig. 10b).
Combining the two regulation cases discussed above, we can find that the greater the input difference between E/I neurons, the stronger the aggregate inhibitory or excitatory synaptic current, which leads to the better synchronization and stronger gamma oscillation of the network exhibiting the higher peak power of the power spectrum.
Discussion and conclusion
Gamma oscillations exist in many regions of real neural systems. Modeling works for the mechanisms of gamma oscillations have been carried out extensively. Some researches suggested that gamma oscillations were generated by spike-to-spike synchrony (Tiesinga and Sejnowski 2009; Bartos et al. 2007), while other researches believed that gamma oscillations were caused by firing-rate synchrony (Brunel and Wang 2003). As for the contributions of E-neurons and I-neurons to gamma oscillations, some researches proposed the inter-neuron-gamma (ING) mechanism (Bartos et al. 2007), while others proposed the pyramidal-interneuron-gamma (PING) mechanism (Tiesinga and Sejnowski 2009). Moreover, previous researches on gamma oscillations mainly investigated the mechanism of gamma oscillations with fixed frequency.
However, biology experiments have shown that gamma oscillations and the oscillation frequencies are regulated by the change of external stimuli (inputs). Jadi and Sejnowski (2014a) constructed a network with simplified stochastic neuron model to explain this external stimuli-regulated gamma oscillation. Jadi and Sejnowski (2014b) also explored and discussed this external stimuli-regulated gamma oscillation by modeling research but their model was a simplified firing rate model. However, it is unclear whether gamma oscillations can be regulated by external stimuli in a relatively complex network model such as a model composed of integrate-and-fire (IAF) neurons. Therefore, we constructed an E/I neural network model composed of IAF neurons and conductance-based synapses to deeply investigate the mechanism of the external stimuli-regulated gamma oscillation. Since the properties of external stimuli can be mapped to the inputs of neurons in the E/I network according to Jadi and Sejnowski (2014a), we changed inputs to E- and I-neuron populations respectively, and studied the dependency of the oscillation strength and frequency on the input difference. In addition, mathematical analysis was carried out in our work, which lacks in existing modeling researches (Jadi and Sejnowski 2014a, b), to obtain the equation describing the clear relationship between the frequency and the input difference. Our work can be summarized as follows.
Our simulation results show that the larger the input difference between E- and I-neurons, the higher the frequency and the stronger gamma oscillations respectively, which are consistent well with the biology experimental observations. We have further found the underlying mechanisms of these numerical or biology experimental observations. Further investigation shows that gamma oscillation is caused by the unbalance between positive and negative synaptic currents. If the inputs to inhibitory neurons are larger than those to excitatory neurons, the aggregate synaptic current to each neuron in the network will be negative, which makes the behavior of the network to be governed by ING mechanism. Thus, the larger is the input difference between E/I neurons, the higher will be the average firing rate of I-neurons and the stronger will be the negative aggregate synaptic current, that leads to higher frequency and stronger gamma oscillations. On the other hand, if the inputs to excitatory neurons are larger than those to inhibitory neurons, the aggregate synaptic current to each neuron in the network will be positive, which makes the behavior of the network to be governed by PING mechanism. Thus, the larger the input difference between E/I neurons, the higher will be the average firing rate of E-neurons and the stronger will be the excitatory aggregate synaptic current, that leads to higher frequency and stronger gamma oscillations.
Furthermore, we carried out the mathematical analysis with a simplified network with one excitatory neuron and one inhibitory neuron. It is obtained that the discharge period of neurons decreases with the increasing of the input difference, indicating that the frequency increases with the increasing of the input difference. The results of the mathematical analysis are consistent with our simulation results well, which provides a better way to understand the mechanism of external stimuli-regulated gamma oscillations.
Acknowledgements
This work was supported by the National Natural Science Foundation of China (Grants Nos. 11972115, 11572084), Shanghai Municipal Science and Technology Major Project (No. 2018SHZDZX01), Key Laboratory of Computational Neuroscience and Brain-Inspired Intelligence (LCNBI) and ZJLab.
Footnotes
Publisher's Note
Springer Nature remains neutral with regard to jurisdictional claims in published maps and institutional affiliations.
Contributor Information
Fang Han, Email: yadiahan@dhu.edu.cn.
Zhijie Wang, Email: wangzj@dhu.edu.cn.
References
- Adjamian P, Hadjipapas A, Barnes GR, et al. Induced gamma activity in primary visual cortex is related to luminance and not color contrast: an MEG study. J Vis. 2008;8(7):1–7. doi: 10.1167/8.7.4. [DOI] [PubMed] [Google Scholar]
- Araki O, Tsuruoka Y, Urakawa T. A neural network model for exogenous perceptual alternations of the Necker cube. Cogn Neurodyn. 2020;14(11):229–237. doi: 10.1007/s11571-019-09565-6. [DOI] [PMC free article] [PubMed] [Google Scholar]
- Bartos M, Vida I, Jonas P. Synaptic mechanisms of synchronized gamma oscillations in inhibitory interneuron networks. Nat Rev Neurosci. 2007;8(1):45–56. doi: 10.1038/nrn2044. [DOI] [PubMed] [Google Scholar]
- Brunel N, Wang XJ. What determines the frequency of fast network oscillations with irregular neural discharges? J Neurophysiol. 2003;90:415–430. doi: 10.1152/jn.01095.2002. [DOI] [PubMed] [Google Scholar]
- Burns SP, Xing D, Shapley RM. Is gamma-band activity in the local field potential of V1 cortex a ‘clock’ or filtered noise? J Neurosci. 2011;31(26):9658–9664. doi: 10.1523/JNEUROSCI.0660-11.2011. [DOI] [PMC free article] [PubMed] [Google Scholar]
- Dayan P, Abbott LF. Theoretical neuroscience: computational and mathematical modeling of neural systems. Cambridge: MIT Press; 2001. [Google Scholar]
- Henrie J, Shapley R. LFP power spectra in V1 cortex: the graded effect of stimulus contrast. J Neurophysiol. 2005;94:479–490. doi: 10.1152/jn.00919.2004. [DOI] [PubMed] [Google Scholar]
- Hipp JF, Engel AK, Siegel M. Oscillatory synchronization in large-scale cortical networks predicts perception. Neuron. 2011;69(2):387–396. doi: 10.1016/j.neuron.2010.12.027. [DOI] [PubMed] [Google Scholar]
- Jadi MP, Sejnowski TJ. Cortical oscillations arise from contextual interactions that regulate sparse coding. Proc Natl Acad Sci. 2014;111(18):6780–6785. doi: 10.1073/pnas.1405300111. [DOI] [PMC free article] [PubMed] [Google Scholar]
- Jadi MP, Sejnowski TJ. Regulating cortical oscillations in an inhibition-stabilized network. Proc IEEE. 2014;102(5):830–842. doi: 10.1109/JPROC.2014.2313113. [DOI] [PMC free article] [PubMed] [Google Scholar]
- Kim S, Lim W. Effect of spike-timing-dependent plasticity on stochastic burst synchronization in a scale-free neuronal network. Cogn Neurodyn. 2018;12(3):315–342. doi: 10.1007/s11571-017-9470-0. [DOI] [PMC free article] [PubMed] [Google Scholar]
- Kim S, Lim W. Effect of interpopulation spike-timing-dependent plasticity on synchronized rhythms in neuronal networks with inhibitory and excitatory populations. Cogn Neurodyn. 2020 doi: 10.1007/s11571-020-09580-y. [DOI] [PMC free article] [PubMed] [Google Scholar]
- Malagarriga D, Pons AJ, Villa AEP. Complex temporal patterns processing by a neural mass model of a cortical column. Cogn Neurodyn. 2019;13:379–392. doi: 10.1007/s11571-019-09531-2. [DOI] [PMC free article] [PubMed] [Google Scholar]
- Neymotin SA, Lee H, Park E, Fenton AA, et al. Emergence of physiological oscillation frequencies in a computer model of neocortex. Front Comput Neurosci. 2011;5:19. doi: 10.3389/fncom.2011.00019. [DOI] [PMC free article] [PubMed] [Google Scholar]
- Orekhova EV, Butorina AV, Sysoeva OV, et al. Frequency of gamma oscillations in humans is modulated by velocity of visual motion. J Neurophysiol. 2015;114(1):244–255. doi: 10.1152/jn.00232.2015. [DOI] [PMC free article] [PubMed] [Google Scholar]
- Perry G, Randle JM, Koelewijn L, et al. Linear tuning of gamma amplitude and frequency to luminance contrast: evidence from a continuous mapping paradigm. PLoS ONE. 2015;10(4):e0124798. doi: 10.1371/journal.pone.0124798. [DOI] [PMC free article] [PubMed] [Google Scholar]
- Ray S, Maunsell JH. Differences in gamma frequencies across visual cortex restrict their possible use in computation. Neuron. 2010;67(5):885–896. doi: 10.1016/j.neuron.2010.08.004. [DOI] [PMC free article] [PubMed] [Google Scholar]
- Ray S, Maunsell JH. Different origins of gamma rhythm and high-gamma activity in macaque visual cortex. PLoS Biol. 2011;9(4):e1000610. doi: 10.1371/journal.pbio.1000610. [DOI] [PMC free article] [PubMed] [Google Scholar]
- Sacerdote L, Giraudo MT. Stochastic integrate and fire models: a review on mathematical methods and their applications. Quant Biol. 2013;2058:99–148. [Google Scholar]
- Saleem AB, Lien AD, Krumin M, et al. Subcortical source and modulation of the narrowband gamma oscillation in mouse visual cortex. Neuron. 2017;93(2):315–322. doi: 10.1016/j.neuron.2016.12.028. [DOI] [PMC free article] [PubMed] [Google Scholar]
- Tiesinga P, Sejnowski TJ. Cortical enlightenment: are attentional gamma oscillations driven by ING or PING? Neuron. 2009;63(6):727–732. doi: 10.1016/j.neuron.2009.09.009. [DOI] [PMC free article] [PubMed] [Google Scholar]
- Vida I, Bartos M, Jonas P. Shunting inhibition improves robustness of gamma oscillations in hippocampal interneuron networks by homogenizing firing rates. Neuron. 2006;49(1):107–117. doi: 10.1016/j.neuron.2005.11.036. [DOI] [PubMed] [Google Scholar]
- Wallace E, Benayoun M, Drongelen WV, et al. Emergent oscillations in networks of stochastic spiking neurons. PLoS ONE. 2011;6:e14804. doi: 10.1371/journal.pone.0014804. [DOI] [PMC free article] [PubMed] [Google Scholar]
- Wang XJ, Buzsáki G. Gamma oscillation by synaptic inhibition in hippocampal interneuronal network model. J Neurosci. 1996;16(20):6402–6413. doi: 10.1523/JNEUROSCI.16-20-06402.1996. [DOI] [PMC free article] [PubMed] [Google Scholar]


